Cosmological Implications of Two Conflicting Deuterium Abundances
Abstract
Constraints on big bang nucleosynthesis (BBN) and on cosmological parameters from conflicting deuterium observations in different high red-shift QSO systems are discussed. The high deuterium observations by Carswell et al., Songaila et al., and Rugers & Hogan is consistent with 4He and 7Li observations and Standard BBN ( =3) and allows at 95% C.L., but is inconsistent with local observations of D and 3He in the context of conventional theories of stellar and Galactic evolution. In contrast, the low deuterium observations by Tytler, Fan & Burles and Burles & Tytler are consistent with the constraints from local Galactic observations, but require at 68% C.L., excluding Standard BBN at 99.9% C.L., unless the systematic uncertainties in the 4He observations have been underestimated by a large amount. The high and low primordial deuterium abundances imply, respectively, and at 95% C.L. When combined with the high baryon fraction inferred from x-ray observations of rich clusters, the corresponding total mass densities (for ) are and , respectively (95% C.L.) The range of corresponding to high D is in conflict with dynamical constraints () and with the shape parameter constraint () from large scale structure formation in CDM and CDM models.
pacs:
PACS numbers:I Introduction
Among the light nuclides synthesized during the early evolution of the universe, deuterium is unique in its sensitivity to the universal density of baryons and in the simplicity of its galactic evolution. As gas is incorporated into stars and the heavy elements are synthesized, D is only destroyed [1] so that any D abundance inferred from observations provides a lower bound to its primordial value. *** , where the D mass fraction is ; is the hydrogen mass fraction, and is the number density for nuclide ; the subscript P is for the primordial abundance. As an estimate of the primordial value , we will adopt . In this paper we quote 1 uncertainties unless otherwise indicated. Unfortunately, an upper bound to the primordial D abundance is more uncertain, depending on the evolutionary history of the matter being observed. Thus, although estimates of the D abundance in the presolar nebula [2, 3] and in the local interstellar medium (ISM) [4, 5] provide interesting lower bounds to primordial D [, , where the H mass fraction has been taken to be ], upper bounds are more model dependent (see, for example, Ref. [6, 7, 8, 3, 9]). For this reason, observations of D in (nearly) unevolved systems (high red-shift, low metallicity QSO absorbers) have been eagerly anticipated. If, indeed, , then because of the sensitivity of the D abundance to the nucleon abundance (; the ratio of the present baryon density to the critical density is , where the Hubble parameter is km/s/Mpc and ), a measurement of (D/H)QSO to 30% accuracy will lead to a determination of to 20% accuracy. Armed with , reasonably accurate predictions of the primordial abundances of 3He, 4He, and 7Li will follow (see, for example, Ref. [9]). For example, for , a 20% uncertainty in will lead to an uncertainty in the predicted 4He mass fraction which ranges from (at low ) to (at high ). Deuterium is the ideal baryometer.
In the last two years, observations of D in high red-shift, low metallicity QSO absorbers have begun to appear in the published literature [10, 11, 12, 13, 14]. The first observations of D in absorption against Q0014+813 [10, 11, 12] suggested a surprisingly high abundance [for our quantitative comparisons we will adopt the recent reanalysis by Rugers and Hogan: D/H = , ], roughly an order of magnitude larger than the presolar or ISM values (, ). As such efficient D destruction in the Galaxy is not expected [6, 7, 8, 3, 15] it has been suggested that the feature identified as D in Q0014+813 might be a hydrogen interloper [16]. However, the Rugers-Hogan reanalysis argues against this possibility. Further, recent papers [17, 18] present evidence for D absorption in front of two other QSOs (Q0420-388 and BR1202-0725, respectively) which, if the identifications are correct, suggest and , respectively. Although puzzling from the point of view of chemical evolution in the Galaxy, the high D abundance points towards a low baryon density () which is consistent with the predicted and observed (inferred) primordial abundances of 4He and 7Li [16, 19]. As we shall see, however, this low baryon density () is in conflict with determinations of the total mass density and the baryon fraction inferred from x-ray observations of rich clusters.
In contrast, from recent observations, Tytler, Fan, and Burles [13] and Burles and Tytler [14] derive a low D abundance: (stat) (sys) towards the QSO1937-1009 [13] and (stat) (sys)] towards the QSO1009+2956 [14]. We have combined their two results to obtain (D/H); . Although marginally larger than ISM deuterium (), the low D abundance is not very different from the presolar value (), suggesting that even though the absorbers are at high redshift ( = 3.572 and 2.504) and have very low metallicity ( solar), some D may have already been destroyed (). If indeed (no significant D destruction), then the problems for BBN identified by Hata et al. [19], which were based on inferred from solar system observations of D and 3He, persist. The higher baryon density suggested by the low D result is, however, in agreement with the x-ray cluster data (but still supports a low density universe).
It is hoped that future observations of D in other high red-shift, low metallicity QSO absorbers will resolve the current dichotomy between the high D result for Q0014+813 on the one hand [10, 11, 12] and the low D results for Q1937-1009 and Q1009+2956 on the other [13, 14]. Here, we explore the implications for cosmology (the baryon density), for the primordial abundances of the other light nuclides (4He and 7Li), and for particle physics (bounds to the effective number of equivalent light neutrinos, ), of the high D abundance and contrast them with those for the low D abundance.
II Primordial D and BBN
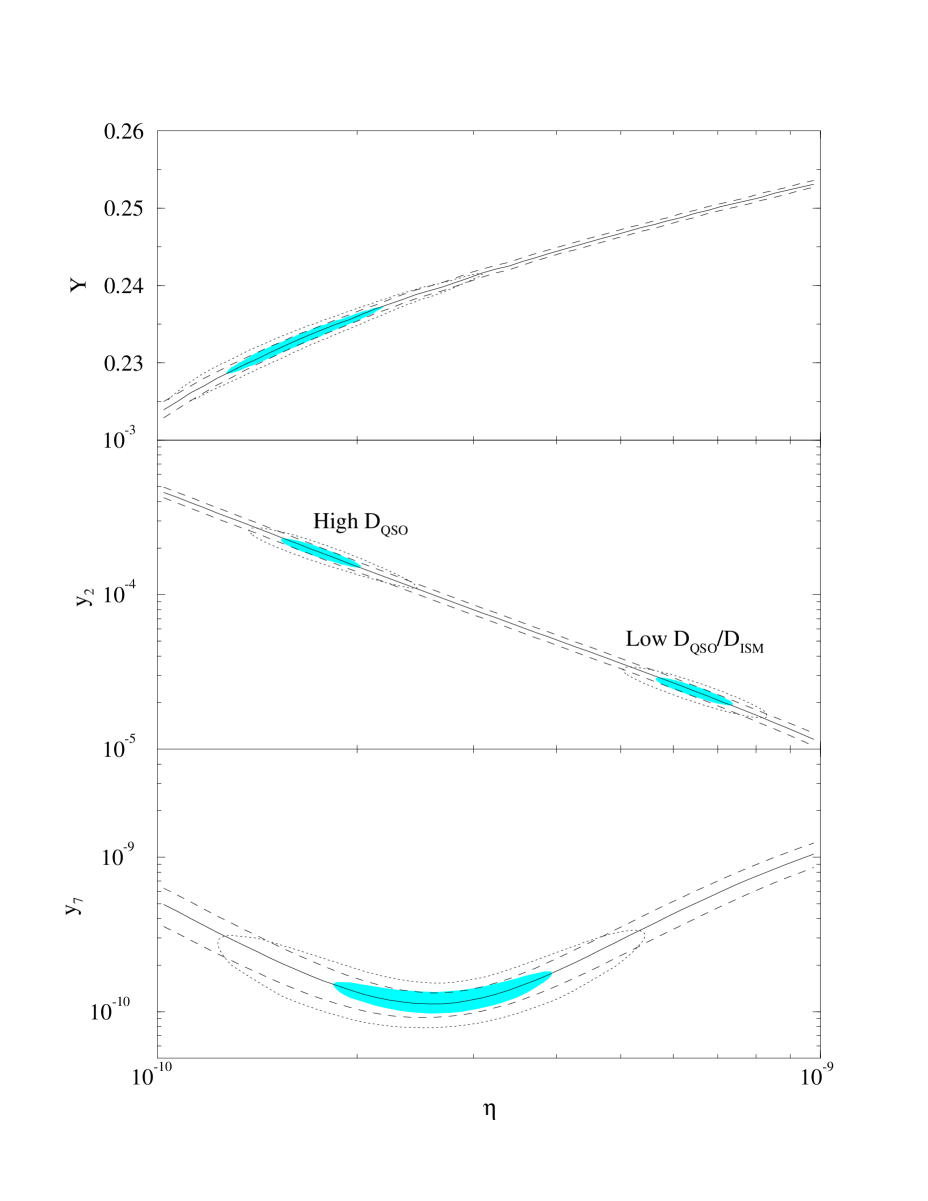
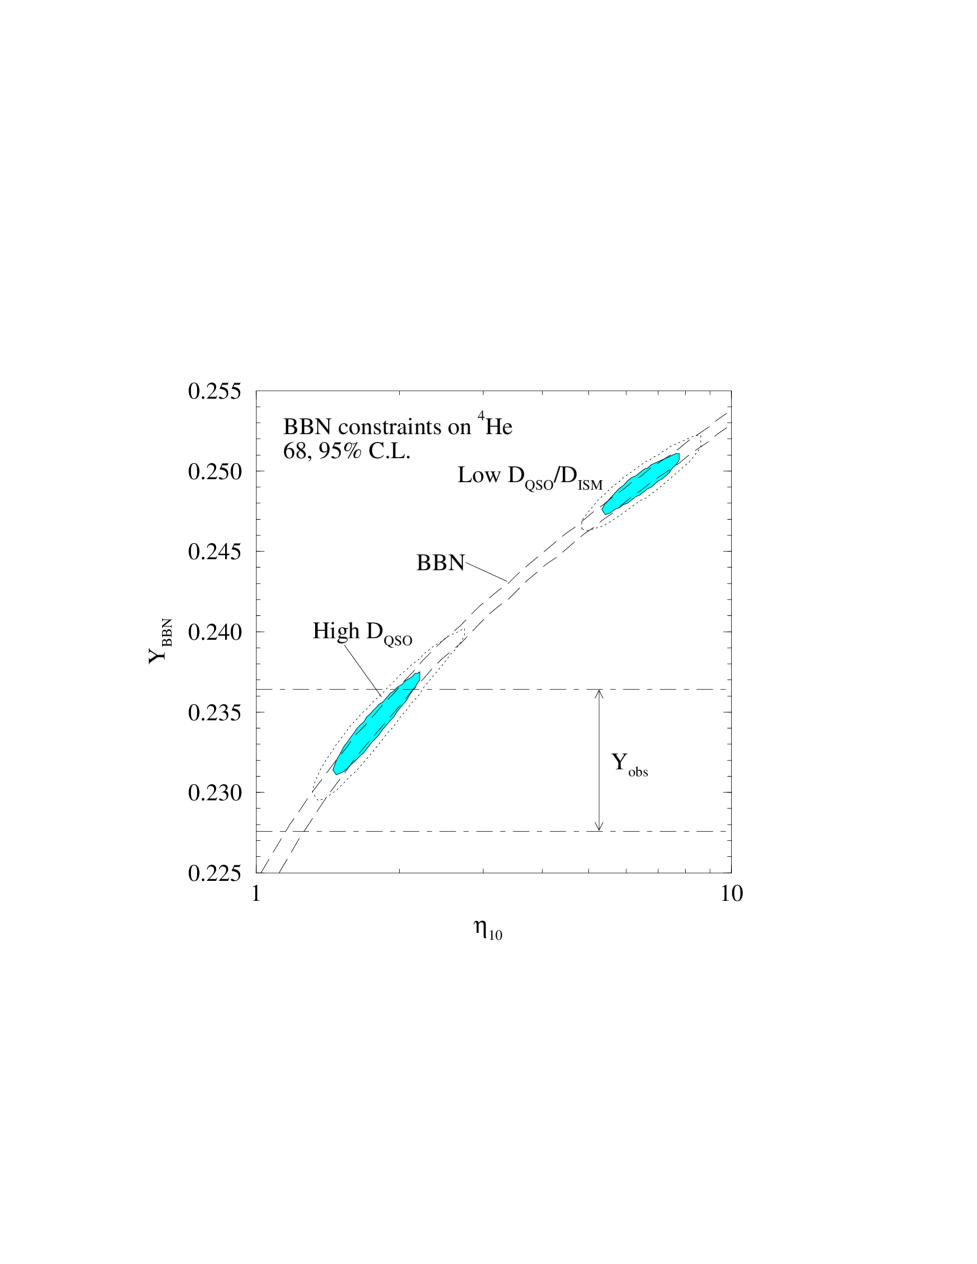
If (D/H)P is fixed, standard big bang nucleosynthesis (SBBN: homogeneous, , the neutron life time s, etc) can be used to predict the primordial abundances of the other light nuclides and determine the present baryon density. In Fig. 1 the SBBN predicted abundances of 4He (mass fraction ), D ( = D/H), and 7Li ( = 7Li/H) are shown as a function of the nucleon to photon ratio for . Convolving the SBBN predictions (including uncertainties estimated by the Monte Carlo method of Ref [20]) with the high D and low D results constrains and leads to predictions of and as may be seen in Fig. 1. Also shown in Fig. 1 are the 68 and 95% C.L. contours for the overlap between the inferred primordial abundances of 4He [ (stat) (sys)] and 7Li [log (sys) (depletion/creation)] ††† The statistical uncertainty in 4He is assumed to be Gaussian, while the systematic uncertainties in 4He and 7Li and the uncertainty in 7Li depletion/creation are treated as flat (top hat) distributions. The statistical uncertainty in is small compared to the systematic and depletion/creation uncertainties. and the BBN predictions. When using the low D value we must ensure that consistency with the ISM (and solar system) value is maintained (; ). In Fig. 2 we show the SBBN likelihood distribution (solid curve) for the low D result [; ]. Requiring that the QSO D abundance be no smaller than the ISM D abundance [], modifies the distribution to the dotted curve in Fig. 2, very slightly truncating the lower end of the distribution []. It is this latter distribution which we will use in our comparisons. If, further, we also require that the QSO D abundance exceeds that inferred for the presolar nebula [] [2], the distribution (dashed curve in Fig. 2) is slightly shifted to higher values []. Given that the solar system data may be subject to different systematic errors than those associated with the QSO and ISM absorption observations, we will limit our analysis to those which follow from the marginally less restrictive QSO/ISM constraint. The resulting SBBN constraints on , , , , and which follow from the high and low-QSO/ISM D abundances are summarized in Table I along with, for comparison, the previous Hata et al. results [9] which utilized solar system D and 3He abundances. Fig. 3 shows the likelihood distributions for for high and low primordial deuterium.
A glance at Fig. 1 reveals the well-known result [21] that high-D is consistent with the primordial 4He abundance inferred from HII region data. In Fig. 4 is shown the SBBN predicted 4He mass fractions corresponding to the two deuterium values. It is clear from Figs. 1 and 4 that, in the absence of large systematic errors in 4He, the observed 4He abundance favors high-D and is inconsistent with low-D.
In Fig. 5 we compare the SBBN predictions of 7Li for high and low deuterium with that inferred from observations of the Pop II halo stars [22, 23, 24, 25]. As is clear from Figs. 1 and 5, and Table I, consistency with lithium is achieved for both high and low D. Notice, however, that while the high-D (low ) overlap with SBBN bounds stellar destruction/dilution of 7Li (; log ), the low-D (high ) overlap actually requires some modest destruction/dilution (; log ).
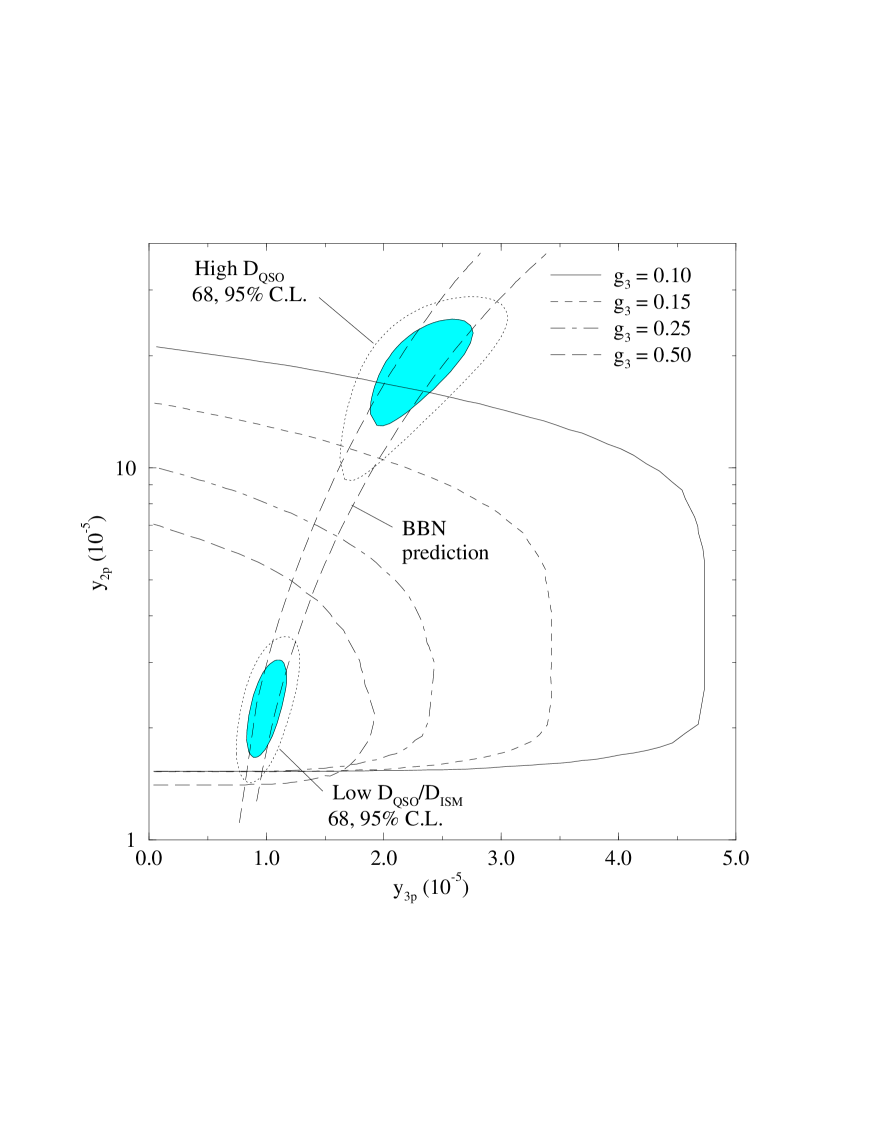
Finally, we turn to 3He, whose post-BBN evolution is model (galactic chemical evolution) dependent. However, since production of 3He by low mass stars can only increase the 3He abundance, observations of D and 3He constrain the primordial D and 3He abundances [26, 27, 3, 9]. For any chemical evolution history the observed and primordial abundances of D and 3He may be related through one parameter , the effective 3He stellar survival fraction, which contains all the stellar and galactic evolution uncertainties [26, 3, 9]. While for a single generation of stars [28, 29], many specific evolution models suggest [8, 30, 29]. Following Ref. [9] we show in Fig. 6 the allowed regions in the – plane inferred from SBBN and the high and low deuterium abundances. Although the low-D data is entirely consistent with the galactic evolution of D and 3He, the high-D data requires a surprisingly small value of ( at 95% C.L.) for consistency. Indeed, the high-D data suggests that more than 90% of the present ISM has been cycled through stars (since D would have to have been destroyed by a factor of ). With such efficient processing of gas through stars, the low metallicity of the ISM is a challenge to galactic chemical evolution models [6, 7].
III SBBN and
From the discussion above it is clear that high primordial D is entirely consistent with the predictions of SBBN and the observed abundances of 4He and 7Li. For low primordial D there is a significant tension between the predictions of SBBN and the inferred primordial abundance of 4He. If we allow , the equivalent number of light neutrinos, to depart from the SBBN value , we may use the combined D, 4He, and 7Li data to find the best . Fig. 7 shows the likelihood distributions for high and low (QSO/ISM) D; for comparison we also show the distribution derived from solar system D and 3He with [9]. Of course, it is always possible that , inferred from nearly primordial (low metallicity) extragalactic HII regions [31, 32, 33], has been underestimated due to systematic errors. Although such uncertainties (ionization corrections, collisional excitation corrections, corrections for dust, corrections for stellar absorption, etc.) could either decrease or increase the inferred value (), recent work has emphasized those corrections which might increase [34, 35]. If we write (where 0), then there is a direct relation between and , which we show for high and low deuterium in Fig. 8. For , high-D and SBBN are consistent (), but, if is larger, would be required. In contrast, SBBN and low-D are inconsistent unless .
IV and
Either choice of high or low deuterium leads, through SBBN, to reasonably tight constraints on the present ratio of nucleons to photons (see Fig. 1 and Table I), thus bounding the present universal density of baryons . Comparing to the critical density , we have
| (1) |
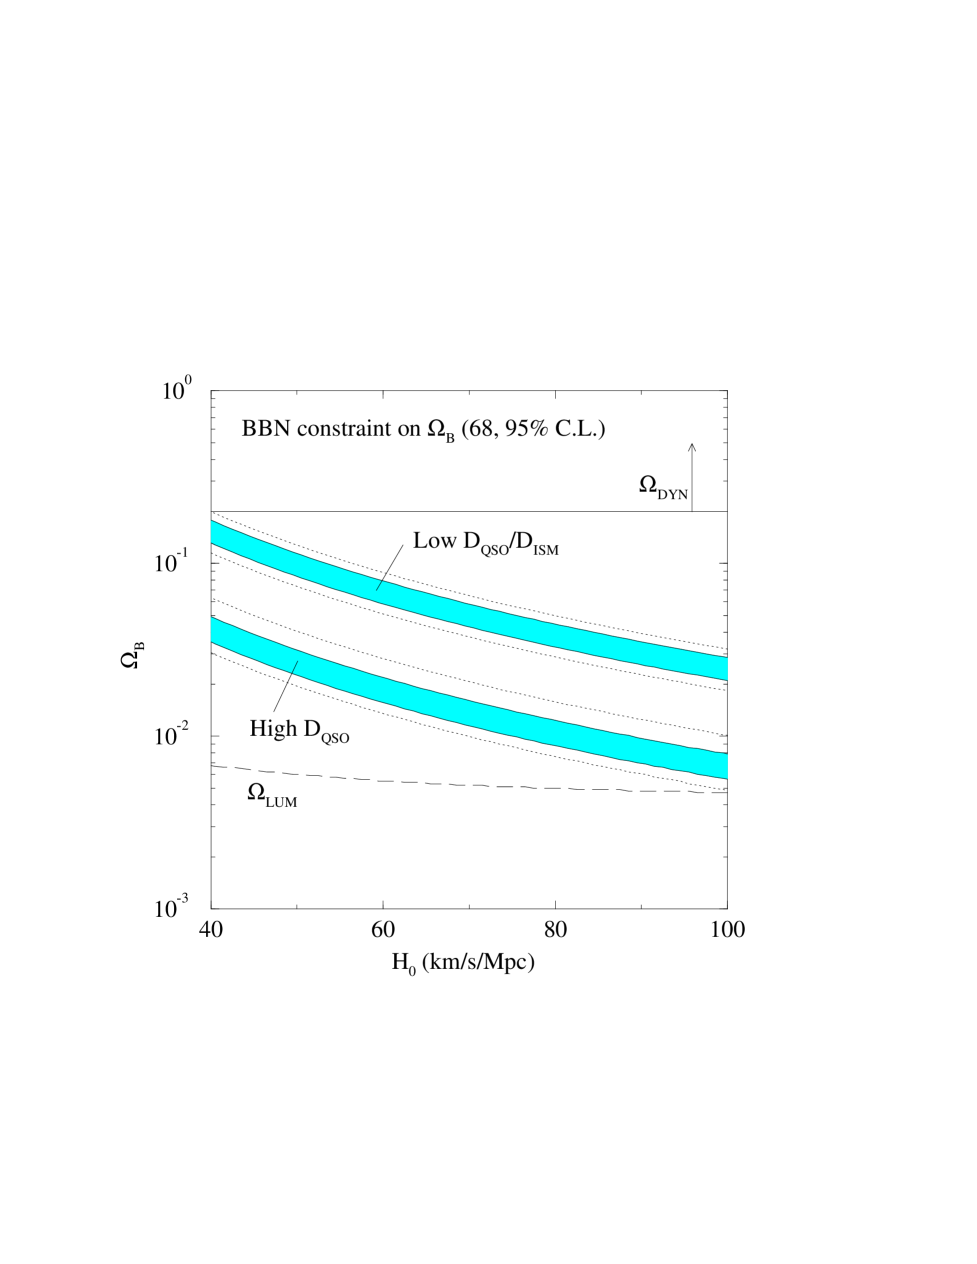
In Fig. 9 we show the vs. relation, where the two bands correspond to the 68 and 95% C.L. ranges for allowed by the QSO D abundances (see Table I). Also shown in Fig. 9 is an estimate of the luminous baryons identified by observations in the radio, optical, ultra-violet, and x-ray parts of the spectrum[36],
| (2) |
Over the entire range of , , suggesting the presence of dark baryons. As a minimum estimate of the total density (baryons plus non-baryonic dark matter) inferred from the dynamics of groups, clusters, etc., we have adopted [37, 38, 39] (although others have suggested [40]). As can be seen from Fig. 9, unless is very small (and D is very low), , providing support for the presence of non-baryonic dark matter.
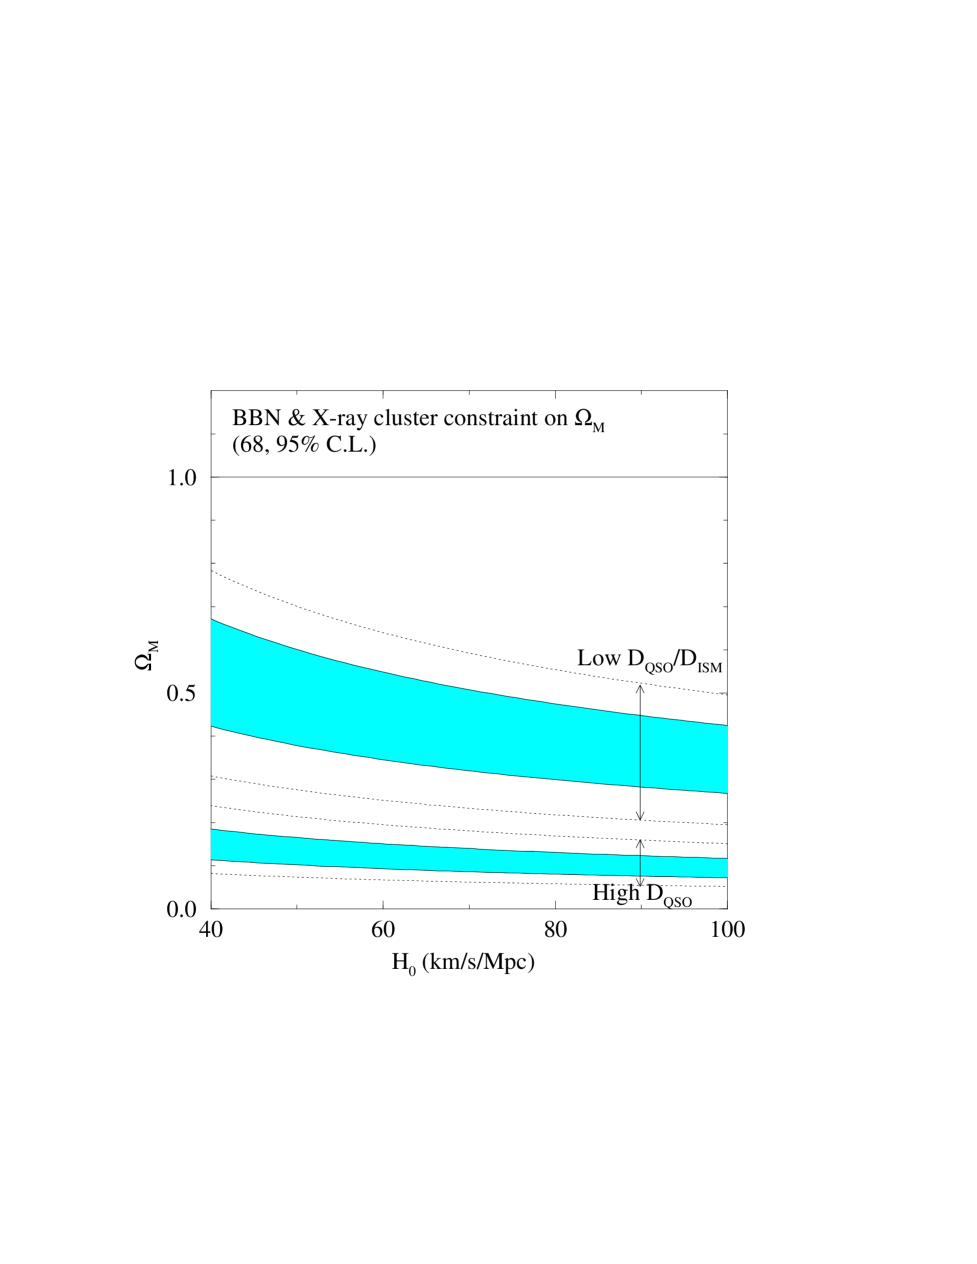
X-ray emission from the hot (baryonic) gas in rich clusters of galaxies offers a valuable probe of the fraction of the total mass in the universe contributed by baryons. Although relatively rare, such large mass concentrations are expected to provide a fair sample of , where is the total matter density parameter [41, 42, 43]. For clusters, , where is the mass of the x-ray emitting hot gas in the cluster and is the total mass which determines the cluster binding. It is conventional to write , where km/s/Mpc, so that
| (3) |
The inequality in (3) arises from the neglect of the baryons in the galaxies of the cluster; their inclusion would reduce the upper bound on by 5–20% (depending on ). However, since the presence of other (dark) baryons (e.g., Machos) cannot be excluded observationally and may be large [44], the cluster data is best utilized to provide an bound to . Thus, in our subsequent analysis we shall employ x-ray data and BBN to evaluate the right hand side of Eqn. 3 which we will use to provide an upper bound to (as a function of ).
The surprise provided by x-ray observations of rich clusters has been the relatively large baryon fraction () which, when coupled to the relatively low upper bound on from BBN, has led to the “X-Ray Cluster Baryon Catastrophe” [41, 42, 45]: unless is very small.
Following the recent analysis of Evrard et al. [43] and Evrard [46], we adopt , and use this and the bounds on from high and low D (see Table I) to constrain the vs. relation (Eqn. 3) in Fig. 10. We have allowed to remain unconstrained although we believe that recent data suggest km/s/Mpc ( and ). The x-ray cluster constraints require low , excluding the preferred Einstein-de Sitter value of unless and/or is much smaller than data indicate.
Further evidence for low in the context of cold dark matter models (CDM) comes from large scale structure constraints on the shape parameter (see, for example, [47]): . Since the popular inflationary paradigm suggests that the 3-space curvature may vanish, evidence in favor of low has led to consideration of an alternative cosmology with a non-vanishing cosmological constant () such that (see, for example, [45]). Such cold dark matter models (CDM) provide the additional benefit of helping to resolve the “age problem” (for the same value of , and fixed , a CDM universe is older than the corresponding CDM universe). In Figs. 11 and 12 we show (at 68% C.L.) the regions in the – plane consistent with the x-ray/BBN constraints (for high and low D) and with the shape parameter (). Also shown is the – relation for two choices of the present age of the universe ( = 12 and 15 Gyr) along with the dynamically inferred lower bound to the mass density (). In both cases (CDM and CDM), the low-D, high- choice is preferred over the high-D, low- result.
A third popular cosmology is the mixed, hot plus cold dark matter model (HCDM; see for example, [48, 49, 50]). In its standard version it is assumed that , but that % of is in hot dark matter (e.g., neutrinos with mass of 1 – 10 eV) which is relatively unclustered on large scales. The shape parameter constraint is not relevant to constraining the HCDM model, but the requirement that exacerbates the x-ray cluster baryon catastrophe [41, 42, 43, 45] and the age problem. Even if all HDM could be excluded from x-ray clusters [51], which seems unlikely [52], . Coupled with the upper bound from the x-ray cluster data, , this requires , nearly closing the preferred window () on HCDM models.
V Discussion
A determination of the deuterium abundance in a nearly uncontaminated environment such as that provided by high redshift, low metallicity QSO absorption clouds could be a key to testing the consistency of primordial nucleosynthesis in the standard, hot, big bang cosmology, to pinning down the universal density of baryons, and to constraining physics beyond the standard model of particle physics. Such data is beginning to be acquired but, at present, the observational situation is in conflict. On the one hand there is evidence in favor of high D [11, 10, 12, 18, 17]: (D/H). In contrast, Tytler, Fan, & Burles [13] and Burles & Tytler [14] find evidence for low D: (D/H). If the former, high-D values are correct, it is surprising that Tytler, Fan, & Burles and Burles & Tytler fail to find such a large abundance in their high redshift ( = 3.57 and 2.50), very low metallicity () absorbers; high and low argue against an order of magnitude destruction of primordial D. If, instead, the low D result is correct, such weak D-absorption might often go unnoticed and the high-D cases might be accidental interlopers. Based on velocity information Rugers and Hogan [12] argue against this possibility which, if more high-D cases are found, will become increasingly unlikely. Presumably, the present confused situation will be clarified by the acquisition of more data. Here, we have considered separately the consequences for cosmology and particle physics of the high-D and low-D data.
For the high-D case, SBBN () is consistent with the inferred primordial abundances of D, 4He, and 7Li provided that the baryon density is small (see Table I and Figs. 1, 3, 4, 5, 7, and 8). However, for consistency with the solar system and/or present interstellar D abundances, such a large primordial D abundance requires very efficient D destruction. The low baryon density which corresponds to high-D still leaves room for dark baryons and reinforces the case for non-baryonic dark matter (see Fig. 9). However, when combined with the x-ray cluster data, low and high suggest a very low density universe ( for km/s/Mpc; see Fig. 10). The conflict between the upper bound on and the evidence for a lower bound argue against high-D and low (see Figs. 11 and 12) . Such a low value for is also in conflict with the constraint from the shape parameter (see Figs. 11 and 12). These problems persist even allowing for a non-vanishing cosmological constant (which could resolve the age-expansion rate problem). See Figs. 11 and 12.
In contrast, the low-D case leads to severe tension between the SBBN prediction and the inferred primordial abundance of 4He (see Figs. 1, 4, and 5). This stress on SBBN can be relieved if the primordial helium mass fraction, derived from observations of low metallicity HII regions, is in error — due, perhaps, to unaccounted systematic effects — by an amount (see Fig. 8).
Alternatively, this conflict could be evidence of “new physics” [53] (; see Figs. 7 and 8). The best fit between predictions and observations with low D is for . One way to alter standard BBN is to change the physics of the neutrino sector. For example, many models predict the existence of sterile neutrinos, which interact only by mixing with the ordinary neutrinos. Such sterile neutrinos would not contribute significantly to the number of effective neutrinos () inferred from the Z line-shape [54], but could be produced cosmologically for a wide range of masses and mixings [55]. However, they only increase , exacerbating the discrepancy.
Another possibility arises if has a mass in the range (the upper limit is the recent result from ALEPH [56]). In this case BBN production of 4He can be either increased or decreased (relative to the standard case), depending on whether is stable or unstable on nucleosynthesis time scales ( sec). An effectively stable ( sec) in this mass range always increases relative to the standard case [57] (but, see [58]) and would thus make for a worse fit with the data. However, if has a lifetime sec and decays into (where is a ‘majoron-like’ scalar), ‡‡‡Decays with in the final state can directly alter the neutron-to-proton ratio and thus affect somewhat differently [59]. it is possible to decrease the predicted relative to the standard case (see figures 3 and 7 of Ref. [60]). Such an unstable contributes less than a massless neutrino species at the epoch of BBN, thereby reducing the yield of 4He. For example, a with mass MeV which decays with a lifetime of sec reduces by (and by , respectively), thus helping to resolve the apparent conflict between theory and observation. It is also possible to alter the yield of BBN 4He by allowing to be degenerate [61]. If there are more than , is reduced relative to the standard (no degeneracy) case as the extra ’s drive the neutron-to-proton ratio to smaller values at freeze-out. A reduction of of can be accomplished with a chemical potential of , corresponding to a net lepton-to-photon ratio of 0.005. This is to be compared to the net baryon asymmetry which is smaller by 7 orders of magnitude. Nevertheless, scenarios for a large lepton asymmetry are possible [62]. Lastly, one can relax the assumption that baryons are homogeneously distributed. However, inhomogeneous BBN typically results in higher , and therefore does not naturally resolve the 4He-D conflict [63].
Provided that the high-, low-D challenge can be resolved (by and/or ), low-D is consistent with the Pop II 7Li abundance if there has been a modest amount of lithium destruction/dilution in the oldest stars (see Figs. 1 and 5). The higher baryon density for low-D strengthens the case for dark baryons (see Fig. 9), although that for non-baryonic dark matter, while still very strong, is somewhat weakened. When folded with the hot gas bound on the x-ray cluster baryon fraction, a “cluster baryon crisis” persists, arguing for (see Figs. 10–12).
Acknowledgements.
It is pleasure to thank R. Carswell, A. Evrard, J. Felten, C. Hogan, M. Persic, P. Salucci, R. Schaefer, R. Scherrer, D. Thomas, T. Walker, and D. Weinberg for useful discussions. This work is supported by the Department of Energy Contract No. DE-AC02-76-ER01545 at Ohio State University and DE-AC02-76-ERO-3071 at the University of Pennsylvania.REFERENCES
- [1] R. Epstein, J. Lattimer, and D. N. Schramm, Nature 263, 198 (1976).
- [2] J. Geiss, in Origin and Evolution of the Elements, edited by N. Prantzos, E. Vangioni-Flam, and M. Casse (Cambridge University Press, Cambridge, 1993), p. 89.
- [3] G. Steigman and M. Tosi, Astrophys. J. 453, 173 (1995).
- [4] P. R. McCullough, Astrophys. J. 390, 213 (1992).
- [5] J. L. Linsky et al., Astrophys. J. 402, 694 (1993).
- [6] E. Vangioni-Flam and J. Audouze, Astron. Astrophys. 193, 81 (1988).
- [7] M. Tosi, in From Stars to Galaxies, edited by C. Leitherer, U. Fritze von Alvensleben, and J. Huchra (ASP Conference series, 1996).
- [8] G. Steigman and M. Tosi, Astrophys. J. 401, 150 (1992).
- [9] N. Hata, R. J. Scherrer, G. Steigman, D. Thomas, and T. P. Walker, Astrophys. J. 458, 637 (1996).
- [10] R. F. Carswell, R. J. Weymann, A. J. Cooke, and J. K. Webb, Mon. Not. R. Astron. Soc. 268, L1 (1994).
- [11] A. Songaila, L. L. Cowie, C. Hogan, and M. Rugers, Nature 368 599 (1994).
- [12] M. Rugers and C. J. Hogan, Astrophys. J. Lett. 459, 1 (1996).
- [13] D. Tytler, X. M. Fan, and S. Burles, Los Alamos e-Print archive, astro-ph/9603069 (submitted to Nature).
- [14] S. Burles and D. Tytler, Los Alamos e-Print archive, astro-ph/9603070 (submitted to Science).
- [15] M. G. Edmunds, Mon. Not. R. Astron. Soc. 270, L37 (1994).
- [16] G. Steigman, Mon. Not. R. Astron. Soc. 269, L53 (1994).
- [17] R. F. Carswell et al., Mon. Not. R. Astron. Soc. 278, 518 (1996).
- [18] E. J. Wampler et al., Los Alamos e-Print archive, astro-ph/9512084.
- [19] N. Hata, R. J. Scherrer, G. Steigman, D. Thomas, T. P. Walker, S. Bludman, and P. Langacker, Phys. Rev. Lett. 75, 3977 (1995).
- [20] D. Thomas, N. Hata, R. J. Scherrer, G. Steigman, and T. P. Walker, work in progress.
- [21] See, for example, A. Dar, Astrophys. J. 449, 550 (1995).
- [22] F. Spite and M. Spite, Astronomy and Astrophysics 115, 357 (1982).
- [23] J. A. Thorburn, Astrophys. J. 421, 318 (1994).
- [24] S. Vauclair and C. Charbonnel, Astron. Astrophys. 295, 715 (1995).
- [25] P. Molaro, F. Primas, and P. Bonifacio, Astron. Astrophys. 295, 47 (1995).
- [26] J. Yang, M. S. Turner, G. Steigman, D. N. Schramm, and K. Olive, Astrophys. J. 281, 493 (1984).
- [27] T. P. Walker, G. Steigman, D. N. Schramm, K. A. Olive, and H. Kang, Astrophys. J. 376, 51 (1991).
- [28] D. S. P. Dearborn, D. N. Schramm, and G. Steigman, Astrophys. J. 302, 35 (1986).
- [29] D. Dearborn, G. Steigman, and M. Tosi, Astrophys. J. in press (vol 465, July 10, 1996).
- [30] F. Palla, D. Galli, and J. Silk, Astrophys. J. 451, 44 (1995).
- [31] B. E. J. Pagel, E. A. Simpson, R. J. Terlevich, and M. G. Edmunds, Mon. Not. R. Astron. Soc. 225, 325 (1992).
- [32] E. D. Skillman and R. C. Kennicutt, Astrophys. J. 411, 655 (1993).
- [33] K. A. Olive and G. Steigman, Astrophys. J. Suppl. 97, 49 (1995).
- [34] D. Sasselov and D. Goldwirth, Astrophys. J. Lett. 444, L5 (1995).
- [35] C. Copi, D. N. Schramm, and M. S. Turner, Science 267, 192 (1995).
- [36] M. Persic and P. Salucci, submitted to Mon. Not. R. Soc. (1995).
- [37] J. P. Ostriker and P. J. Steinhardt, Los Alamos e-Print Archive, astro-ph/9505066.
- [38] E. J. Shaya, P. J. E. Peebles, and R. B. Tully, Astrophys. J. 454, 15 (1995).
- [39] R. G. Carlberg, H. K. C. Yee, and E. Ellingson, Los Alamos e-Print Archive, astro-ph/9512087.
- [40] A. Dekel and M. J. Rees, Astrophys. J. Lett. 422, 1 (1994).
- [41] S. D. M. White and C. S. Frenk, Astrophys. J. 379, 52 (1991).
- [42] D. A. White and A. Fabian, Mon. Not. R. Astron. Soc. 273, 72 (1995).
- [43] A. E. Evrard, C. A. Metzler, and J. F. Navarro, Los Alamos e-Print Archive, astro-ph/9510058 (submitted to Astrophys. J.)
- [44] A. Gould, Astrophys. J. 455, 44 (1995).
- [45] G. Steigman and J. E. Felten, Space Science Reviews 74, 245 (1995).
- [46] A. E. Evrard, private communication (1995).
- [47] J. A. Peacock and S. J. Dodds, Mon. No. R. Astr. Soc. 267, 1020 (1994).
- [48] A. R. Liddle, D. H. Lyth, R. K. Schaefer, Q. Shafi, and P. T. P. Viana, Los Alamos e-Print Archive, astro-ph/9511057.
- [49] A. Klypin, R. Nolthenius, and J. Primack, Los Alamos e-Print Archive, astro-ph/9502062.
- [50] C. P. Ma and E. Bertschinger, Astrophys. J. Lett. 434, 5 (1994).
- [51] R. W. Strickland and D. N. Schramm, Los Alamos e-Print Archive, astro-ph/9511111.
- [52] L. Kofman, A. Klypin, D. Pogosian, and J. P. Henry, Los Alamos e-Print Archive, astro-ph/9509145.
- [53] See, for example, P. Langacker, in Testing the Standard Model (Proceedings of the 1990 Theoretical Advanced Study Institute in Elementary Particle Physics), edited by M. Cvetič and P. Langacker (World Scientific, Singapore, 1991) p. 863.
- [54] A. Olshevsky, invited talk at the 1995 EPS meeting.
- [55] P. Langacker, University of Pennsylvania Report No. 0401T, 1989 (unpublished). R. Barbieri and A. Dolgov, Nucl. Phys. B 349, 743 (1991); K. Enqvist, K. Kainulainen, and J. Maalampi, Phys. Lett. B 249, 531 (1990); M. J. Thomson and B. H. J. McKellar, Phys. Lett. B 259, 113 (1991); V. Barger et al., Phys. Rev. D 43, 1759 (1991); X. Shi, D. Schramm, and B. Fields; Phys. Rev. D 48, 2563 (1993).
- [56] ALEPH collaboration: D. Buskulic et al., Phys. Lett. B 349, 585 (1995).
- [57] E. W. Kolb and R. J. Scherrer, Phys. Rev. D 25, 1481 (1982); E. W. Kolb, M. S. Turner, A. Chakravorty, and D. N. Schramm, Phys. Rev. Lett. 67, 533 (1991); A. Dolgov and I. Rothstein, Phys. Rev. Lett. 71, 476 (1993); M. Kawasaki, P. Kernan, H.-S. Kang, R. J. Scherrer, G. Steigman, and T. P. Walker, Nucl. Phys. B 419, 105 (1994); S. Dodelson, G. Gyuk, and M. S. Turner, Phys. Rev. D 49, 5068 (1994).
- [58] S. Hannestad and J. Madsen, Los Alamos e-Print Archive, hep-ph/9603201.
- [59] G. Gyuk and M. S. Turner, Phys. Rev. D 50, 6130 (1994).
- [60] M. Kawasaki et al. in Ref. [57].
- [61] A. Yahil and G. Beaudet Astrophys. J. 206, 26 (1976); R. J. Scherrer, Mon. No. R. Astr. Soc. 205, 683 (1983); K. A. Olive, D. N. Schramm, D. Thomas, and T. P. Walker, Phys. Lett. B 265, 239 (1991); H.-S. Kang and G. Steigman, Nucl. Phys. B 372, 494 (1992).
- [62] P. Langacker, G. Segre, and S. Soni, Phys. Rev. D 26, 3425 (1982).
- [63] D. Thomas, D. N. Schramm, K. A. Olive, G. J. Mathews, B. S. Meyer, and B. D. Fields, Astrophys. J. 430, 291 (1994); N. Terasawa, private communication (1994).
| High DQSO | Low DQSO & DISM | D⊙, 3He⊙ & BBN | |
| Obs. D/H (10-5) | , | ||
| (1.3 – 2.7) | (5.1 – 8.2) | (3.5 – 7.9) | |
| (0.005 – 0.010) | (0.019 – 0.030) | (0.013 – 0.029) | |
| () | () | () | |
| (0.231 – 0.239) | (0.246 – 0.252) | (0.243 – 0.251) | |
| 7Li/H (10 | (0.7 – 3.0) | (3.0 – 7.8) | (1.4 – 7.3) |