Kinematic Evidence for Superbubbles in I Zw 18: Constraints on the Star Formation History and Chemical Evolution
Abstract
We have combined measurements of the kinematics, morphology, and oxygen abundance of the ionized gas in I Zw 18, one of the most metal-poor galaxies known, to examine the star formation history and chemical mixing processes. Deep H imagery shows diffuse emission and a partial shell extending well beyond the main two knots of continuum emission. We have explored the kinematics of this ionized gas using longslit, echelle spectroscopy of the H line. We find the unambiguous signature of a supergiant shell southwest of the galaxy and weak evidence for a second bubble northeast of the galaxy. The axial symmetry of these shells and the asymmetry in their H line profiles suggest that they comprise the lobes of a single bipolar bubble expanding at km s-1. Higher velocity gas is found near the small shell immediately west of the northwest HII region. Although an unresolved X-ray source is discovered near the northwest HII region in archival ROSAT PSPC data, we argue that hot interstellar gas associated with the superbubbles does not produce all the X-ray emission. Oxygen emission lines are detected up to kpc from the NW HII region along the bubble’s polar axis, so this diffuse, ionized gas has been polluted with gas processed by stars. Measurements of the O/H abundance ratio in the inner nebula show surprisingly little variation considering the apparent youth of the galaxy.
We describe the dynamical evolution of the superbubble using a simple wind-blown bubble model. To test the hypothesis that the dynamical age of the bubble measures the duration of the starburst in I Zw 18, we compute the photometric properties of a starburst with the same age as the superbubble. We find that star formation commencing Myr ago and continuing at a rate of 0.017 – 0.021 (of 1 – 100 stars) per year can both power the gas dynamics and produce a fair match to the integrated optical properties of I Zw 18. The total mechanical energy returned to the interstellar medium by stellar winds and supernovae, 7 – 30 ergs, is insufficient to eject the entire interstellar medium. However, the corresponding mechanical energy injection rate is high enough to drive the superbubble shell out of the HI gas cloud, and “blowout” will allow the hot ISM to escape in a galactic wind. This supports the idea that metal-enriched winds play a prominent role in the chemical evolution of dwarf galaxies.
1 Introduction
The blue compact dwarf galaxy, I Zw 18, was first described as “a double system of compact galaxies” having an emission line spectrum with a fairly featureless continuum (Zwicky 1966). Its extremely blue colors and exceptionally low oxygen abundance indicate the present star formation rate exceeds the past average rate (Searle & Sargent 1972). Kunth & Sargent (1986) have argued that the metal abundance in I Zw 18 – O/H 0.02 (O/H)⊙ in the HII regions (Skillman & Kennicutt 1993 and references therein) – is close to the minimum observable in any self-enriched, HII region. The prospect that I Zw 18 may be forming stars for the first time out of primordial clouds of gas has drawn much attention (e.g. Sargent & Searle 1970; Lequeux & Viallefond 1980; Kunth, Lequeux, & Sargent 1994), and the galaxy has played a prominent role in determining the primordial He abundance (Lequeux et al. 1979; Davidson & Kinman 1985; Pagel et al. 1992).
The question of whether I Zw 18 formed stars prior to the current burst is not settled, but several recent results support the young galaxy hypothesis. The colors extracted from UBV imaging studies of blue compact dwarfs typically uncover an older stellar population underlying the starburst. However, comparable efforts for I Zw 18 show no evidence for an old population (Sudarsky & Salzer 1995). Broadband HST images do resolve several spatially distinct populations within the main body of I Zw 18, but again show no evidence for an older population (Hunter & Thronson 1995). The three continuum patches strung out to the NW of the main body have progressively redder colors and are probably associated with the galaxy (Davidson, Kinman, & Friedman 1989; Dufour & Hester 1990). Dufour & Hester have speculated that the elements synthesized in these earlier, isolated star formation events escaped without significant mixing into the HI clouds. The C, N, and O abundances of the main HII regions are well described by a single burst that started about 10 Myr ago and restrict models with previous star formation to a short burst at least years ago (Kunth, Matteucci, & Marconi 1995). Measurements of the metallicity of the HI gas (Kunth, Matteucci, & Marconi 1995; Pettini & Lipman 1995) should distinguish between these chemical evolution models, whose success relies on some primary production of N and a differential galactic wind (Marconi, Matteucci, & Tosi 1994).
Although the structure of the H and 21-cm emission has been described previously (Dufour & Hester 1990; Viallefonde et al. 1987), several important questions about the gas dynamics remain. For example, Skillman & Kennicutt (1993) have questioned the assumption that the HI velocity field reflects a rotating disk. The implied total mass is 13 times larger than the HI mass (Viallefond et al. 1987) and causes I Zw 18 to deviate significantly from the mass-metallicity relation observed for dwarf irregular galaxies (Skillman et al. 1988). Examining the velocity field on finer scales will determine the contribution of non-virial motions to the large-scale gas motions. Another outstanding question is the role of a galactic wind. Meurer (1991) has suggested that the H emission extending roughly perpendicular to the main HI cloud is a minor axis outflow. It is important to substantiate this claim with supporting kinematic evidence.
We selected I Zw 18 for a case study within a broader program investigating the interplay between star formation and the ISM (Martin 1996). The feedback could have a particularly strong influence on the evolution of I Zw 18 since the low metallicity reduces radiative losses and the escape velocity is relatively low. This paper presents new imagery and longslit echelle spectra of the H emission and previously unreported X-ray emission (§ 2). The objectives are to describe the kinematics of the ionized gas (§ 2), derive a consistent dynamical interpretation (§ 3), determine the implications for the star formation history of I Zw 18 (§ 3), and estimate what effect mass loss is likely to have on the galaxy’s evolution (§ 4). Since the results suggest superbubbles mix the interstellar gas on kiloparsec scales, we examine new optical spectra in § 4.2 and place limits on the O/H abundance variations in the extended ionized gas. The results are summarized in § 5.
2 Observations and Analysis
2.1 Optical Imaging
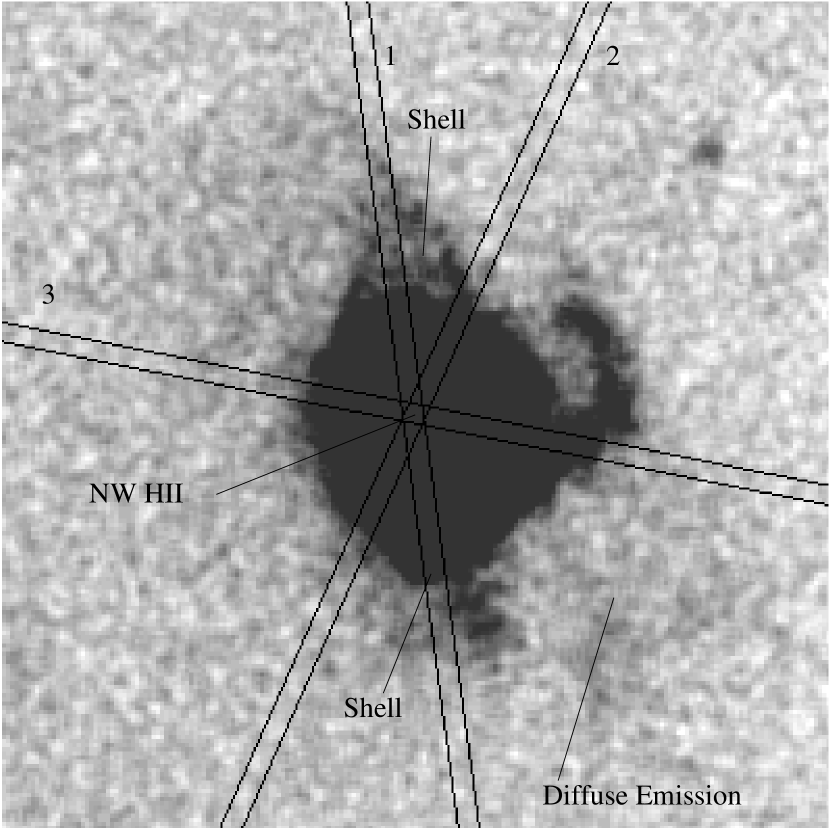
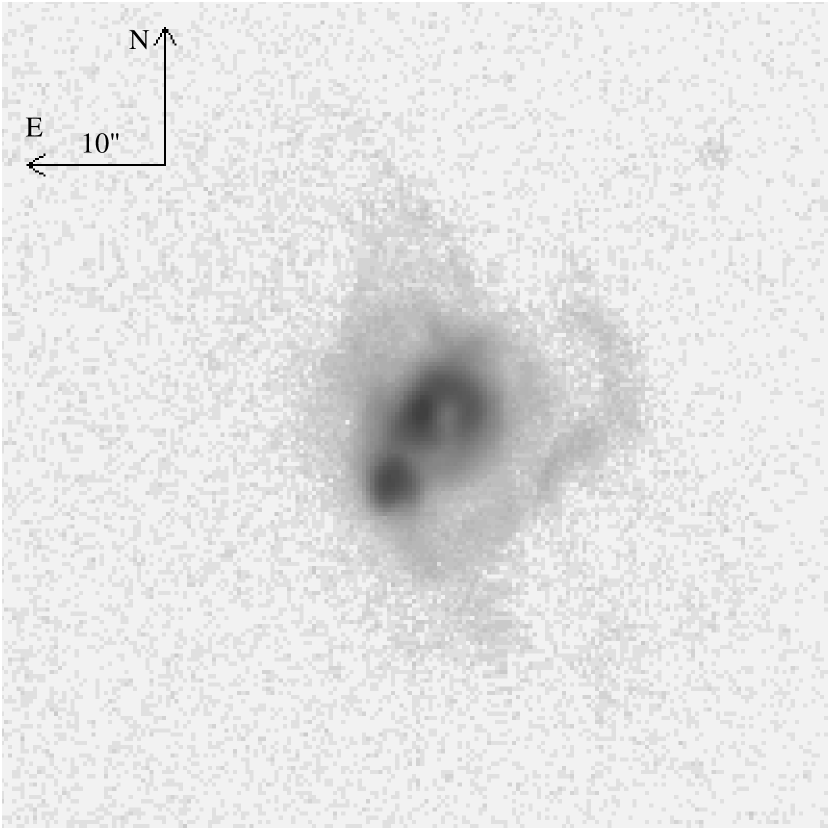
Narrowband H and red continuum images of I Zw 18 were obtained 1993 May 17 with the Steward Observatory 2.3 m telescope equipped with a Loral thinned CCD. The raw CCD frames were processed with standard techniques as described in Martin & Kennicutt (1995). Figures 1ab show the continuum subtracted H image. The NW HII region is centered about 1E of the brightest continuum emission. A small, partial shell of diameter 36 (175 pc) 111A distance of 10 Mpc to I Zw 18 is adopted throughout this paper (Viallefond, Lequeux, & Comte 1987). protrudes from the NW side of the NW HII region and wraps around the continuum emission (Davidson et al. 1989; Hunter & Thronson 1995). The SE HII region is coincident with the second brightest maximum in the continuum emission. The cores of both HII regions are offset NE of the two maxima in the HI map (Dufour & Hester 1990). The deeper reproduction in Figure 1a reveals additional features absent in the off-band image. For example, the ridge to the SW is thought to represent a radiation-bounded ionization front being driven into the main HI cloud (Dufour & Hester 1990). A prominent shell stretches 15(740 pc) N-NE from the NW HII region, and bright H emission extends symmetrically S-SW of the NW HII region. Faint, diffuse emission (emission measure pc cm-6 for K) is detected along a position angle of 42∘ in a band 21(1 kpc) wide extending 25(1.2 kpc) and 31(1.5 kpc) to the NE and SW, respectively. The 21-cm emission is less extended in this direction; the principal 30by 60HI cloud is elongated along the optical major axis, PA 328∘ (Viallefond et al. 1987).
The H image was flux calibrated using the absolute flux reported by Dufour & Hester (1990) through a 1 1square aperture centered on the NW HII region. Absolute fluxes were corrected for atmospheric extinction and foreground Galactic reddening ( = 0.21 mag); the contribution of [NII] lines is negligible. The integrated H flux within 30of the NW HII region is ergs s-1 cm-2, where the 20% uncertainty is dominated by the flux calibration. Assuming the nebula is radiation-bounded, Case B conditions, and an electron temperature K (e.g. Skillman & Kennicutt 1993), the flux of hydrogen ionizing photons is s-1, where is the distance to I Zw 18 in units of 10 Mpc. This ionizing luminosity is similar to that of 30 Doradus in the Large Magellanic Cloud (Kennicutt 1984). A spherical, homogeneous nebula of this size would have an rms electron density of cm-3. The ratio of the [SII] line fluxes is near the low density limit, so the actual electron density in the emission line filaments is cm-3. The volume filling factor of the ionized filaments must be at least , where . The estimated mass of ionized gas is then . To estimate the radial density profile, the H surface brightness was azimuthally averaged in annuli around the NW HII region. Assuming the nebula is spherical, inversion of the H surface brightness integral implies within 7(340 pc) of the NW HII region, and between 7and 15(730 pc).
2.2 High-Resolution Spectroscopy
Longslit spectra of the H line were obtained 1994 April 29 and 30 using the echelle spectrograph on the KPNO 4 m telescope. Three position angles were chosen based on the morphology of the H emission (see Figure 1). An astrometric offset was used to center the slit on the NW HII region, and three 20 minute integrations were obtained at each position angle. The 15 slit produced a spectral resolution of km s-1 FWHM. The instrumental setup, calibration techniques, and data reduction are further described by Martin and Kennicutt (1995). The seeing varied from 1-2FWHM, so spectra were extracted every 18 along the slit to maximize the spatial information. This binning provided sufficient S/N to measure the line center to an accuracy of 0.1 Å and fit two-component Gaussian line profiles down to the faintest intensities visible in Figure 1a.
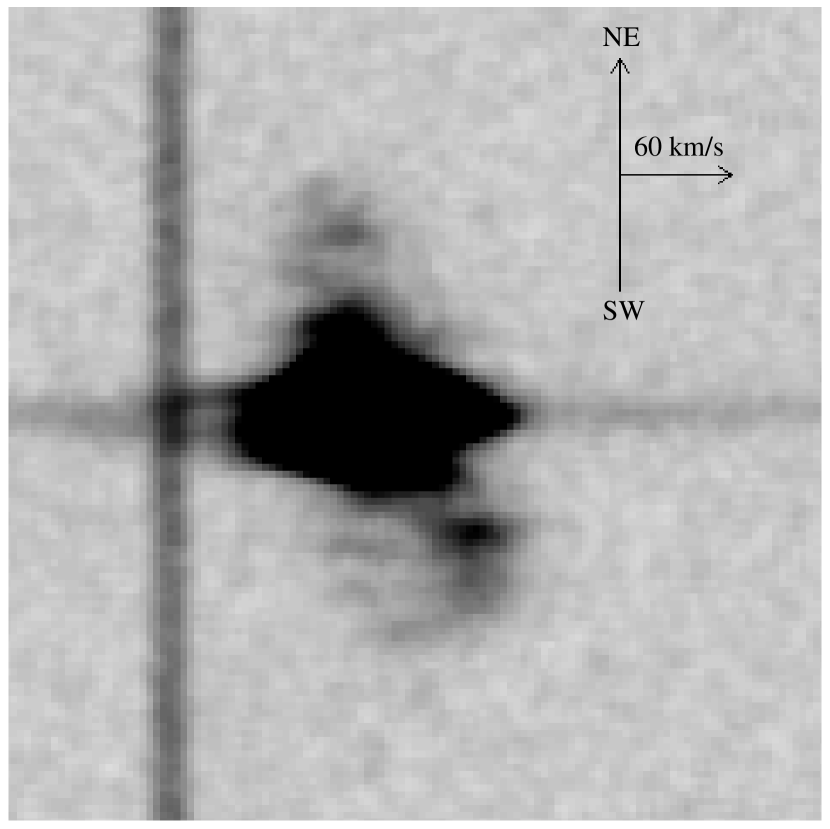
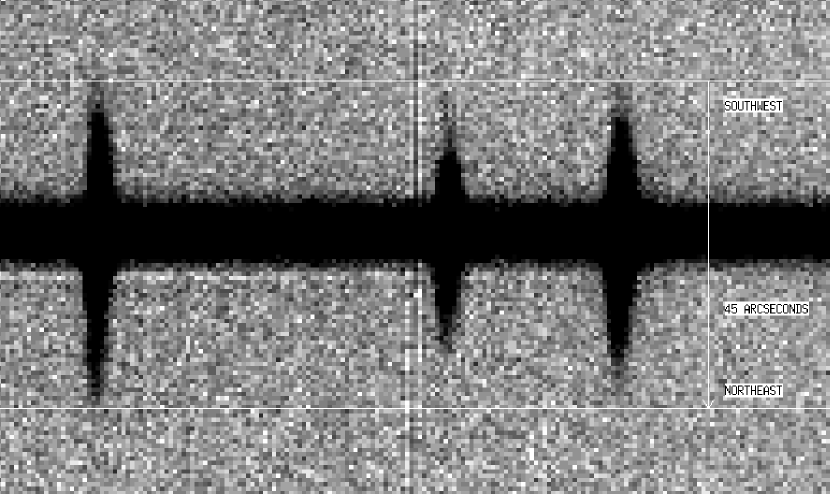
The echellograms reveal the kinematic signatures of two expanding supergiant shells. Figure 2 shows the echellogram along slit 1, PA = 7.7∘ . Southwest of the NW HII region (continuum source), the line profile splits into two components forming a Doppler ellipse. Similar kinematic signatures have been observed in other starbursting, gas-rich dwarfs and almost certainly indicate the presence of an expanding shell of gas (Marlowe et al. 1995; Martin 1996). This Doppler ellipse extends 19(930 pc) to the SW, and the maximum separation of the line-of-sight velocities reaches 59 km s-1 . Fits to the line profile northeast of the HII region are improved with a faint, secondary component redward of the main component, thereby providing some evidence for a second Doppler ellipse coincident with the NE shell in the H image.
The asymmetry in the line profiles of these shells suggest the superbubbles form the two lobes of a bipolar bubble with polar axis inclined relative to our line-of-sight. In the NE Doppler ellipse the intensity of the blueshifted component is several times higher than that of the redshifted component, but their relative intensities are reversed to the SW. This effect is illustrated in Figure 3, where the symbol “X” denotes the position of the weaker component in position-velocity space. The lack of line-splitting along the other slit positions lends credence to the bipolar bubble interpretation.

We also detect gas with velocities up to km s-1 from the systemic velocity and tentatively associate it with the small shell. These high-velocity wings are stronger on the blue side of the line profile and coincident with the small shell along all three slit positions. However, since this high-velocity component contributes only 5% of the line flux, the only other region with high enough signal-to-noise to reveal these wings is the SE HII region; and examination of the data along slit 2 shows a similar wing contributes 3% of the H flux there. We hesitate to identify the high-velocity gas with an expanding shell because no Doppler ellipse is seen where slit 3 crosses the center of the small shell. A champagne flow (e.g. Yorke, Tenorio-Tagle, & Bodenheimer 1984) from the young HII regions and stellar winds might provide a better description of the gas kinematics.
The detection of large, expanding shells of gas reopens the question of whether galactic rotation produces all the velocity shear across the gas distribution. In Figure 3 the solid circles trace the velocity of the dominant component of the H emission along each of the three slit positions. Along slit 1, the velocity is fairly constant to the NE but increases by km s-1 to the SW. At least part of this velocity shear is likely an artifact of the expansion of the superbubble. Along slit 2, PA = 156.1∘ , the velocity gradient is steeper on the SE side of the nebula. Since this slit position is nearly parallel to the HI major axis, it might be expected to reveal the galactic rotation curve. However, the change in slope near the NW HII region and the similarity to the velocity gradient along slit 1 leave some ambiguity between the effects of galactic rotation and the expansion of the superbubble. The velocity is nearly constant along slit 3, PA = 78.8∘ , which is 24∘ from the HI minor axis.
Along all three slit positions, the large-scale variations in the central velocity of the H line appear to be shared by the HI velocity field (Viallefond et al. 1987). Given the better spatial coverage of the HI map and the strong suggestion of galactic rotation in it, we provisionally attribute the velocity gradient across echelle slit 2 to galactic rotation. Higher resolution HI observations are needed to determine whether the kinematic signatures of the bubbles are present in the HI and what affect they might have on the global HI velocity field. A significant perturbation on the local velocity field is already evident in the NE finger of HI, which is coincident with our large H shell. The iso-velocity contours there depart from the overall pattern, and the HI radial velocity decreases by about 20 km s-1 across the H shell.
2.3 X-Ray Detection
I Zw 18 was observed with the Position Sensitive Proportional Counter (PSPC) on the Röntgensatellit (ROSAT) for 16,964 sec during 1992 April 30 - 1992 May 11. We requested the data, originally obtained by Dr. C. Motch, from the ROSAT public archive. An unresolved X-ray source is located 26 W and 66 S of the peak red continuum emission. Pointing errors of this magnitude are typical for ROSAT observations, and we identify the X-ray source with I Zw 18. It is not clear whether a second, fainter source located 82to the NNW is associated with I Zw 18. After background subtraction, the remaining net counts are insufficient to constrain a spectral fit. The X-ray colors, however, suggest a fraction of the X-ray flux is produced by hot, coronal gas in the ISM. The emission is slightly harder than the soft emission from the dwarf NGC 5253 (Martin & Kennicutt 1995), but considerably softer than the hard sources, thought to be massive X-ray binaries, near the center of NGC 2403 (Martin 1996). To estimate the X-ray luminosity, , in the ROSAT band (0.1 – 2.2 keV), a series of power law, bremsstrahlung, and Raymond-Smith spectral models were normalized to the total counts. For a Galactic absorbing column cm-2 (Heiles 1975; Stark et al. 1992), all these models produce ergs s-1 to within a factor of two. For example, a Raymond-Smith model for a K plasma of 10% solar abundance with a foreground absorbing column of implies ergs s-1.
Until ROSAT HRI observations are obtained, the extent of the source will remain unknown. At 1 keV the FWHM of the ROSAT/PSPC point spread function is 24, about half the angle subtended by the H emission along slit 1. However, the radius encircling 95% of the photons is substantially larger – about 45(Hasinger et al. 1992) – so a diffuse halo should not be ruled out. If the X-ray source is found to reside deep within the galaxy, the intrinsic absorption column could be as high as cm-2 (Kunth et al. 1994); and the estimated X-ray luminosity would be increased by a factor , where the upper limit is derived for a column with solar abundances.
3 Modeling the Gas Dynamics
In this section, a simple model for a wind-blown bubble is used with the kinematic and morphological properties described in § 2 to constrain the dynamical age of the superbubble and the mechanical energy supplied to it. The luminous properties of a starburst which could drive the expansion are computed and compared to the integrated properties of the galaxy.
3.1 The Superbubble Model
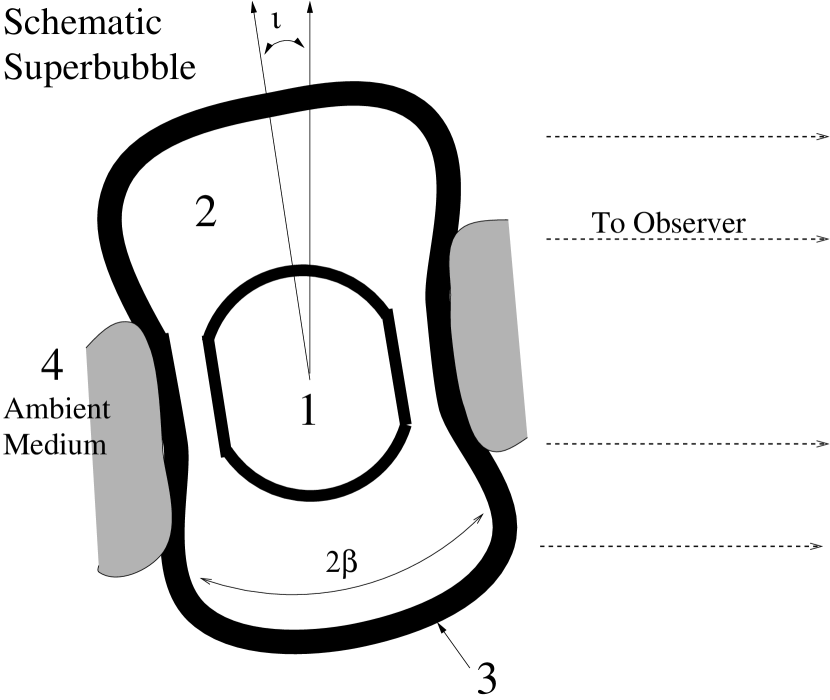
The dynamical arguments presented in this paper are based on the standard model for a stellar wind bubble with a radiative shell (e.g. Castor, J., McCray, R., & Weaver, R. 1975; Weaver, McCray, & Castor 1977). The conceptual framework is illustrated schematically in Figure 4. Stellar winds and supernova explosions from hundreds of massive stars fuel a supergiant bubble over timescales yr (zone 1). The kinetic energy in the ensemble’s supersonic wind is thermalized by a stand-off shock, and the high pressure (zone 2) downstream drives a strong shock into the ambient ISM (zone 4). The swept-up gas condenses into a shell (zone 3) as a result of radiative cooling.
The solution for the shell’s evolution as formulated by Ostriker & McKee (1988) provides a convenient power-law parameterization of a density gradient in the ambient medium,
| (1) |
and a time-dependent energy injection rate,
| (2) |
In this notation, is the average density of the ambient ISM within the fiducial radius , and supernovae and stellar winds supply a mechanical power at time t(1). The parameters t(1) and are not independent and must satisfy the relation , where .
The radius of the spherical swept-up shell is
| (3) |
where and are numerical constants on the order of unity as defined by Ostriker & McKee (1988) and evaluated for a ratio of specific heats . The shell velocity is
| (4) |
Solving equations 3 and 4 gives the dynamical age of the bubble,
| (5) |
and the ratio of the mechanical power to ambient density,
| (6) |
The total mechanical energy injected into a bubble of age is
| (7) |
3.2 Application to I Zw 18
The Doppler ellipse discovered SW of the HII regions is not the signature of a spherical shell expanding radially. The measured radius and velocity would require a burst of star formation in the center of the bubble about 6 Myr ago which supplied ergs of kinetic energy. The continuous emission from the fading population would easily be detected in our red continuum image.
We favor interpreting the data in the context of an expanding bipolar bubble. The bright H emission coincident with the SW shell shares a common symmetry axis with the NE loop, which may form the second lobe. This polar axis intersects the brightest region of the galaxy – the obvious place for a power source. The reversal of the shape of the H line profile between the two bubbles also supports this interpretation since it is easily explained by tilting the bubble with respect to our line-of-sight. Overall, the kinematic signature is reminiscient of that along the minor axis of M82, which exhibits the quintessential superwind (Heckman, Armus, & Miley 1990; Martin 1996). However, while the outflow in M82 is clearly confined at its waist by the galactic disk, the collimating mechanism in I Zw 18 is not apparent. The polar axis presumably depicts the projection of the steepest pressure gradient, which we might expect to be perpendicular to the HI major axis. The proposed polar axis is 43∘ from the PA of the HI major axis in the map of Viallefond et al. (1987). We note that the major axis of the very diffuse, extended H emission is perpendicular to the HI major axis.
To estimate the radius and expansion speed of the SW lobe from the data, we introduce two simplistic models for the shape and velocity field of the bipolar shell. A cone of half-opening angle and inclination , as illustrated in Figure 4, represents the thick shell behind the outer shock. We assume the density decreases as , where is the distance from the starburst, which is consistent with the decline in surface brightness in our H image. The inclination is not large because the shifts of the red and blue components of the SW Doppler ellipse with respect to the central velocity are similar. We estimate ∘ from the width of the NE loop. An inclination of ∘ then produces an intensity contrast of 2 – 3, similar to the data. The radial extent of the Doppler ellipse is essentially the length of the polar axis. In our “isobaric bubble” model, the shell velocity is normal to the conical surface, geometrical corrections are small, and we estimate an expansion speed km s-1 . (The variations in the magnitude of the velocity around the shell is thought to be considerably smaller.) In our “wind” model, the flow is radial, mimicking the boundary layer between a freely expanding supersonic wind and the halo, and the deprojected shell speed is km s-1 . Hence, the shell velocity is uncertain by a factor of 2. The uncertainty in the radius is dominated by the difference, about 20%, between the two lobes.
Despite the complex geometry, we apply the dynamical model of § 3 along the polar axis. We expect to estimate the dynamical age to within a factor of two and to better than an order of magnitude based, primarily, on the uncertainties in radius, velocity, and density gradient () rather than the choice of dynamical model. The magnitude of the errors are believed to be similar. For example, the height of the polar lobe is larger than the radius of a spherical bubble supplied with the same energy, but a radial density gradient could also easily increase by a factor of two relative to the constant density case. Our best estimate of the dynamical age from the isobaric bubble and wind geometries are 27 Myr and 15 Myr, respectively. The bubble requires ergs of kinetic energy while the wind geometry increases the estimate to ergs.
The mean density of the ambient ISM swept up by the shell is expected to be low. If all the HI gas were compressed into a uniform sphere the size of the bipolar bubble ( kpc), the average density would be cm-3, where the number density and amu is the average mass per H atom for a composition H:He = 10:1 by number. Adding the density of ionized H in the nebula (§ 2.1) yields an upper limit cm-3 for the models. Spreading the HI out uniformly over the HI clouds suggests a lower limit of cm-3 . To explore the effect of a density gradient on galactic scales, we calculated models with and 2 and pc. By an analogous argument, the acceptable ranges for the ambient density interior to are cm-3 and cm-3, for and 2 respectively. These central densities are similar to estimates of the HI density in the center of the main cloud ( cm-3) and the rms electron density in the NW HII region.
3.3 The Star Formation History
Either a recent starburst or an IMF heavily biased towards massive stars can produce colors as blue as observed for I Zw 18. Searle & Sargent (1972) ruled out the latter interpretation for I Zw 18 with a measurement of the gas phase O/H abundance ratio. Recently the stellar content of the starburst has been studied using very high spatial resolution. Stars down to O9.5 on the main sequence are resolved in broad-band, HST images (Hunter & Thronson 1995), and Hunter & Thronson identify three spatially distinct populations. First, the stars inside the small shell have ages from 1– 5 Myr. The second population in the southern component has no red supergiants (RSGs) and is probably younger. The third population is spread throughout the galaxy, comprises roughly half of the resolved stars, and is likely to be older than the shell population since it contains more red stars. In addition to this “general galaxy” population, an older, unresolved population with the colors of B or early A stars follows the main body of the galaxy and has an age Myr.
Our detection of high velocity gas near the small shell confirms the observations of Davidson et al. (1989) and supports the conclusion of Hunter & Thronson (1995) that the shell population powers the small shell. As discussed in § 2.2, our data do not unambiguously determine the expansion velocity of the shell. So, it remains unclear whether a few a massive stars that formed early created the shell, or whether a younger bubble is driven by many stars.
The supergiant bubble is clearly older than the shell cluster. Could its dynamical age indicate the duration of the starburst in I Zw 18 ? To check the consistency of this hypothesis, we use the evolutionary synthesis models of Leitherer & Heckman (1995) to describe the photometric properties of a stellar population which could power the bubble. We adopt their lowest metallicity models, , and consider only an IMF of slope , , and .
An instantaneous burst model is not a good description of the star formation history of I Zw 18. A 15 Myr old population that produced hydrogen ionzing photons at the observed rate would generate 300 times more blue luminosity than observed. A continuous star formation rate over the Myr lifetime of the bubble seems reasonable (cf. Meurer et al. 1995) and is consistent with the detection of stars only a few million years old (Hunter & Thronson 1995). Up to an age Myr, the mechanical power, , generated by this burst will grow with time as shown in Figure 56 (lower right) of Leitherer & Heckman (1995), and we incorporate this evolution in our dynamical model by setting and Myr. The steep increase in the wind power keeps the shell moving at a constant velocity, which would also be obtained from a density gradient.
The continuous star formation model produces a stellar population whose photometric properties resemble I Zw 18. As shown in Table 2, this result is not very sensitive to our choice of geometry as represented by the “isobaric bubble” and “wind” models. At dynamical ages of 15 Myr and 27 Myr, star formation rates of 0.021 yr-1 (of 1 to 100 stars) and 0.017 yr-1 , respectively, are required to generate the blue luminosity of I Zw 18. These model populations produce only half of the ionizing luminosity measured and are a bit redder than I Zw 18. This discrepancy is not bothersome as roughly 20% of the H flux comes from the compact source on the eastern edge of the small shell. We could speculate that this star formation is an isolated, triggered event or that the global star formation rate is increasing. This population might be too young and hot to contribute substantially to the blue luminosity.
The continuous burst models easily produce enough supernovae and stellar winds to drive the superbubble. After 15 Myr and 27 Myr, the kinetic energy imparted to stellar ejecta is ergs and ergs, respectively. Since our echelle data constrain the ratio rather than alone, we can choose the ambient density, , to make our dynamical model consistent with the starburst model of the same age. The inferred densities, 0.03 cm-3 and 0.36 cm-3, are within the range estimated from the HI data in § 3.2.
3.4 Results
The aim of our modeling exercise was to describe the range of star formation histories that could easily explain the gas kinematics in I Zw 18. Uncertainties about the geometry of the superbubble and the distribution of the ambient gas limit the accuracy of our analysis. We stepped through the analysis for two models representing the likely range of shell velocities. We found that the star formation necessary to power the superbubble also produces most of the starburst’s luminosity. This epoch of star formation probably started 15 – 27 Myr ago. We favor a higher age within this range because our “isobaric bubble” model is probably the closer analogy to the actual shell kinematics and also predicts a volume-averaged ambient density closer to expectations.
The evolutionary tracks for low metallicity, massive stars are controversial (e.g. Renzini et al. 1992) and could introduce errors in the models for the young starbursts. Near an age of 4 Myr, the blue luminosity of the 0.1 instantaneous burst brightens 65% more than the solar metallicity models (Figure 9 of Leitherer & Heckman 1995). Eliminating this jump would increase the ratio of ionizing luminosity to blue luminosity (). Since the error diminishes with age and an increase in would actually improve the agreement with the observations, a small error of this nature will not change our conclusions.
4 Discussion
In this section, we use our results from § 3 to explore the influence of the superbubble on the evolution of I Zw 18. A particularly interesting issue is the amount of global mass loss driven by the burst of star formation. It has been argued on a theoretical basis that a global wind created by the first burst of star formation may eject the interstellar gas from a dwarf galaxy (e.g. Larson 1974; Saito 1979; Dekel & Silk 1986; Vader 1986). The transformation of gas-rich dwarfs to dwarf ellipticals by this mechanism is appealing but is not completely consistent with the systematic structural properties of dwarfs (Ferguson & Binggeli 1995, and references therein). It has also been emphasized that the escaping wind should be enriched with metals recently dispersed in Type II supernovae (Vader 1987; DeYoung & Gallagher 1990). These differential galactic winds have been independently invoked to explain the locus of blue compact and dwarf irregular galaxies in the N/O - O/H and He/H - O/H planes (Marconi, Matteucci, & Tosi 1994). In § 4.1, we discuss the conditions necessary for the bipolar bubble to develop into a galactic wind, the escape of the hot gas from the galaxy’s gravitational grip, and the mass of cooler gas permanently ejected. In § 4.2, we discuss the mass of metals produced by our starburst models and the role of the superbubble in mixing these elements into the interstellar gas. In § 4.3, measurements of O/H abundance variations are presented and discussed.
4.1 A Starburst-Driven Galactic Wind
4.1.1 Development of an Outflow
The power requirement for the superbubble to break free of the ISM is characterized by the minimum mechanical power, , necessary for the bubble to grow as large as the gaseous extent of the galaxy. Following the derivation of Koo & McKee (1992), in which the effective scale height is defined by
| (8) |
the critical rate of kinetic energy injection is
| (9) |
where and are the isothermal sound speed and midplane gas density in the ambient medium. Since is intended to serve as a measure of the pressure in the ISM, we interpret as the effective one-dimensional velocity dispersion of the HI gas. The velocity dispersions measured in galactic disks typically fall in the narrow range from 3 – 10 km s-1 (Kennicutt 1989), consistent with estimates of 8 km s-1 for the Galactic disk (McKee 1990). The HI linewidth provides an upper limit of km s-1 (Kunth et al. 1994). From HI observations (Viallefond et al. 1987; Lequeux & Viallefond 1980), we estimate a scale height pc. In units of km s-1 and pc, the “breakout” threshold is
| (10) |
where is the midplane number density. The HI density in the core of the main cloud provides an upper limit of cm-3. Normalized to the blue luminosity of I Zw 18, our isobaric bubble and wind models in § 3 were supplied with kinetic energy at time-averaged rates of ergs s-1 and ergs s-1 after 27 Myr and 15 Myr, respectively. We conclude that the bipolar bubble will likely break through the HI layer supersonically.
To open a channel for the hot gas inside the bubble to flow out of the galaxy, the shell must accelerate and break up from Rayleigh-Taylor instabilities. Mac Low & McCray (1988) and Mac Low, McCray, & Norman found that the wind luminosity required for this “blowout” to occur is larger than . Their numerical simulations suggest that is a sufficient condition for blowout. Large produced blowout when the shell reached a height ; but, for smaller , they suspect the bubble may grow larger in the z-direction before blowing out. For cm-3, the ratio of the superbubble’s mechanical power to the characteristic luminosity is , and we expect the superbubble to blowout.
4.1.2 Gravitational Potential
The mass of gas that will escape from the galaxy following blowout depends on the depth of the gravitational potential well. We assume the mass distribution is similar to an isothermal sphere and use the circular velocity, , to estimate the depth of the potential well. For a halo that extends to , the escape velocity is given by
| (11) |
Using Bernoulli’s theorem, we find the corresponding escape temperature,
| (12) |
which describes the specific thermal energy required to establish a smooth, supersonic outflow.
If the velocity gradient along the HI major axis of I Zw 18 is produced by a rotating disk, then the deprojected circular velocity is km s-1 . The dynamical mass is then (Viallefond et al. 1987), and halos truncated at 1 kpc and 10 kpc, masses of and respectively, provide representative models. For reference, the escape velocity and escape temperature are tabulated in Table 3 as a function of radius.
4.1.3 Mass Loss
The predicted temperature for the bubble interior, K (from Eqn. 4 of Martin & Kennicutt 1995), is considerably higher than the escape temperatures shown in column 4 of Table 3, so the hot bubble interior (zone 2) should easily escape following blowout. The ensuing question is how much mass resides in this hot phase of interstellar gas. In the canonical superbubble model, the hot interior is composed of shocked stellar ejecta and material conductively evaporated off the swept-up shell. From Eqn. 9 of Shull (1993), we estimate that the evaporated mass is , which is more than the of enriched gas returned to the ISM by the starburst models. Clouds that get run over by the shell and evaporate in the bubble’s hot interior may further mass load the bubble (Martin & Kennicutt 1995).
Unfortunately, the X-ray observation provides only a rough upper limit on the mass of hot gas. If all the X-ray flux comes from hot gas of density , the observed luminosity implies a mass of coronal gas for a plasma with cosmic abundance. (Although the value of is unknown, arguments about the gas pressure in the ISM suggest it is unlikely to exceed 0.05 cm-3.) At a lower metallicity, the emissivity is expected to be lower, so the inferred mass would be even higher. This analysis merely demonstrates that thermal emission from hot gas could make a substantial contribution to the X-ray luminosity.
Although some of the gas in the shell may escape from the galaxy with the hot wind, the starburst will probably not eject the entire ISM of I Zw 18. For example, the escape velocity from the lower mass halo in Table 3 is km s-1 near the shell radius. Since the deprojected shell velocity is probably km s-1 , only fragments of the ruptured shell could coast out of the galaxy. However, the starburst would have to transfer ergs of kinetic energy to the interstellar gas to accelerate all the HI to 100 km s-1 , a typical escape velocity in Table 3. In the spherical superbubble model, only 20% of the injected mechanical energy is converted into the shell’s kinetic energy, so the starburst would have to generate at least ergs of mechanical energy to completely eject the ISM. In § 3.3 we estimated values of over an order of magnitude smaller than this, so the complete ejection of the ISM is not energetically possible.
4.2 Chemical Enrichment of the ISM
Our dynamical interpretation of the gas kinematics has two interesting implications for the chemical enrichment of I Zw 18. First, elements synthesized and ejected by the starburst’s massive stars may have been transported pc across the bubble interior in only 15 – 27 Myr. Second, most of the oxygen produced may not reside in the warm, ionized gas – a puzzle independently pointed out by others (Kunth & Sargent 1986). Using a fit to the oxygen yields calculated for 12 – 100 stars (Prantzos 1994), we derive an oxygen yield for an IMF with lower and upper mass limits of 0.1 and 100 and slope , where is the ratio of the net mass of oxygen produced to the total mass permanently locked up in remnants (e.g. Tinsley 1980). The starburst models in § 3.3 formed of 1 – 100 stars, or about of 0.1 – 100 stars, so of oxygen are returned to the interstellar gas. If all this oxygen was mixed into the warm, ionized gas, the metallicity of the HII regions would be 5 – 6 times higher than measured. The oxygen would have to be mixed throughout the entire mass of HI to produce a homogeneous oxygen abundance as low as 2% . This unlikely scenario contradicts our hypothesis that the current burst is the first major star formation episode and that the size of the bubble is an indication of the mixing scale. We suggest that the extra oxygen may still be in the hot phase of the interstellar gas – zone 2 in Figure 4. Assuming a remnant mass of 1.5 for the stars in the 12 – 100 range, we estimate that 10% of the mass turned into stars has been returned to the ISM. The oxygen mass fraction of this gas is then , where the solar value is (Grevesse & Noels 1993). Since gas evaporated from the cooler phases of the ISM will dilute the hot stellar ejecta (§ 4.1.3), we expect oxygen to comprise of the mass of hot interstellar gas (i.e. ).
4.3 The O/H Abundance Ratio in the Ionized Gas
If the superbubble plays a prominent role in the dispersal of metals over large scales in I Zw 18, significant abundance inhomogeneities might be expected (cf. Kunth et al. 1994). We have examined deep longslit, optical spectra of I Zw 18, obtained for a related project (Martin 1996), to search for an abundance edge to the metal-enriched region and to constrain the chemical homogeneity of the ionized gas.
4.3.1 Optical Spectrophotometry
Longslit optical spectra of I Zw 18 were obtained in 1994 on the MMT using the Blue Channel Spectrograph equipped with a Loral 3k 1k CCD detector. A 500 gpm grating blazed at 5410 Å in 1st order was used with a UV-36 blocking filter and a 1slit. This configuration provides spectral coverage from approximately 3700 Å to 6800 Å at a moderate spectral resolution, about Å FWHM. Spectra were obtained at two slit positions, one centered on the NW HII region and rotated to PA 7.6∘ (slit a) and another positioned across the SE HII region at a PA of 131.0∘ (slit b); the total integration times were 12,000 s and 9,900 s, respectively. The spectrum of the night sky background was recorded on both ends of the slit. The seeing limited the resolution along the slit to . Care was taken to monitor the effects of varying parallactic angle over the time sequence of frames (Filippenko 1982).
The data reduction followed standard techniques and employed the IRAF 222 IRAF is distributed by the National Optical Astronomical Observatories, which are operated by the Association of Universities for Research in Astronomy, Inc. (AURA), under contract with the National Science Foundation. software package. The raw CCD frames were bias subtracted, corrected for pixel-to-pixel sensitivity variations and slit illumination, transformed using exposures of an HeNeAr arc lamp, and extinction corrected. A new field flattener was being tested during the November run, and these data required an additional distortion correction. Cosmic rays were removed when the individual frames were combined. The spectra were flux calibrated using observations of standard stars (Massey et al. 1988).
4.3.2 Primordial Ionized Gas ?
Figure 5 demonstrates that the ionized gas across the region where the superbubbles are detected is not primordial. The [OIII] emission extends along slit “a” as far (23or 1100 pc) to the SW as the H emission line which has comparable intensity. To the NE the intensity of [OIII] falls faster than the H intensity but is clearly detected to 21(1030 pc). A lower O abundance to the NE or a lower ionization state could explain the declining [OIII] / H ratio. Along slit “b”, the emission lines [OIII] and H are spatially coincident and detected over 35. However, we find no evidence for an abrupt edge to the O-enriched gas within the ionized ISM in I Zw 18, as might be expected if the galaxy contains an ultra-low metallicity HI halo (Kunth et al. 1994).
4.3.3 Abundance Variations
We use the data along slit “a” to place an upper limit on the variation of the O/H abundance ratio within the inner region of the nebula. The temperature-sensitive line [OIII] is detected over 11(530 pc). This region was divided into four 29 apertures (a1 to a4), whose positions relative to the NW HII region are shown in Figure 6. Table 4 lists the measured line fluxes. The logarithmic extinction at H was derived from the ratio of the H and H fluxes assuming a stellar Balmer absorption equivalent width of 2 Å (e.g. Shields & Searle 1978). The line ratio was corrected for reddening using the extinction curve of Miller & Matthews (1972). An external check of the line fluxes for the NW HII region yields excellent agreement with Skillman & Kennicutt (1993), and fluxes from slits “a” and “b” are consistent at their intersection.

Along slit “a”, the line ratio shows evidence for a significant temperature gradient from the SW to the NE side of the nebula, which is illustrated in the bottom panel of Figure 6. The photometric errors are dominated by the 2-3% uncertainty of our flux calibration for bright lines and by read noise and photon noise in the fainter lines. These uncertainties were combined in quadrature with the reddening uncertainty to derive the error bars denoted by “X” in Figure 6. The error bars denoted by “–” include an additional term for the maximum errors introduced by deviations from the parallactic angle.
The O/H abundance ratios shown in Figures 6bc were computed with the IRAF interface (Shaw & Dufour 1995) to the five-level atom program of De Robertis, Dufour, & Hunt (1987). The temperature was calculated from and the parameterization of Pagel et al. (1992) which is based on model calculations by Stasinska (1990). The O+3/H abundance was estimated from the HeII 4686 Å flux, and the contribution to the total O/H was found to be much less than the magnitude of our error bars.
Our abundance analysis is quite sensitive to . Atmospheric dispersion shifting the auroral line of a few tenths of an arcsecond along the slit relative to the nebular lines could cause a significant error in the temperature measurements. To test for this effect, the frames with and the frames with were separately combined and analyzed. The results from each set of spectra were similar. However, we decided to only use the frames taken at the parallactic angle, , for the abundance analysis; and this selection criterion eliminated most of the frames along slit b. Unfortunately, the small aperture and steep surface brightness profile still make atmospheric dispersion along the slit () a serious concern. For these observations, the atmospheric dispersion between 4000 Å and 5000 Å is along the slit (Filippenko 1982). The resulting offset along the slit between the profiles of the [OIII] 4363 Å and [OIII] 5007 Å lines could introduce a systematic error in as large as near the inflection point in the surface brightness profile. This effect could introduce an artificial gradient in the measured line ratio, but the slope would be in the opposite direction of the trend we measure. Hence, we believe the gradient in is real but adopt the larger error bars to caution the reader about a potential systematic error. We conclude that the O/H abundance ratio in the central 11(530 pc) is witin 20% that of the NW HII region.
5 Summary
This paper reports new kinematic evidence for expanding, galactic-scale shells of ionized gas in I Zw 18 and determines their implications for the galaxy’s evolution. We introduced a dynamical model to quantify the age and power requirements of these superbubbles and an evolutionary synthesis model to associate a stellar population with them. The mass of metals synthesized by this burst and the metallicity of the HII regions was used to discuss the mass of interstellar gas polluted by the starburst. The detection of oxygen emission lines from the diffuse gas demonstrates the large spatial extent of the metal-enriched, ionized gas. The following conclusions can be drawn.
-
1.
A supergiant shell of ionized gas extends southwestward from the galaxy. The observed line splitting sets a firm lower limit of 30 km s-1 on the shell’s expansion speed. The shell could be as old as 30 Myr.
-
2.
On the opposite side of the NW HII region, an H shell of comparable extent is seen, and the echellogram shows some evidence for a second supergiant shell in this region. These bubbles may constitute the lobes of a supergiant bubble driven by the starburst and constricted by the morphology of the ambient medium to form a bipolar bubble. Geometrical considerations suggest the shell expands at a speed of km s-1 .
-
3.
The superbubble and starburst may be coeval. A star formation rate of 0.02 (of 1 to 100 stars) yr-1 over the last Myr can accelerate the shell and produce the blue luminosity, the UBV colors, and most of the ionizing luminosity of IZw18. Instantaneous burst models fail to produce enough hydrogen ionizing photons.
-
4.
The superbubble will probably blowout of the galaxy, and the hot component of the ISM will escape from the galaxy in a galactic wind. Our analysis of the gas dynamics supports the general picture that galactic winds are an important process in the chemical evolution of dwarf galaxies (Matteuci & Chiosi 1983; Marconi et al. 1994; Matteuci & Tosi 1985).
-
5.
The current starburst will probably eject only a small fraction of the galaxy’s total gaseous mass. Catastrophic mass loss – proposed to transform gas-rich dwarfs into dwarf elliptical galaxies (Ferguson & Binggeli 1994 and references therein) – is unlikely from the current starburst, which may be the first in I Zw 18. Whether this is the common outcome of wind driven mass loss from dwarf galaxies is not yet clear (Meurer et al. 1992; Marlowe et al. 1995; Heckman et al. 1995).
-
6.
The detection of the superbubble establishes a timescale ( 15 - 27 Myr) and spatial scale ( 900 pc) for dispersing the recently synthesized elements. Oxygen emission lines are detected in the diffuse gas over this spatial scale. A pilot study of the gas phase metal abundance suggests the SW side of the nebula has a lower and slightly higher oxygen abundance than the NE side.
-
7.
The X-ray emission is slightly harder and brighter than that predicted from the superbubble. Higher resolution observations are needed to determine the fraction of X-ray luminosity produced by additional sources.
TABLE 1
Properties of I Zw 18
Quantity
Value
Source
d
10 Mpc
1
B
15.8
2
-14.2
ergs s-1 cm-2
s-1
1
(U-B)
-0.88
3
(B-V)
-0.01
3
1) Lequeux & Viallefond (1980)
2) Melisse & Israel (1994)
3) Colors corrected for emission lines but not nebular continuum; Sudarsky (1995).
Note: is the volume filling factor.
TABLE 2
Starburst ModelsaaPopulation synthesis calculations from Leitherer & Heckman (1995).
| Star Formation History | Instantaneous | Continuous | Continuous |
|---|---|---|---|
| Burst | Rate | Rate | |
| Age, (Myr) | 15 | 15 | 27 |
| Absolute Blue Magnitude, | -20.4 | -14.2 | -14.2 |
| Luminosity of H Ionizing Photons, Q () | |||
| Mass of 1 – 100 Stars, ( ) | |||
| U-B (mag) | - 0.53 | -0.78 | -0.70 |
| B-V (mag) | 0.04 | -0.03 | -0.02 |
| Kinetic Energy, (ergs) |
TABLE 3
Gravitational Potential Model
| r | |||
|---|---|---|---|
| (kpc) | (pc) | ( km s-1 ) | (K) |
| 1 | 200 | 91 | 1.2e5 |
| 1 | 400 | 78 | 8.9e4 |
| 1 | 800 | 63 | 5.8e4 |
| 1 | 1000 | 57 | 4.8e4 |
| 10 | 200 | 125 | 2.3e5 |
| 10 | 400 | 116 | 2.0e5 |
| 10 | 800 | 106 | 1.7e5 |
| 10 | 1000 | 103 | 1.6e5 |
Column identifications:
(1) – Truncation radius of isothermal sphere. The circular velocity is fixed at 40 km s-1 .
(2) – Radius.
(3) – Escape velocity at r.
(4) – Escape temperature at r.
TABLE 4
MMT Spectra and Derived Emission Line RatiosaaEmission line fluxes relative to H; no reddening corrections have been applied. Apertures a1 - a4 are described in the text.
| Property | Region | |||
|---|---|---|---|---|
| a1 | a2 | a3 | a4 | |
| 3727 [OII] | 0.471 0.017 | 0.268 0.006 | 0.418 0.010 | 0.497 0.014 |
| H | 1.000 0.020 | 1.000 0.020 | 1.000 0.020 | 1.000 0.020 |
| 4363 [OIII] | 0.061 0.005 | 0.065 0.002 | 0.053 0.002 | 0.037 0.003 |
| 4959 [OIII] | 0.615 0.013 | 0.716 0.014 | 0.678 0.014 | 0.504 0.010 |
| 5007 [OIII] | 1.805 0.036 | 2.102 0.042 | 1.998 0.040 | 1.554 0.031 |
| H | 3.457 0.070 | 2.883 0.058 | 2.906 0.058 | 2.698 0.054 |
| c(H)bbLogarithmic extinction at H. | 0.29 0.10 | 0.05 0.10 | 0.05 0.10 | -0.04 0.10 |
| ccDereddened flux ratio | 35.5 3.1 | 42.6 2.3 | 49.1 3.1 | 56.4 5.6 |
References
- (1)
- (2) Arnett, D. 1996, Supernovae and Nuclei (Princeton Univ. Press: Princeton, New Jersey).
- (3)
- (4) Binney, J., & Tremaine, S. 1987, Galactic Dynamics (Princeton University Press: Princeton, New Jersey).
- (5)
- (6) Castor, J., McCray, R., & Weaver, R. 1975, ApJ, 200, L107.
- (7)
- (8) Chu, Y., Chang, H., Su, Y., & Mac Low, M., 1995, ApJ, 450, 157.
- (9)
- (10) Davidson, K., Kinman, T. D. 1985, ApJS, 58, 321.
- (11)
- (12) Davidson, K., Kinman, T. D., & Friedman, S. D. 1989, AJ, 97, 1591.
- (13)
- (14) Dekel, A., & Silk, J. 1986, ApJ, 303, 39.
- (15)
- (16) De Robertis, M., Dufour, R., & Hunt, R. 1987, JRASC, Vol. 81, No. 6, 195.
- (17)
- (18) De Young, D. S., & Gallagher, J. S 1990, ApJ, 356, L15.
- (19)
- (20) Dufour, R. J., & Hester, J. J. 1990, ApJ, 350, 149.
- (21)
- (22) Ferguson, H. C., & Binggeli, B. 1994, A&AR, 6, 67.
- (23)
- (24) Filippenko, A. V. 1982, PASP, 94, 715.
- (25)
- (26) Grevesse, N. & Noels, A., 1993, in Origin and Evolution of the Elements, ed. N. Prantzos, E. Vanigioni-Flam, & M. Cassé, (Cambridge University Press), p 14.
- (27)
- (28) Hasinger, T., Turner, T. J., George, I. M., & Boese, G. 1992, OGIP Calibration Memo CAL/ROS/91-001, (NASA: GSFC).
- (29)
- (30) Heckman, T. M., Armus, L., & Miley, G. K. 1990, ApJS, 74, 833.
- (31)
- (32) Heckman, T. M., Dahlem, M., Lehnert, M. D., Fabbiano, G., Gilmore, D., & Waller, W. H. 1995, ApJ, 448, 98.
- (33)
- (34) Heiles, C. 1975, A&AS, 20, 37.
- (35)
- (36) Hunter, D. A., & Thronson, H. A. 1995, ApJ, in press.
- (37)
- (38) Kennicutt, R. C. 1989, ApJ, 344, 685.
- (39)
- (40) Kennicutt, R. C. 1984, ApJ, 287, 116.
- (41)
- (42) Koo, B.-C., & McKee, C. F. 1992, ApJ, 388, 93.
- (43)
- (44) Kunth, D., Lequeux, J., Sargent, W. L. W., & Viallefond, F. 1994, A&A, 282, 709.
- (45)
- (46) Kunth, D., Matteucci, F., & Marconi, G. 1995, A&A, 297, 634.
- (47)
- (48) Kunth, D. & Sargent, W. L. W. 1986, ApJ, 300, 496.
- (49)
- (50) Larson, R. B. 1974, MNRAS, 169, 229.
- (51)
- (52) Leitherer, C. 1990, ApJS, 73, 1.
- (53)
- (54) Leitherer, C., & Heckman, T. M. 1995, ApJS, 96, 9L.
- (55)
- (56) Lequeux, J., Peimbert, M., Rayo, J. F., Serrano, A., & Torres-Peimbert, S. 1979, A&A, 80, 155.
- (57)
- (58) Lequeux, J., & Viallefond, F. 1980, A&A, 91, 269.
- (59)
- (60) Mac Low, M-M, & McCray, R. 1988, ApJ, 324, 776.
- (61)
- (62) Mac Low, M-M, & McCray, R., Norman, M. L. 1989, ApJ, 337, 141.
- (63)
- (64) Marconi, G., Matteucci, F., & Tosi, M. 1994, MNRAS, 270, 35.
- (65)
- (66) Marlowe, A. T., Heckman, T. M., Wyse, R. F. G., & Schommer, R. 1995, ApJ, 438, 563.
- (67)
- (68) Martin, C. L. 1996, PhD Thesis, University of Arizona.
- (69)
- (70) Martin, C. L., & Kennicutt, R. C. 1995, ApJ, 447, 171.
- (71)
- (72) Matteucci, F. &, Chiosi, C. 1983, A&A, 123, 121.
- (73)
- (74) Matteucci, F. &, Tosi, M. 1985, MNRAS, 217, 391.
- (75)
- (76) McKee, C. F. & Ostriker, J. P. 1977, ApJ, 218, 148.
- (77)
- (78) McKee, C. F. 1990, in The Evolution of the Interstellar Medium, ed. Leo Blitz, (ASP: San Francisco), p 3.
- (79)
- (80) Melisse, J. P. M., & Israel, F. P. 1994, A&AS, 103, 391.
- (81)
- (82) Meurer, G. R. 1991, Proc. ASA, 9, 98.
- (83)
- (84) Meurer, G. R., Freeman, K. C., Dopita, M. A., & Cacciari, C. 1992, AJ, 103, 60.
- (85)
- (86) Meurer, G. R., Heckman, T. M., Leitherer, C., Kinney, A., Robert, C., & Garnett, D. R. 1995, AJ, 110, 2665.
- (87)
- (88) Miller, J. S., & Mathews, W. G. 1972, ApJ, 172, 593.
- (89)
- (90) Osterbrock, D. E. 1989, Astrophysics of Gaseous Nebulae and Active Galactic Nuclei (University Science Books: Mill Valley, CA).
- (91)
- (92) Ostriker, J. P., & McKee, C. F. 1988, Reviews of Modern Physics, 60, 1.
- (93)
- (94) Pagel, B. E. J., Simonson, E. A., Terlevich, R. J., & Edmunds, M. G. 1992, MNRAS, 255, 325.
- (95)
- (96) Pantelaki, I. & Clayton, D. D. 1987, in Starbursts and galaxy evolution; Proceedings of the Twenty-second Moriond Astrophysics Meeting, Les Arcs, France, (Gif-sur-Yvette, France, Editions Frontieres), p. 145.
- (97)
- (98) Pettini, M., & Lipman, K. 1995, A&A, 297, 63.
- (99)
- (100) Prantzos, N. 1994, A&A, 284, 477.
- (101)
- (102) Renzini, A, Greggio, L., Ritossa, C. & Ferrario, L. 1992, ApJ, 400, 280.
- (103)
- (104) Saito, M. 1979, PASJ, 31, 193.
- (105)
- (106) Sargent, W. L. W., & Searle, L. 1970, ApJ, 162, L155.
- (107)
- (108) Searle, L. & Sargent, W. L. W. 1972, ApJ, 173, 25.
- (109)
- (110) Shaw, R. A., & Dufour, R. J. 1995, PASP, (in press).
- (111)
- (112) Shields, G. A., & Searle, L. 1978, ApJ, 222, 821.
- (113)
- (114) Shull, J. M., & Saken, J. M. 1995, ApJ, 444, 663.
- (115)
- (116) Shull, J. M. 1993, in Massive Stars: Their Lives in the Interstellar Medium, ed. J. P. Cassinelli & E. B. Churchwell (San Francisco: ASP), 327.
- (117)
- (118) Skillman, E. D. 1989, ApJ, 347, 883.
- (119)
- (120) Skillman, E. D., & Kennicutt, 1993, ApJ, 411, 655.
- (121)
- (122) Skillman, E. D., Melnick, J., Terlevich, R., & Moles, M. 1988, A&A, 196, 31.
- (123)
- (124) Stark, A. A., Gammie, C. F., Wilson, R. W., Bally, J., Linke, R. A., Heiles, C., & Hurwitz, M. 1992, ApJS, 79, 77.
- (125)
- (126) Stasinska, G. 1990, A&AS, 48, 299.
- (127)
- (128) Sudarsky, D. L. & Salzer, J. J., 1995, baas 186, 3904.
- (129)
- (130) Sudarsky, D. L. 1995, private communication.
- (131)
- (132) Tinsley, B. 1980, Fund. Cosm. Phys., 5, 287.
- (133)
- (134) Vader, J. P. 1986, ApJ, 305, 669.
- (135)
- (136) Vader, J. P. 1987, ApJ, 317, 128.
- (137)
- (138) Viallefonde, F., Lequeux, J., and Comte, G. 1987, in Starbursts and Galaxy Evolution, ed. T. X. Thuan, T. Montmerle, and J. Tran Than Van (Editions Frontière: Gif sur Yvette), p. 139 (VLC87).
- (139)
- (140) Weaver, R., McCray, R., & Castor, J. 1977, ApJ, 218, 377.
- (141)
- (142) Yorke, H. W., Tenorio-Tagle, G., & Bodenheimer, P. 1984, A&A, 138, 325.
- (143)
- (144) Zwicky, F. 1966, ApJ, 143, 192.
- (145)