Line Emission from an Accretion Disk around a Rotating
Black Hole: Toward a Measurement of Frame Dragging
Benjamin C. Bromley1,2, Kaiyou Chen1,3 and Warner A. Miller1
1Theoretical Astrophysics, MS B288, Los Alamos National Laboratory, Los Alamos, NM 87545
2Theoretical Astrophysics,
MS-51, Harvard-Smithsonian
Center for Astrophysics
60 Garden Street, Cambridge, MA 02138
3Columbia Astrophysics Laboratory, Columbia University, 538 West 120th Street, New York, NY 10027
Abstract
Line emission from an accretion disk and a corotating hot spot about a rotating black hole are considered for possible signatures of the frame-dragging effect. We explicitly compare integrated line profiles from a geometrically thin disk about a Schwarzschild and an extreme Kerr black hole, and show that the line profile differences are small if the inner radius of the disk is near or above the Schwarzschild stable-orbit limit of radius . However, if the inner disk radius extends below this limit, as is possible in the extreme Kerr spacetime, then differences can become significant, especially if the disk emissivity is stronger near the inner regions. We demonstrate that the first three moments of a line profile define a three-dimensional space in which the presence of material at small radii becomes quantitatively evident in broad classes of disk models. In the context of the simple, thin disk paradigm, this moment-mapping scheme suggests formally that the iron line detected by the Advanced Satellite for Cosmology and Astrophysics mission from MCG-6-30-15 (Tanaka et al. 1995) is 3 times more likely to originate from a disk about a rotating black hole than from a Schwarzschild system. A statistically significant detection of black hole rotation in this way may be achieved after only modest improvements in the quality of data. We also consider light curves and frequency shifts in line emission as a function of time for corotating hot spots in extreme Kerr and Schwarzschild geometries. The frequency-shift profile is a valuable measure of orbital parameters and might possibly be used to detect frame dragging even at radii approaching if the inclination angle of the orbital plane is large. The light curve from a hot spot shows differences as well, although these too are pronounced only at large inclination angles.
Subject headings: accretion, accretion disks — black holes — galaxies: active — galaxies: nuclei — line profiles
1 Introduction
Black holes manifest themselves, in part, through emission of intense radiation from material associated with accretion processes. Currently, about a dozen black hole candidates are known within the Galaxy and many more supermassive black holes are believed to be in the nuclei of active galaxies. It is likely that most, if not all, of these black holes are spinning near their maximal rate such that the angular momentum and mass are related by . Thus light emitted from the region close to the horizon of a rotating black hole is subject to frame dragging — an effect predicted by Einstein’s theory of general relativity, also known as gravitomagnetism or the Lense-Thirring effect (Thirring & Lense 1918; Misner & Thorne & Wheeler 1970).
To date frame dragging has not been verified by any observation or measurement. However, there are currently two proposed satellite experiments, LAGEOS-3 and Gravity Probe-B, which are slated to measure this effect around the earth (Ciufolini 1986; Habib et. al. 1994; Van Patten & Everitt 1976). While the frame dragging on satellite orbits around the earth is small (approximately 1 part in ) when compared with the classical quadrupole contributions, in astrophysics the gravitational binding energies are large enough so as to make the dragging of inertial frames the dominant precessional effect. Furthermore, the frame dragging effect together with the shear viscosity of accreted material may be responsible for the alignment of an accretion disk with the parent black hole’s spin axis, and may explain the stability of astrophysical jets (Bardeen & Peterson 1975). It is for these reasons that we search for an astrophysically relevant setting to observe frame dragging.
Material drawn into the neighborhood of a black hole is likely to carry some net angular momentum, hence the formation of an accretion disk seems highly probable if not inevitable. The dominant radiation from such an object is in the form of continuum emission, which has been the subject of intensive study over last few decades. Models of thermal emission from a geometrically thin and optically thick disk give good fits to the UV, optical, and IR spectra of many active galactic nuclei (Sun & Malkan 1988). However, kinematic information about the disk is difficult to extract from continuum emission. For example, even with the simplest accretion disk model the interpretation of continuum spectra is not unique (Ferland & Rees 1988). Therefore continuum emission provides only limited information about the physical environment near the black hole.
Atomic line emission can also arise from accretion disks around supermassive black holes in AGNs, as evidence accumulated over the last seven years demonstrates:
1. Observed broad and double-peaked low-ionization lines from some AGNs are consistent with emission from a geometrically thin Keplerian disk. Arp 102B (Chen, Halpern & Filippenko 1989; Chen & Halpern 1989) is the prototype and more samples are listed in Eracleous & Halpern (1994). Nearly all of these disk emitters are found within radio galaxies.
2. In contrast to low-ionization lines, high-ionization lines such as Lyα of Arp 102B lack the corresponding double peaked components. The material producing the low-ionization double-peaked line emission must be denser than typical broad-line clouds. This requirement is in agreement with an accretion disk model (Halpern et al. 1995).
3. The double peaked line emission of Arp 102B is polarized and the polarization angle is constant (Antonucci, Agol & Hurd 1996) for the whole line-emission profile. This requires a flat, disk-like geometry for scattering electrons.
4. The physical parameters determined from fitting the detailed line profile with the accretion disk model is consistent with those inferred from other independent methods. Inclination angles deduced from a relativistic disk model are generally modest (), consistent with fact that many of the objects are double-lobe radio sources in which broad emission lines are neither obscured by the host galaxy nor emitted from material with relativistic line-of-sight velocity. In particular, for radio galaxy 3C390.3, the inclination angle of inferred from the observed superluminal motion is extremely close to the value derived from the fit with the relativistic disk model (Eracleous, Halpern & Livio 1996).
Since the physics of atomic line emission is well understood, the information carried by line emission provides us with a useful tool to explore the region near the black hole. At present, optical lines provide the best evidence of black holes in the nuclei of active galaxies. However, the typical orbit radius of the disk region emitting optical lines is a few hundred times the gravitational radius (this is half of the horizon radius in the case of a nonrotating black hole), not close enough to the black hole to reveal the higher-order frame dragging effects. It was speculated that some X-ray emission lines may come from a region much closer to the black hole, thus permitting a test of the frame dragging effect (Chen et al. 1989). Recent observations by the Japanese ASCA satellite have turned this speculation into reality. Broad iron K lines have been reported for three Seyfert galaxies (Fabian et al. 1994). A four-day exposure of one of them, MCG 6-30-15, has yielded a well-resolved Fe Kα line with an extremely broad profile that is consistent with an accretion disk extending from 6 - 20 (Tanaka et al. 1995). This significant discovery is good cause to believe that frame dragging can be detected in an astrophysical setting.
In the present work we focus on the information that can be extracted from line profiles and time-varying signals from an accretion disk. Thus, we are embarking on a study in which the detection of frame dragging is part of a more general probe of the physics in the environment of a rotating black hole. This paper reports our investigation of frame dragging and its effect on the line emission from an accretion disk about a rotating (Kerr) black hole. We discuss the construction of an accretion disk image from photons traveling in the curved Kerr spacetime geometry, and then consider signatures of frame dragging from a radiating disk and from a hotspot of localized emission. This material is a synthesis and extension of the work by Laor (1991), Karas, Vokrouhlický & Polnarev (1992), and Zakharov (1994). The principle advances reported here stem from an increase in the temporal and photon-frequency resolution in the numerical code which was brought to bear on the problem of observing the frame dragging effect.
2 Ray Tracing in a Kerr Metric and Imaging an Accretion Disk
The trajectory of a photon in the Kerr metric can be described with aid of three constants of motion (Misner, Thorne, & Wheeler 1970),
| (1) |
where , , and are the usual Boyer–Lindquist coordinates, is the four-momentum and is the magnitude of reduced angular momentum in units the black hole mass (a value of is the maximal, or extreme, case). In this section and hereafter, we use natural units such that . In order to eliminate difficulties with inflection points along any trajectory we solved the three second-order geodesic equations, for , and .
| (2) |
Here, the ’s are connection coefficients; Latin indices take the values 1,2,3 (with , and representing , and , respectively) and Greek indices range from 1 to 4; repeated Greek indices denotes summation.
To obtain an image of an accretion disk as seen by a distant observer we integrated the geodesic equations (2) to obtain trajectories of photons which propagate from a uniform Cartesian grid of points in the sky plane to the accretion disk. The uniform grid may be associated with the field imaged by pixels of a CCD detector.
The integration of equations (2) was performed in three stages. First, we determined the initial-value data, i.e., the phase-space location of the photons; the starting points of the trajectories were typically at a large distance, , from the black hole. In the second stage, we integrated the equations from until the photon just crossed the plane of the disk. An adaptive step -order Runge–Kutta method was used to calculate the trajectory. Finally, we used a golden selection search to determine the spacetime intersection of the photon and the disk with high accuracy. We discarded photons that were intercepted by the hole (as determined by an inner cutoff radius) or otherwise missed the disk. On output we saved the Boyer-Lindquist coordinate of the photon-disk intersection, the time of flight in the frame of the distant observer, and frequency shift information for each pixel.
The process of generating a pixel image of an accretion disk requires tracking independent photon trajectories. Thus, the problem is readily implemented on a parallel computer, with each node assigned to a unique set of pixels. The only pitfall is that some photon trajectories are more difficult to calculate than others, hence load balancing is a potential concern. Typically, trajectories which bring the photon closer to the black hole are more time consuming. Our solution to the problem was to assign processors to interleaved rows of the pixel array; the result was a tolerable clocktime difference of 10–20 % between the fastest processors and the slowest. As a result, we were able to generate an image of pixels in about 15 minutes using 128 nodes on a Cray T3D.
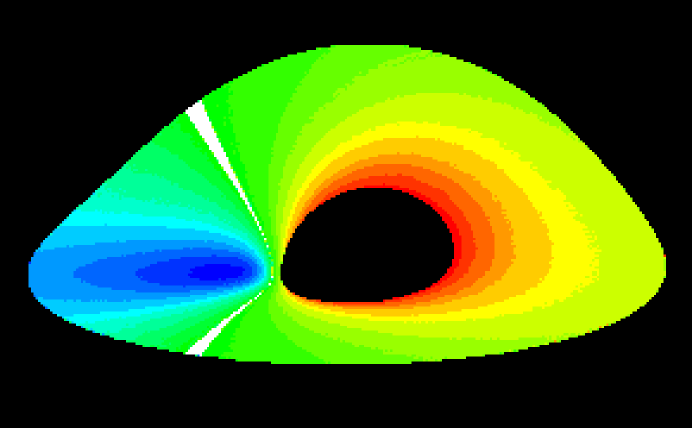
An example of this procedure can be seen in Figure 1, an image of a geometrically thin accretion disk around a maximally-rotating black hole (). The inner and outer radii are at and , respectively, and the disk is viewed at 75∘ with respect to the polar axis. The false colors indicate frequency shift of emitted photons as a result of Doppler and gravitational redshift. The image clearly shows the gravitational refocusing of the photons emitted from the far side of the disk; this effect causes the far side of the disk to appear as if it were bent toward the observer. The more subtle effects of frame dragging are evident in the overall shape of disk and the asymmetry of frequency shift along contours of fixed radius between near and far sides of the disk.
3 Line Profiles of Disk Emission
As mentioned above, X-ray line profiles from emission integrated over the surface of an accretion disk can provide insight into the physics of the environment immediately surrounding a black hole. With some generality we may write the observed flux at frequency from an accretion disk as
| (3) |
where is the specific intensity which is a function of the frequency of the emitted photon, the angle cosine of the photon emission with respect to the normal of the disk as measured in the source frame, and the radial location of the emitting material on the disk. The transfer function determines the fraction of locally emitted energy that is ultimately detected by the observer at frequency . In addition to the intrinsic disk quantities , , and , this function depends on observed frequency, the inclination angle of the disk as given by the angle cosine , and the distance between source and observer. The integration over , an element of solid angle, covers the image of the disk in the observer’s sky plane. The factor arises because is an invariant from one observer to another, and from one event to another, along the entire trajectory of the photon. This invariant results from the principle of conservation of photons in a flux tube together with conservation of volume in phase space (Liouville’s theorem holds in curved spacetime). Indeed, is equal, up to a power of Planck’s constant, to the photon phase-space density.
In the work of Laor (1991) and Speith, Riffert & Ruder (1995), explicit calculation of the transfer function in equation (3) was performed to obtain profiles of integrated flux versus frequency for a given specific intensity. Here, we perform essentially the same calculation by binning the observed flux at each pixel in a disk image. Figure 2 illustrates the flux in models where a single atomic line is locally emitted from a disk with uniform emissivity, so that is a delta function when is between the inner and outer disk radii. The figure shows line profiles which are similar to those given by Laor (1991), except that here the resolution is significantly enhanced.

The purpose of Figure 2 is to compare disk emission from an extreme Kerr black hole with that from a nonrotating (Schwarzschild) system. The outer disk radius in both systems is 15 while the inner radius is 1.25 and 6 for the Kerr and Schwarzschild cases respectively, values which are near or at the innermost stable orbit. The most notable features in the line profiles are the double peaks which are mostly determined by the physical and geometrical parameters at a relatively large distance from the inner most stable orbit. Thus, the differences between the Kerr and Schwarzschild cases are expected to be small. However, the shape of the profiles are generally distinct. For example, the weak red emission below the red peak in the line profile is less in the Schwarzschild system. The depth of the trough between the two peaks is also less in the Schwarzschild case than in the extreme Kerr system; at an inclination angle of 30∘ the line flux at the trough minimum is % higher in the Kerr case; at 75∘ the excess in the Kerr signal is about 20% when the observed frequency equals the emitted frequency. The effect becomes stronger when the outer disk radius is reduced. For example, when the outer radius is the excess in the Kerr signal is approximately twice that of the case.
These distinguishing features of the line profiles in the Kerr system result from material in stable orbits below . When the disk emissivity is uniform, this material contributes only a small fraction of the total flux in a line profile. Thus it is not surprising that the differences in the line profiles are not pronounced. The detection of frame dragging by the presence of this material will be difficult, requiring flux measurement errors to be less than a few percent in frequency bins that are times the width of the line.
Fortunately, the case of uniform disk emissivity is likely to be a worst-case scenario. Instead, the observational evidence suggests that the emissivity falls off with radius as a power law of index such that (Chen et al., 1989; Eracleus & Halpern 1994; Tanaka et al. 1995). The effect is to brighten the inner part of the disk relative to the outer part, hence contributions from emission at small radii are likely to be much greater than in Figure 2. Indeed, with disk parameters similar to ones fit by Tanaka et al. (1995) for the MCG-6-30-15 Fe line profile we found that the differences between the Kerr and Schwarzschild cases increased significantly, as seen in Figure 3. The figure illustrates that the height of the central trough and the red peak in an integrated line profile depends sensitively on material nearest the disk’s inner radius. The figure also shows that the presence of frame dragging is not apparent if the inner radius of the disk is or above; for example the profile from a Kerr system with an inner radius of is similar to the Schwarzschild case with disk material down to its minimum stable orbit of 6. This result gives hope that black hole rotation may be detected but only if there is a line-emitting accretion disk that extends well below 6.

In practice, detection of a disk with a small inner radius will require the ability to locate the peaks of the line profile to within a few percent and to determine flux to similar accuracy. The next generation of X-ray satellites beginning with the planned Advanced X-ray Astronomical Facility could provide the necessary resolution in energy and flux. The emissivity of the disk must then be modeled and fit along with inner and outer disk radii and angle of inclination. There are prominent features in the line profiles of Figure 3 that offer, at the very least, consistency checks on a model. These include the height and location of the peaks, the depth of the trough, and the kink found on the blue side of the trough when the inner radius is above several . Furthermore, some parameters of the disk model may be determined from other astronomical observations. For example, the inclination angle of the disk may be inferred from the apparent superluminous motion of jets or from the equivalent width of emission lines.
A comparison between a model line profile and currently available data is shown in Figure 4. The data are from MCG-6-30-15 as given in Tanaka et al. (1995). The model for this simple demonstration came from a nonlinear simplex search fit to the disk radii and equivalent width. A more general fit which includes the inclination angle as a parameter, requires a series of disk images, each at a distinct inclination angle.

3.1 Line Profile Moments
The detection of frame dragging should come from fitting models to data in order to identify disk material in stable orbits below 6. However, it is reasonable to seek general characteristics of a line profile that are sensitive to the presence of emitting material at small radii even if these characteristics lack sufficient information to uniquely specify a disk model. Here we look at low-order moments of the line profile; other possible characteristics, which are not considered here, include “colors” of the broad line emission as determined by a set of frequency filters.
We define the following three quantities, essentially the mean, standard deviation, and skewness of a line profile taken as a function of :
| (4) | |||||
| (5) | |||||
| (6) |
here, is assumed to be normalized so that it integrates to unity. These observables form a 3D “moment space” into which we may map both observational data and model predictions in terms of moment vectors .
For a given plausible range of model parameters, such as disk radii and emissivity index , there exists a region in the moment space which contains only points that can be generated from the model line profiles. If a data point falls inside of this region then the disk paradigm may provide a good general description of the physics of the observed system. Conversely, if a data point falls outside of this surface, then the disk models cannot adequately account for the observed line profile.
Within the region there exists a subregion, , that consists of all line profile moment vectors from Schwarzschild systems. The detection of frame dragging then may amount to observing a moment vector within but outside of . Of course, for this scheme to be of practical value, the moment vectors must respond sensitively to the presence of orbiting disk material below 6 in such a way that they are excluded from the region . In other words, the Schwarzschild region must not fill a large volume of . Indeed, we have found that this criterion is met. Figure 5 illustrates that for a broad range of disk model parameters (inclination angle of 5∘ to 40∘, , and disk radii less than 15), Kerr systems with inner disk radii near the innermost stable orbit generate moment vectors which lie entirely outside of .


This moment-mapping scheme offers the possibility of making fairly broad statistical inferences from a comparison of models and real data. As an example, we again consider the data of Tanaka et al. (1995). The line profile data with the published uncertainties were used to generate Monte Carlo realizations of moment vectors, shown in Figure 5. We assumed errors are normally distributed. The overlap between these vectors and the regions which correspond to the models can be used as an indicator of confidence in the models, assuming all models are equally likely to describe the physics of the system. The region contains % of the Monte Carlo vectors, and we take this to mean that the relativistic thin disk models as a class are excluded at a [low] confidence level of % on the basis of the ASCA data. [We are not trying to rule out individual models here; instead we are favoring or disfavoring a class of models, in comparison with, say, other unspecified classes that lie outside of .]
We carry this line of reasoning further and look at the overlap between the ASCA data and subregions of . The Schwarzschild region contains 15% of the total Monte Carlo vectors, while a region corresponding to the extreme Kerr systems with inner radii of 1.25 contains fewer than 10%. Thus the ASCA data are more likely to be consistent with a Schwarzschild system than this extreme Kerr system. However, the data also suggest that there is at least some disk material below 6; over 40% of the total Monte Carlo vectors lie in the region that corresponds exclusively to models with a rotating black hole, about three times more than in the Schwarzschild models. We defer a rigorous statistical analysis (explicitly considering priors in a Bayesian framework) to another paper; our strong result here is that frame dragging may be identified with good confidence after only modest increase in the signal-to-noise ratio of the data.
4 Lightcurve of a Line-Emitting Hotspot
The integrated line profiles considered in the previous section apply when optically thick material covers the whole disk, occupying all possible circular orbits between the inner and outer disk radii. We now consider effects from localized emitters in the form of bright, line-emitting hotspots in orbit around a black hole. Such objects produce a time-varying signal that can reveal valuable information about the environment of a black hole. This type of scenario has been discussed extensively in the literature; recent work includes Bao (1992), Karas, Vokrouhlický & Polnarev (1992) and Zakharov (1994).
Observations of AGNs at both X-ray and optical frequencies indicate time variability. However, at present only optical measurements have a sufficient signal-to-noise ratio to show any detailed variation in line profiles. It is interesting to note that the line profile of Arp 102B which is well-fit by the relativistic disk model has not varied much in the last two decades. On the other hand, the line profile (at least the double peaked component) of many disk emitters have been seen to vary significantly on time scales as short as a few months. The origin of this variation is not yet understood. Models with an inhomogeneous disk (Zheng et al. 1991; Chakrabarti & Wiita 1994) or eccentric disk (Eracleous et al. 1995) have been proposed. The hotspot solutions we discuss here may be used as Green’s functions to construct lightcurves for these more complicated models. For the present purposes we consider the information content of just one spot.
The variation in line flux from a hotspot arises from at least two fundamental processes. The first is the frequency shifting of photons from the Doppler effect as the hotspot orbits the black hole. The second is flux amplification from gravitational lensing of photons by the black hole. Calculation of these two effects, along with the flight time of photons to a distant observer, produces the lightcurve. For realistic modeling, other processes may be included, such as occlusion of photon trajectories by an optically thick accretion disk or by the surface of the black hole, limb darkening, and tidal shredding of the orbiting hotspot. Here, we consider only occlusion by a disk in the sense that we map only those photons which are emitted from the side of the hotspot nearest the observer.
In our numerical code for producing accretion disk images we calculated the frequency shift for each pixel as in Figure 1. The gravitational amplification factor is proportional to the solid angle that a finite patch of emitting material subtends in the sky plane of the observer. In the image of an accretion disk, the lensing effect is calculated implicitly by the mapping of photon trajectories from the disk to the observer’s sky plane. Lensing is manifested in the distortion of the disk relative to an image in flat space; regions of high amplification simply occupy more pixels and thus appear magnified in the sense of geometric optics. Here, a hotspot is taken to be arbitrarily small and is therefore unresolvable in an image. The amplification factor for a given point on the disk is thus evaluated by mapping adjacent pixels to the disk surface, a procedure which works quite well given the resolution of our images.
Figures 6 & 7 show frequency shifts and lightcurves of a hotspot around a black hole for different disk parameters. The lightcurves in Figure 6 are similar to those shown in previous work (e.g., Karas, Vokrouhlický & Polnarev 1992) except that here Kerr and Schwarzschild cases are directly compared.


In Figure 6 the difference in frequency shifts between a hotspot in a Kerr metric at a radius and one in orbit at 6 about a Schwarzschild black hole is seen to be small for low viewing angles. However, stable orbits in a Kerr metric below 5.5 do show distinguishing features. The most obvious, and perhaps the most important, is the high-degree of redshifting due to the potential well of the black hole at small . The profile of the frequency shift for a hotspot around a Kerr black hole also has a unique form which may be fit to real data to determine orbital parameters. At high inclination angle the frequency shift profile alone can serve to distinguish the extreme Kerr and Schwarzschild geometries, even at radii near if the data are of high quality.
Figure 7 contains lightcurves from hotspots in identical configurations as in Figure 6. Again, differences between the Kerr and Schwarzschild systems are not strongly evident at small inclination angle and large radius (), but are enhanced with increasing and decreasing . Without any highly distinctive features such as multiple peaks, perhaps these differences can be exploited only if the angle of inclination can be determined independently.
It is worth pointing out that the hotspot may also be emitting continuum radiation. For example, if the spectrum in the local frame is a power law , then the time-varying continuum signal from a spot that subtends a solid angle on the observer’s sky yields a flux of
where is the redshift which is the same for all photons from the hotspot at a given time ; and give the detector bandwidth and is the photon frequency in the source frame. The constant of proportionality in the last line of equations (4) depends only on the detector’s bandwidth and the normalization of . With containing the information about amplification from gravitational lensing and containing the variations in frequency shift (e.g., Fig. 6), it is straightforward to interpret lightcurves in this case. Interestingly, a continuum spectrum index of gives a flux variation of which is identical to the integrated flux from line emission (e.g. Fig. 6).
5 Discussion
Considerable evidence has accumulated which argues for the existence of massive compact objects with mass more than — the astrophysical definition of black holes. In AGNs, the observed rapid variability of enormous luminosity argues strongly for the presence of a supermassive () black hole. The broad optical emission lines whose profiles are consistent with the relativistic disk model provide the best kinematic evidence of the existence of a black hole and also of an associated accretion disk within its deep potential. For these reasons, the existence of supermassive black holes is not disputed. Therefore, we have focused here on the information that can be extracted from the local environment of black holes in AGNs in order to better understand the physics of these objects. We hope that in the near future, our effort (development of the ray tracing code in Kerr metric) may be used to examine real astrophysical systems and to confirm the frame dragging effect.
This work was largely motivated by the detection of broad Fe lines from several Seyfert galaxies (Mushotzky et al. 1995). The fit of the well-resolved, broad Fe K line from MCG-6-30-15 by the relativistic disk model is extremely promising (Tanaka et al. 1995). While we consider the presence of an accretion disk in this object to be the best explanation for the observations, there are the following issues to consider. The observed equivalent width, around 200 - 400 eV is a factor of 2–3 higher than the predictions of the simple disk reflection model with cosmic abundance. Furthermore, in some disk models, the part of the accretion disk near the black hole would be too hot due to shock heating to emit the Fe K line (Chakrabarti & Molteni 1995). The equivalent width discrepancy may be explained by elemental abundances in the disk which can certainly differ from their cosmic values. The presence of shock heating which would eliminate the Fe line altogether is best treated phenomenologically, as follows.
We note that all observations of broad Fe lines in AGNs occur in Seyfert I galaxies which normally have continuum spectra peaked in the UV. The flux in the thermal-like UV bump is about 10-20% of the total flux. If the UV bump is from thermal emission of accretion disk’s surface, then the thin cool accretion disk has to extend down to within roughly 10 Schwarzschild radii of the black hole. At this radius, hard X-radiation from an external source near the black hole can produce flourescence lines. On the other hand, the lack of UV bump from broad line radio galaxy 3C390.3 is accompanied by a lack of an extremely broad Fe line (Eracleous et al. 1996). The comparable width of the X-ray Fe line and the optical lines supports the hypothesis that the inner part of the accretion disk is in the form of a hot torus (Chen & Halpern 1989). Therefore, it may be no surprise that broad Fe lines are only seen in Seyfert I galaxies which have both a UV bump and a significant hard X-ray flux.
For these reasons we feel justified in choosing diagnostics of a line-emitting accretion disk as a probe for frame dragging effects in the nuclei of active galaxies. As noted before (Laor 1991), perhaps the best hope of detecting the frame dragging effect is to spot a stable Keplerian accretion disk at radii below the limit of 6imposed in a Schwarzschild metric. Here we made an explicit comparison of three observable quantities, the integrated line profile from an accretion disk, the frequency shift of an emission line from a hotspot, and the lightcurve of hotspot emission. In all cases, differences between the Kerr and Schwarzschild system were evident. However, at low inclination angle (∘), the differences tended to be small. This situation is unfortunate in that X-ray line emission is more likely to be measured in a system of low viewing angle, since then the inner part of a galactic nucleus is more likely to be visible to the observer.
Of the scenarios we discussed above in §3 and §4, the most promising for detecting a signature of frame dragging at low viewing angle is one in which an integrated line profile can be measured from a thin disk with emissivity falling off with radius as a power law; Figure 2 shows the case where the power law index is . There is evidence from optical observations that such an emissivity function is realistic (e.g., Chen & Halpern 1989). The evidence from X-ray lines is less compelling primarily because the available data are noise limited, but such an emissivity function is nonetheless consistent with observations (e.g., Tanaka et al. 1995). In this case, the presence of material in stable orbits below becomes quite clear; in Figure 2, for example, the net flux enhancement due to material between 1.25 and 6 is roughly a factor of 1.5. This enhancement is close to the amount needed to eliminate the discrepancy between the observed equivalent width in the Fe line of MCG-6-30-15 and the prediction of a thin disk model.
In constructing Figures 2–4 we chose parameters which were similar to those deduced from MCG-6-30-15 by Tanaka et al. (1995). In their paper Tanaka et al. showed that an extreme Kerr disk and a Schwarzschild system give very similar values, with an inner disk radius of about 8. In light of the present work, this is not altogether surprising, as we find the differences between the Kerr and Schwarzschild metric are generally not strong beyond 6. The X-ray data from MCG-6-30-15 are noisy, and evidently the surface for the model fitting is fairly flat; the uncertainty in the inner disk radius appears to be 1.5 at the 1- level. Thus, future observations of this object with increased resolution hold the promise of detecting stable orbits within 6.
While line profiles should be fit explicitly to determine model parameters, we have demonstrated (§3.1) that the three lowest moments of the profiles can provide a discriminating measure of confidence in broad classes of disk models. Specifically, the mean, standard deviation, and skewness of a normalized profile defines a point in a 3D moment space and the position of points in this space is sensitive to emission from material below 6. Figure 5 is demonstration that maps in this space may be used effectively to identify frame dragging in a broad context of disk models. Formally, the ASCA data suggest that black hole rotation is roughly three times more likely to be finite than zero.
We must caution that the use of the ASCA data here is for the purposes of example; ideally, more data than were published by Tanaka et al. (1995) should be used to fit the continuum background. Furthermore, Iwasawa et al. (1996) have reported significant temporal variations in the line profile on scales shorter than the 4 day integration time. Nonetheless, these issues do not greatly weaken our conclusions regarding the possibility of detecting a signature of frame dragging in line profiles.
An additional caveat is that we have dealt only with simple idealized systems consisting of a geometrically thin accretion disk emitting in a single atomic line. The thin-disk approximation is certainly good for an accretion disk at a few hundred Schwarzschild radii where many optical lines are produced. However, for the accretion disk at a few , the ratio of disk thickness relative to the radius at a given point may not be negligible. Furthermore, non-Keplerian motion in the line-emitting material may modify the line profile to a certain degree. Electron scattering in the inner part of accretion disk can also change the energy of line-emission photons and hence can broaden the line profile at local emitting frame. However, we do not expect that the line would be distorted beyond recognition by these uncertainties, but there may be further challenges in identifying a signature of the frame dragging effect.
We have presented results from a general purpose null-ray tracing code applied to the problem of emission from an accretion disk. Clearly, we can advance the level of modeling beyond the thin disk approximation. Thus as the resolution of observed X-ray line emission increases in the near future, we will be able to model more sophisticated physics to probe the environments of rotating black holes.
Acknowledgements
We thank Stirling Colgate, Daniel Holz and Paul Wiita for helpful discussions and comments. The criticism and suggestions by the anonymous referee, particularly with regard to quantitative measures of line profiles, are greatly appreciated. We are endebted to John Archibald Wheeler for providing specific improvements to the manuscript and especially for guiding us in the search for astrophysical footprints of gravitomagnetism. This work was supported by US Department of Energy through the LDRD/IP program and by the NASA HPCC program. BCB acknowledges partial support from NSF grant PHY-95-07695. The Cray Supercomputer used in this investigation was provided through funding from the NASA Offices of Space Sciences, Aeronautics, and Mission to Planet Earth.
References
- 1
- 2 Antonucci, R. R. J., Hurt, T., & Agol, E. 1996, ApJ, in press.
- 3 Bao, G. 1992, A&A, 257, 594
- 4 Bardeen, J. M. & Peterson, J. A. 1975, ApJ Lett., 195, L65
- 5 Chakrabarti, S. K., Molteni, D. 1995, MNRAS, 272, 80
- 6 Chakrabarti, S., & Wiita, P. J. 1994, ApJ, 434, 518
- 7 Chen, K., & Halpern, J. P. 1989, ApJ, 344, 115
- 8 Chen, K., Halpern, J. P., & Filippenko, A. V. 1989, ApJ, 339, 742
- 9 Ciufolini, I 1986, Phys. Rev. Lett., 56, 276.
- 10 Eracleous, M., & Halpern, J. P. 1994, ApJS, 90, 1
- 11 Eracleous, M., Halpern, J. P., & Livio, M. 1996, ApJ, 459, 89
- 12 Eracleous, M., Livio, M., Halpern. J. P., & Storchibergmann, T. 1995, ApJ, 438, 610
- 13 Everitt, C. W. F. 1973, in Experimental Gravitation, ed. B. Bertotti (New York: Academic); Van Patten, R. A. & Everitt, C. W. F. 1976, Phys. Rev. Lett., 36, 629
- 14 Fabian, A. C., Nandra, K., Reynolds, C. S., Brandt, W. N., Otani, C., Inouem H., & Iwasawa, K. 1995, MNRAS, 277, L11
- 15 Ferland, G. J., & Rees, M. J. 1988, ApJ, 332, 141
- 16 Habib, S., Holz, D., Kheyfets, A., Matzner, R. A., Miller, W. A. & Tolman, B. W. 1994, Phys. Rev. D, 50, 6068-6079
- 17 Halpern, J. P., Eracleous, M., Filippenko, A. V., & Chen, K. 1995, ApJ, 464, 704.
- 18 Iwasawa, et al. 1996, MNRAS 282, 1038
- 19 Karas, V., Vokrouhlický, D., & Polnarev, A. G. 1992, MNRAS, 259, 569
- 20 Laor, A. 1991, ApJ, 376, 90
- 21 Misner, C. W., Thorne, K. S. & Wheeler, J. A. 1970, Gravitation (San Francisco: W. H. Freeman & Co.).
- 22 Mushotzky R. F., et al. 1995, MNRAS, 272, L9
- 23 Speith, R., Riffert, H., & Ruder, H. 1995, Comp. Phys. Comm., 88, 109
- 24 Sun, W.-H., & Malkan, M. A. 1988, in Supermassive Black Holes, ed. M. Kafatos (Cambridge: Cambridge University Press), p. 273.
- 25 Tanaka, Y. et al. 1995, Nature, 352, 659
- 26 Thirring, H. & Lense, J. 1918, Phys. Z., 19, 156.
- 27 Zakharov, A. F. 1994, MNRAS, 269, 283
- 28 Zheng, W., Veilleux, S., & Grandi, S. A. 1991, ApJ, 381