Microwave Emission at High Galactic Latitudes
A. Kogut111
Hughes STX Corporation, Laboratory for Astronomy and Solar Physics,
Code 685, NASA/GSFC, Greenbelt MD 20771.
2 E-mail: kogut@stars.gsfc.nasa.gov.
3 Current address: Max Planck Institut für Astrophysik,
85740 Garching Bei München, Germany.
4 Laboratory for Astronomy and Solar Physics,
Code 685, NASA/GSFC, Greenbelt MD 20771.
5 On leave from Warsaw University Observatory,
Aleje Ujazdowskie 4, 00-478 Warszawa, Poland.
6 LBL, SSL, & CfPA, Bldg 50-25, University of California,
Berkeley, CA 94720.
7 UCLA Astronomy, PO Box 951562, Los Angeles, CA 90095-1562.
,2,
G. Hinshaw1,
A.J. Banday1,3,
C.L. Bennett4,
K. Górski1,5,
G.F. Smoot6,
and
E.L. Wright7
COBE Preprint 96-02
Submitted to The Astrophysical Journal Letters
January 5, 1996
ABSTRACT
We use the COBE 888 The National Aeronautics and Space Administration/Goddard Space Flight Center (NASA/GSFC) is responsible for the design, development, and operation of the Cosmic Background Explorer (COBE). Scientific guidance is provided by the COBE Science Working Group. GSFC is also responsible for the analysis software and for the production of the mission data sets. Differential Microwave Radiometers (DMR) 4-year sky maps to model Galactic microwave emission at high latitudes (). Cross-correlation of the DMR maps with Galactic template maps detects fluctuations in the high-latitude microwave sky brightness with the angular variation of the DIRBE far-infrared dust maps and a frequency dependence consistent with a superposition of dust and free-free emission. We find no significant correlations between the DMR maps and various synchrotron templates. On the largest angular scales (e.g., quadrupole), Galactic emission is comparable in amplitude to the anisotropy in the cosmic microwave background (CMB). The CMB quadrupole amplitude, after correction for Galactic emission, has amplitude = 10.7 with random uncertainty 3.6 and systematic uncertainty 7.1 from uncertainty in our knowledge of Galactic microwave emission.
Subject headings: cosmic microwave background – cosmology: observations – Galaxy : general – ISM: general
1 Introduction
Diffuse microwave emission at high Galactic latitudes is dominated by the cosmic microwave background and optically thin emission from Galactic synchrotron, dust, and free-free emission. These components may be distinguished by their different spatial morphology and frequency dependence. A number of authors have attempted to separate Galactic and cosmic emission on angular scales above a few degrees (Fixsen, Cheng, & Wilkinson 1983; Lubin et al. 1985; Wright et al. 1991; Bennett et al. 1992; Bensadoun et al. 1993; Gutiérrez de la Cruz et al. 1995; Kogut et al. 1996a). Unfortunately, there is currently no emission component for which both the spatial template and frequency dependence are well determined. Synchrotron radiation dominates radio-frequency surveys, but the spectral index steepens with frequency and has poorly-determined spatial variation (Banday & Wolfendale 1991, Bennett et al. 1992). Dust emission dominates far-infrared surveys, but its spectral behavior at longer wavelengths depends on the shape, composition, and size distribution of the dust grains, which are poorly known (Désert, Boulanger, & Puget 1990). Free-free emission from electron-ion interactions has well-determined spectral behavior but lacks an obvious template map: free-free emission never dominates the high-latitude radio sky, while other tracers of the warm ionized interstellar medium (WIM) such as H emission, pulsar dispersion measure, or NII emission are either incomplete, undersampled, or noise-dominated (Reynolds 1992, Bennett et al. 1992, 1994). At least one component of the WIM is spatially correlated with the far-infrared dust distribution on large angular scales (Kogut et al. 1996a); however, the fraction of the total WIM contained in the correlated component has substantial uncertainties.
The ratio of cosmic to Galactic emission depends on the angular scale and observing frequency. CMB anisotropies have antenna temperature999 Antenna temperature is defined in terms of the power received per unit bandwidth, where is Boltzmann’s constant. It is related to the intensity by .
where and is thermodynamic temperature. The angular power spectrum of CMB anisotropy is well described by a power-law spectrum (Górski et al. 1996), while Galactic emission follows a steeper law (Gautier et al. 1992, Kogut et al. 1996a), where is the spherical harmonic multipole order. Galactic emission reaches a minimum near 60 GHz. In this Letter we derive models of Galactic emission based on Galaxy-dominated sky surveys and the 4-year COBE DMR microwave maps.
2 Techniques
We use three main techniques to identify Galactic emission in the high-latitude portion of the DMR maps, here defined as the region with custom cutouts at Orion and Ophiuchus (Bennett et al. 1996). A “subtraction” method (Bennett et al. 1992) scales Galactic template maps to the DMR frequencies using spectral indices fixed by external observations. A “linear combination” method corrects the DMR maps for synchrotron and dust emission using the subtraction technique, then fits the corrected maps pixel by pixel for the CMB and free-free amplitude (the components whose spatial distribution is least known). A “cross-correlation” method cross-correlates the DMR maps with fixed Galactic template maps without specifying any a priori frequency dependence. Each method has certain deficiencies. The subtraction method suffers from uncertainty in the frequency extrapolation. There are fewer DMR frequencies (3) than microwave emission components (4); consequently, the linear combination method still requires correction for dust and synchrotron emission. The linear combination method identifies signals with a specified frequency dependence, but at the cost of a significant increase in the instrument noise; the increase in noise can be larger than the amplitude of the Galactic emission the technique is designed to identify. The cross-correlation technique removes all emission traced by the given template, regardless of frequency dependence, but does not remove emission uncorrelated with the template.
The cross-correlation technique has been used to identify all three Galactic emission components in the DMR sky maps (Kogut et al. 1996a). We assume that the DMR maps are a superposition of CMB emission and Galactic emission traced by a Galactic template,
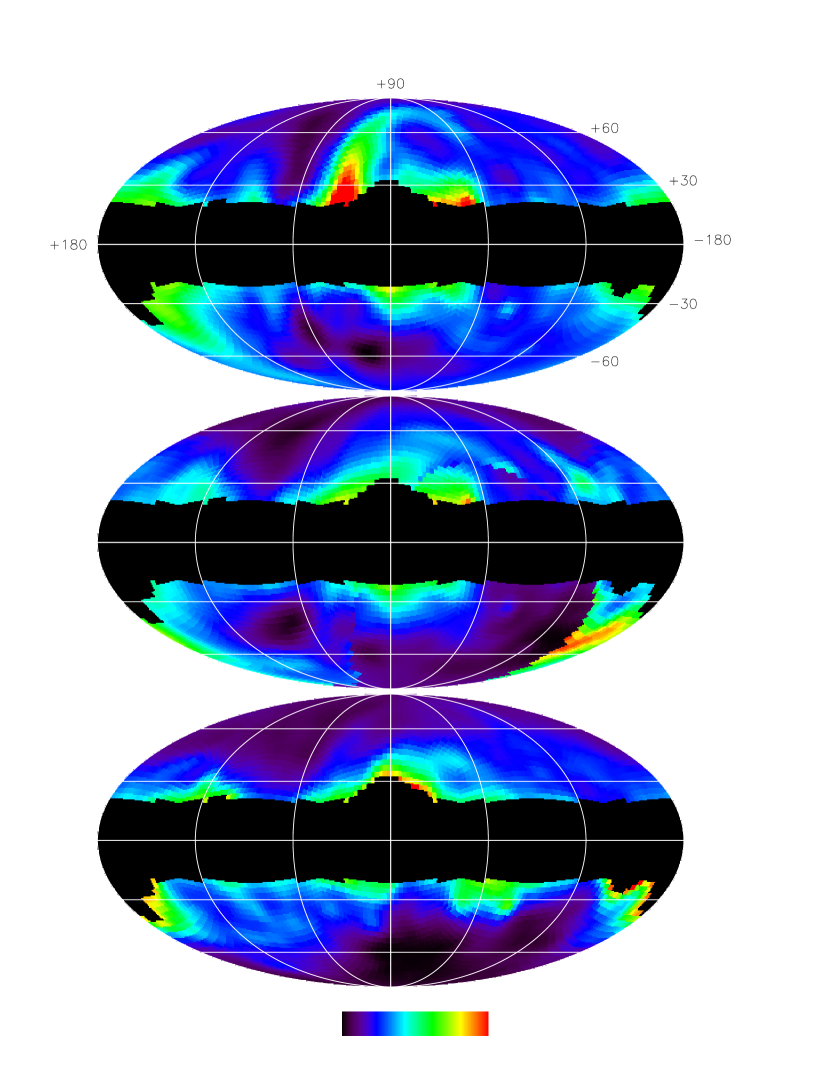
where is the antenna temperature in a DMR map, is the intensity of the Galactic template map (not necessarily in temperature units) and the coefficient converts the units of the Galactic map to antenna temperature at the DMR frequency. Figure 1 shows the templates used in this Letter.
We estimate the correlation coefficient by minimizing
| (1) |
where is a linear function of the DMR map temperatures, is a similar function for the Galactic template map, and is the covariance matrix of the function . We use three linear functions in equation 1: the 2-point cross-correlation (Kogut et al. 1996a), the temperature in each map pixel (Hinshaw et al. 1996), or Fourier components in an orthogonal basis (Górski et al. 1996) and obtain good agreement between the methods.
Uncertainties in the coefficients are dominated by chance alignment of the CMB anisotropy with features in the template maps. Since the relative orientation of the CMB and Galactic template is unchanged with frequency, we may reduce the effects of chance alignment by simultaneously fitting a Galactic template to all three DMR frequencies, and requiring that the CMB pattern be invariant in thermodynamic units. Equation 1 is easily generalized to fit multiple DMR frequencies and template maps simultaneously.
3 Galactic Microwave Emission
Bennett et al. (1992) review several models of synchrotron emission based on radio surveys at 408 MHz (Haslam et al. 1981) and 1420 MHz (Reich & Reich 1988). The simplest model uses the 408 MHz survey scaled to higher frequencies using a spatially invariant spectral index . A more realistic model uses the 1420 and 408 MHz surveys to trace spatial variation in and accounts for the steepening synchrotron spectrum at higher frequencies using local measurements of the cosmic-ray electron energy spectrum. Both models have deficiencies and it is possible that neither template accurately reflects the distribution of synchrotron emission at millimeter wavelengths, regardless of overall normalization. The large-scale structure in the 408 MHz survey at is dominated by the North Polar Spur (Loop I), but this region has steeper spectral index and becomes increasingly less important at higher frequencies. (Lawson et al. 1987). The cosmic-ray model accounts for both the spatial variation in and the steepening of the spectrum at higher frequencies, but the spatial structure of this model at the DMR frequencies is dominated by regions of flattened index at the southern declination limits of the 1420 MHz survey. The DMR maps show no evidence for such bright regions, suggestive instead of sidelobe pickup in the 1420 MHz survey.
We obtain an upper limit to synchrotron emission traced by either template by comparing the synchrotron templates to the DMR 4-year sky maps. We convolve the templates with the DMR beam profile, combine the A and B channels at each DMR frequency to form the (A+B)/2 sum, excise the Galactic plane, and cross-correlate each synchrotron template with the DMR 31.5, 53, and 90 GHz maps. Table 1 shows the fitted correlation coefficients for the two synchrotron templates derived using Eq. 1 in a maximum-likelihood analysis with the “brute-force” pixel basis (Hinshaw et al. 1996). We evaluate the three DMR frequencies simultaneously, , and account for possible cross-talk between the synchrotron and far-IR templates by fitting both templates simultaneously. The uncertainties in Table 1 include the errors from instrument noise, chance alignments, and cross-talk with the far-IR template. We find no statistically significant correlation between the DMR sky maps and either the 408 MHz survey or the cosmic-ray synchrotron model. Table 2 shows the rms fluctuations in antenna temperature corresponding to the fitted coefficients. We adopt an upper limit (95% confidence) at 31.5 GHz for emission traced by either synchrotron template.
We also fit the DMR maps to the far-infrared dust emission traced by the DIRBE 140 map, from which a model of zodiacal dust emission has been removed (Reach et al. 1995). Tables 1 and 2 show a statistically significant correlation between the DMR maps and the DIRBE 140 map; we obtain nearly identical results using the DIRBE maps at 100 or 240 . The frequency dependence of the inferred signal in the DMR maps is well described by a superposition of dust and free-free emission: between 31.5 and 53 GHz, and between 53 and 90 GHz. We fit the rms DMR and DIRBE signals to emission models of the form , i.e., a model with a single dust population with enhanced submillimeter emissivity plus free-free emission. The best fit occurs for dust temperature K and emissivity , with opacity (68% confidence).
Table 3 shows the rms amplitude of the inferred dust and free-free signals, including the quadrupole, in the high-latitude portion of the DMR maps. Note that the DMR 53 and 90 GHz channels have nearly equal Galactic emission from spatially correlated dust and free-free emission. The amplitude of this emission, however, is small compared to the rms CMB anisotropy (Banday et al. 1996). The correlation technique, however, is insensitive to free-free emission whose spatial distribution is uncorrelated with the Galactic template maps. We place upper limits on the amplitude of the uncorrelated component by analyzing a linear combination of the DMR maps designed to be sensitive to free-free emission (spectral index -2.15 in units of antenna temperature), cancel emission with a CMB spectrum, and minimize instrument noise:
| (2) |
where is the antenna temperature in each DMR channel after subtracting synchrotron and dust emission using the cosmic-ray and DIRBE models, respectively. We smooth the maps with a 7∘ FWHM Gaussian to further reduce the effects of noise, remove a fitted monopole and dipole, and compare the variance of the (A+B)/2 sum map to the (A-B)/2 difference map. We obtain an estimate for the fluctuations in free-free antenna temperature at 53 GHz from all sources, . This value compares well with the correlated component at the same effective smoothing, .
We test for free-free emission uncorrelated with the far-IR dust by removing the correlated free-free component from each DMR channel prior to forming the free-free linear combination (Eq. 2). A power spectrum analysis of this uncorrelated free-free map shows no statistically significant signal at any . The correlated component must form at least 1/3 of the total free-free emission (95% confidence) and may form the bulk of this emission.
4 Quadrupole
The quadrupole in Galactic coordinates is defined by five components ,
| (3) | |||||
with rms amplitude
Note that refers to the rms amplitude of the observed quadrupole in the sky, while is a model parameter giving the CMB power spectrum normalization; the two are equivalent only in an ensemble average over many Hubble volumes.
The quadrupole represents one order of a spherical harmonic expansion of the temperature distribution in the sky maps. After the low-latitude portion of the sky map is excised, the spherical harmonic functions are no longer orthogonal on the remaining sky pixels, allowing power from higher orders to be aliased into the quadrupole (and vice versa). Górski et al. (1996) address this problem by constructing a new set of basis functions orthogonal on the cut sky. In what follows, we retain the more familiar quadrupole basis and minimize aliasing by including a theoretical model for the higher orders () of the power spectrum. We derive the quadrupole parameters by minimizing
| (4) |
in a pixel-based maximum-likelihood analysis, where are the quadrupole basis functions from Eq. 3 and the covariance matrix is defined for a scale-invariant CMB model (cf. Eq. 1 of Hinshaw et al. 1996). That is, we describe the high-latitude sky as a fixed quadrupole pattern plus a statistical distribution of higher-order power given by a Harrison-Zel’dovich power spectrum. Table 4 shows the quadrupole parameters fitted to the high-latitude portion of the (A+B)/2 sky maps, without Galactic correction. The quadrupole parameters for the Galactic template maps are also shown. The in Table 4 are for a single Galactic cut. We have repeated the analysis for a variety of cut angles. Not unexpectedly, the fitted values show a strong dependence on latitude : the Galaxy is a strong quadrupolar source (see, e.g., Table 2 of Bennett et al. 1992).
We derive the CMB quadrupole parameters as follows. We correct each DMR map for the second-order Doppler quadrupole thermodynamic temperature caused by the motion of the solar system with respect to the CMB rest frame. We remove Galactic emission using the synchrotron and DIRBE templates by adding terms to Eq. 4 of the form and fitting the three DMR frequencies simultaneously. Rather than fitting the synchrotron and DIRBE templates to each map independently, we use the results of §3 and fit the templates to all three frequencies simultaneously, specifying the spectral behavior via the spectral indices. The free parameters in the fit are thus the synchrotron, dust, and free-free amplitude coefficients plus 5 CMB quadrupole parameters. Using the nominal values and , we derive correlation coefficients , , and antenna temperature at 53 GHz. Table 5 shows the quadrupole parameters for the corrected CMB map. The uncertainties are dominated by aliasing of higher-order power and to a lesser extent by instrument noise and chance alignments in the template map correlation.
The statistical uncertainties in Table 5 do not include the systematic effects associated with the choice of template map and spectral index. We evaluate the uncertainties associated with the Galactic spectral indices by repeating the analysis as is varied over the range [-2.8, -3.3] and over the range [1.1, 2.0]. The differences are small, typically 10% of the statistical uncertainty.
We estimate the uncertainties associated with the Galactic model techniques by repeating the CMB quadrupole analysis for several different Galactic models. The simplest change is to substitute the cosmic-ray synchrotron template for the 408 MHz survey. Synchrotron emission is faint at millimeter wavelengths, and both templates have similar quadrupoles: the estimated CMB quadrupole does not depend sensitively on the choice of synchrotron template or spectral index. Similarly, we may estimate the dust emission by fitting the DIRBE dust emission or scaling the FIRAS dust model (Wright et al. 1991). Differences between these techniques are small and are dominated by differences in the FIRAS and DMR beam shape.
We estimate the systematic uncertainty in the free-free correction by comparing the quadrupole results using the DMR/DIRBE cross-correlation to the results using the linear combination technique. For the latter analysis, we correct the DMR channel maps for dust and synchrotron emission and form a weighted CMB map using weights -0.195, -0.115, +0.394, +0.286, +0.313, and +0.507 for antenna temperature in channels 31A, 31B, 53A, 53B, 90A, and 90B, respectively. This linear combination cancels free-free emission (spectral index -2.15) with maximal instrument sensitivity, although the resulting noise is still 35% larger than the noise using the cross-correlation technique. We then fit for the CMB quadrupole using Eq. 4, replacing with the linear combination CMB map. The results are in agreement with the less noisy cross-correlation technique (Table 5). Systematic effects associated with changing the Galactic model are typically 1–5 , smaller than the statistical uncertainties.
The largest systematic effect is the choice of Galactic cut angle. Table 5 shows the quadrupole parameters fitted for the regions , with custom cutouts, and . The changes in the fitted parameters as the Galactic cut is varied are comparable to the statistical uncertainties, and limit our ability to estimate the CMB quadrupole. Since statistically significant CMB features exist in the region , the change in fitted quadrupole parameters as the Galactic cut is varied reflects aliasing of higher-order power as well as potential shortcomings in the Galactic models. We estimate the uncertainty from this effect as half of the spread in each quadrupole component. The bottom row of Table 5 shows the combined systematic uncertainty in each component, given by the quadrature sum of the separate uncertainties in spectral index, model techniques, Galactic cut, and the instrument systematic artifacts (Kogut et al. 1996b).
The rms quadrupole amplitude, , provides a convenient description of the CMB quadrupole. Since it is quadratic in the map temperatures, both instrument noise and aliasing will bias toward higher values (the individual parameters are unbiased estimators, but provide a less concise characterization). We correct for the bias by the quadrature subtraction of the rms statistical uncertainty: , where are the central values of the fitted quadrupole components, are the statistical uncertainties, and are the weights [, 1, 1, 1, 1] (Gould 1993). Column 6 of Table 5 (labelled ) shows this de-biased estimate for the CMB rms quadrupole amplitude.
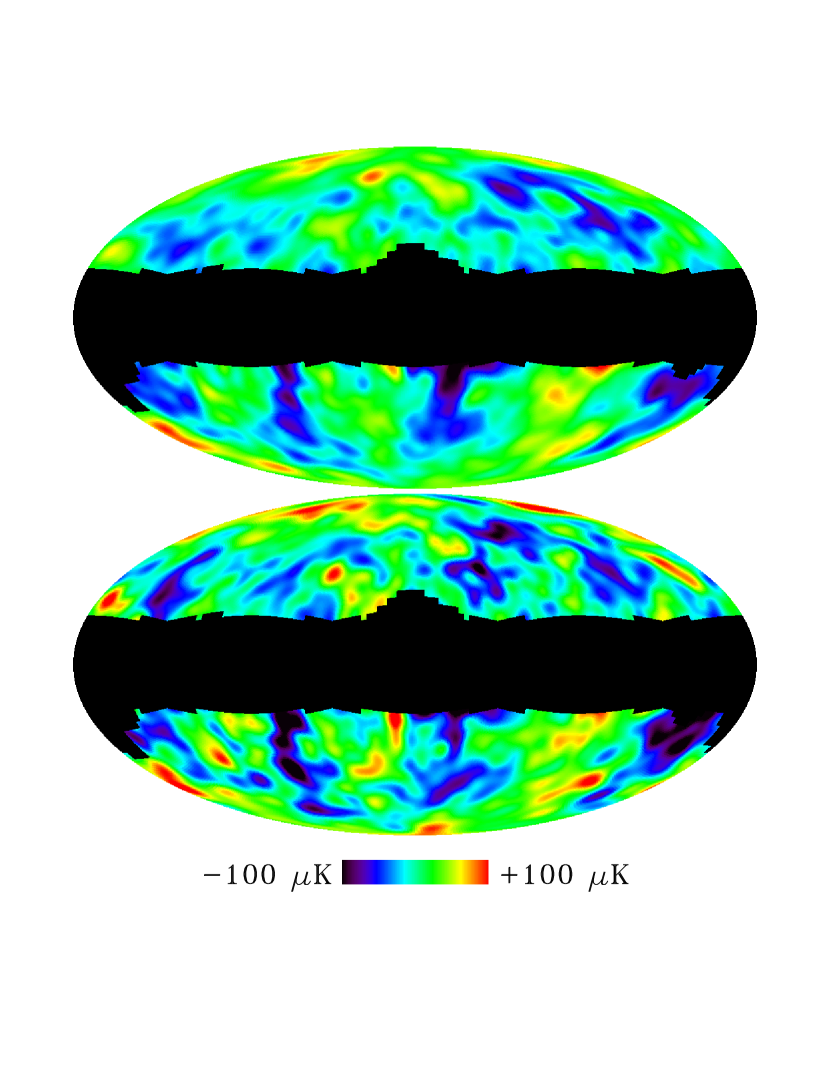
Figure 2 shows the CMB maps from the cross-correlation and linear combination techniques. Since the cross-correlation technique has the smallest random errors, we adopt the CMB quadrupole parameters from this model using the custom Galactic cut as a compromise between sky coverage and Galactic foreground emission. The resulting estimate of the CMB quadrupole amplitude is , where errors represent the statistical and systematic uncertainties, respectively. Allowing for the systematic uncertainty in the Galactic correction, the CMB quadrupole amplitude lies in the range [4, 28] at 95% confidence.
5 Conclusions
We use the DMR 4-year sky maps and Galaxy-dominated sky surveys to derive models of high-latitude Galactic and cosmic emission. Cross-correlation of the DMR maps with either the 408 MHz synchrotron survey or a cosmic-ray synchrotron model with spatially varying spectral index yield upper limits to fluctuations in synchrotron emission traced by either template, at 31.5 GHz. If either template correctly reproduces the angular distribution of synchrotron emission, the amplitude normalization requires a mean spectral index between 408 MHz and 31.5 GHz of .
Cross-correlation of the DMR maps with the dust-dominated DIRBE 140 survey shows a statistically significant signal whose dependence on DMR frequency is consistent with a superposition of dust and free-free emission. The rms amplitude of the dust signal is antenna temperature at 53 GHz, including the contribution from the quadrupolar component. The dust emission may be used to place a lower limit to enhanced emissivity from 140 m to 6 mm wavelenth: at 95% confidence.
We detect a component of the free-free emission from the warm ionized interstellar medium that is correlated with the far-infrared dust on angular scales of 7∘ or larger. The amplitude of the correlated free-free emission, , compares well with the total free-free emission from all sources, derived from a linear combination of the DMR maps. The correlated component must form at least 1/3 of the total free-free emission (95% confidence) and may form the bulk of this emission.
Galactic emission is comparable to the CMB on quadrupolar scales and is counter-aligned to the CMB in several of the 5 components. The fitted quadrupole in the uncorrected DMR maps is not representative of the CMB quadrupole in either amplitude or phase. Analysis of the DMR maps that includes the quadrupole anisotropy should correct for Galactic emission, using either the cross-correlation technique or the noisier linear combination technique. We correct the DMR channel maps for Galactic emission using both techniques and estimate the quadrupole components using a maximum likelihood analysis. The random statistical uncertainties are dominated by the aliasing of power from higher multipole orders. After correction for the positive bias from noise and aliasing, the CMB quadrupole amplitude observed at high latitude is , where the uncertainties represent the random statistical errors and systematic modelling errors, respectively.
We are grateful to Charley Lineweaver for helpful discussion. We acknowledge the dedicated efforts of the many people responsible for the COBE DMR data: the NASA office of Space Sciences, the COBE flight team, and all of those who helped process and analyze the data.
| DMR Frequency | Galactic Template | ||
|---|---|---|---|
| (GHz) | 408 MHzb | Cosmic-Rayc | DIRBE 140 d |
| 31.5 | 1.17 1.13 | 1.88 1.24 | 6.37 1.52 |
| 53 | 0.69 0.77 | 0.88 0.81 | 2.69 1.06 |
| 90 | -0.14 0.74 | 0.43 2.55 | 2.79 1.01 |
a The antenna temperature at each DMR frequency
of Galactic emission traced by template map X
is .
Results are quoted for
with custom cutouts at Orion and Ophiuchus (see text).
has units K-1 since the template map has units K.
is dimensionless since the template map has units .
has units (MJy/sr)-1 since the template map
has units MJy sr-1.
| DMR Frequency | Galactic Template | ||
|---|---|---|---|
| (GHz) | 408 MHz | Cosmic-Ray | DIRBE 140 |
| 31.5 | 5.7 5.5 | 8.4 5.5 | 22.7 5.4 |
| 53 | 3.4 3.7 | 3.9 3.6 | 9.6 3.8 |
| 90 | -0.7 3.6 | 1.9 3.5 | 10.0 3.6 |
a Units are antenna temperature. The quadrupole has not been subtracted.
Results are quoted for
with custom cutouts at Orion and Ophiuchus.
| DMR Frequency | rms Free-Free | rms Dust |
|---|---|---|
| (GHz) | () | () |
| 31.5 | 21.7 5.2 | 0.9 0.4 |
| 53 | 7.1 1.7 | 2.7 1.3 |
| 90 | 2.3 0.5 | 7.6 3.6 |
a Results are quoted for
with custom cutouts at Orion and Ophiuchus.
| Map | ||||||
|---|---|---|---|---|---|---|
| DMR 31.5 GHzc | -29.1 12.6 | 27.0 6.5 | 2.1 6.0 | 4.5 12.8 | 5.3 11.9 | 15.6 5.4 |
| DMR 53 GHzc | -13.6 7.7 | 9.5 2.7 | 3.8 2.2 | 0.0 8.2 | 3.5 7.6 | 4.4 3.3 |
| DMR 90 GHzc | 0.2 8.5 | 5.0 3.5 | 6.7 2.8 | -0.3 9.1 | 3.2 8.3 | 0.0 3.0 |
| 408 MHzd | -6.6 | 3.4 | -0.1 | 5.5 | -1.8 | 4.5 |
| Cosmic-raye | -5.2 | 2.7 | -1.3 | 5.9 | -1.3 | 4.2 |
| DIRBE 140 f | -6.6 | 1.7 | -1.3 | 1.9 | -1.4 | 3.4 |
a All results for high-latitude sky, with
custom cutouts at Orion and Ophiuchus. The Doppler quadrupole
has been removed from the DMR maps.
b has been corrected for statistical bias (see text).
c Map units are thermodynamic temperature.
d Map units are K antenna temperature.
e Map units are antenna temperature.
f Map units are MJy sr-1.
| Cross-Correlation | |||||
| 27.9 4.7 | 0.6 1.7 | 10.8 1.6 | -14.9 4.9 | 19.0 4.6 | 18.0 2.3 |
| 19.0 7.4 | 2.1 2.5 | 8.9 2.0 | -10.4 8.0 | 11.7 7.3 | 10.7 3.6 |
| 31.2 12.5 | 1.0 3.7 | 12.8 3.7 | -9.3 13.4 | -0.6 12.1 | 11.7 5.8 |
| Linear Combination | |||||
| 24.3 6.2 | -2.1 3.1 | 8.3 2.9 | -18.9 6.2 | 6.8 6.0 | 14.6 3.1 |
| 20.0 9.1 | -2.6 3.9 | 9.4 3.3 | -6.1 9.6 | 3.5 8.8 | 7.1 4.2 |
| 35.1 14.3 | -3.2 4.9 | 12.7 4.8 | -7.1 15.4 | 6.6 13.8 | 12.2 6.8 |
| Systematic and Model Uncertainties | |||||
| 8.2 | 2.7 | 2.5 | 4.3 | 10.4 | 7.1 |
a The three rows for each technique refer to Galactic cut
, with custom cutouts, and .
The Doppler quadrupole has been removed from the maps.
Results are in thermodynamic temperature.
b has been corrected for statistical bias (see text).
References
Banday, A. & Wolfendale, A.W. 1991, MNRAS, 248, 705
—, et al. 1996, ApJ Letters, in preparation
Bennett, C.L., et al. 1992, ApJ, 396, L7
—, et al. 1994, ApJ, 434, 587
—, et al. 1996, ApJ Letters, submitted
Bensadoun, M., Bersanelli, M., De Amici, G., Kogut, A., Levin, S.M., Limon, M., Smoot, G.F., & Witebsky, C. 1993, ApJ, 409, 1
Désert, F.-X., Boulanger, F., & Puget, J.-L. 1990, A&A, 327, 215
Fixsen, D.J., Cheng, E.S., & Wilkinson, D.T. 1983, PRL, 50, 620
Gautier, T.N., Boulanger, F., Pérault, M., & Puget, J.L. 1992, AJ, 103, 1313
Górski, K.M., Banday, A.J., Bennett, C.L., Hinshaw, G., Kogut, A., Smoot, G.F., & Wright, E.L. 1996, ApJ Letters, submitted 1996, ApJ Letters, submitted
Gould, A. 1993, ApJ, 403, L51
Gutiérrez de la Cruz, C.M., Davies, R.D., Rebolo, R., Watson, R.A., Hancock, S., & Lasenby, A.N. 1995, ApJ, 442, 10
Haslam, C.G.T, Klein, U., Salter, C.J., Stoffel, H, Wilson, W.E., Cleary, M.N., Cooke, D.J., & Thomasson, P. 1981, A&A, 100, 209
Hinshaw, G., Banday, A.J., Bennett, C.L., Górski, K.M., Kogut, A., Smoot, G.F., & Wright, E.L. 1996, ApJ Letters, submitted
Kogut, A., Banday, A.J., Bennett, C.L., Górski, K.M., Hinshaw, G., & Reach, W.T. 1996a, ApJ, 460, in press
—, et al. 1996b, ApJ, submitted
Lawson, K.D., Mayer, C.J., Osborne, J.L, & Parkinson, M.L. 1987, MNRAS, 225, 307
Lubin, P., Villela, T., Epstein, G., & Smoot, G. 1985, ApJ, 298, L1
Reach, W.T., Franz, B.A., Kelsall, T., & Weiland, J.L. 1995, Unveiling the Cosmic Infrared Background, ed. E. Dwek, (New York:AIP)
Reich, P., & Reich, W. 1988, A&AS, 74, 7
Reynolds, R.J. 1992, ApJ, 392, L35
Wright, E.L., et al. 1991, ApJ, 381, 200