Abstract
Because Type Ia supernovae (SNe Ia) are not perfect standard candles, it is important to be able to use distance–independent observables (DIOs) to define subsets of SNe Ia that are “nearly standard candles” or to correct SN Ia absolute magnitudes to make them nearly homogeneous (“standardized candles”). This is not crucial for the measurement of , but it is for the measurement of and of parent–galaxy peculiar velocities. We discuss the use of various photometric and spectroscopic SN Ia DIOs, and a parent–galaxy DIO, for this purpose. We also discuss the status of the absolute–magnitude calibration of SNe Ia. We find that SNe Ia, whether calibrated by means of (1) Cepheids in their parent galaxies, (2) fitting their optical–ultraviolet spectra with detailed non-LTE model atmosphere calculations, or (3) by considering that the light curve is powered by the decay of radioactive 56Ni, firmly indicate that the value of is low, less than or about 60 . Some issues regarding the determination of by means of SNe Ia are discussed briefly. Finally, we conjecture that even if =0.5, there probably is no cosmic age problem.
1 Introduction
Interest in using Type Ia supernovae (SNe Ia) as extragalactic distance indicators has increased in recent years, as important new data have been obtained and as our understanding of the basic physics of SNe Ia has improved. SNe Ia are bright enough to be observed to cosmologically significant distances, the distribution of their absolute magnitudes at maximum light is sharply peaked, and the absolute magnitudes can be calibrated in several independent ways.
SNe Ia are not perfect standard candles. In principle, this poses no obstacle for the determination of , because given appropriate observational data for an individual SN Ia out in the Hubble flow, physical modeling can be applied to determine the absolute magnitude, the distance, and the value of , without any appeal to absolute-magnitude homogeneity. In practice, however, most of the work that has been done so far on from SNe Ia has involved some matching of the absolute magnitudes of SNe Ia out in the Hubble flow to those of nearer SNe Ia whose absolute magnitudes have been calibrated either by physical modeling or by means of Cepheid variables in their parent galaxies. Matching of remote and nearer SNe Ia will continue to be required for applications that in practice must remain statistical in nature - determining the value of and measuring galaxy peculiar velocities.
It can be helpful to keep these matters in quantitative perspective. The difference between and , expressed in magnitudes, is mag. Thus, making a useful measurement of from SNe Ia is not a delicate matter, because it is easy to define subsamples of SNe Ia whose absolute-magnitude dispersions are much less than that. The issue is the absolute-magnitude calibration. We will argue below that SNe Ia firmly indicate that the value of is low, less than or about 60 .
Using high-redshift SNe Ia to determine the value of is a delicate matter. The absolute-magnitude calibration doesn’t enter, but at the difference between and is only about 0.2 magnitudes. Therefore measuring to an accuracy of 0.1 requires matching the magnitudes of remote SNe Ia, relative to nearer ones, to within about 0.05 magnitudes. Obtaining this kind of accuracy requires a statistical approach, i.e., beating down the uncertainty by using a sample of remote SNe Ia. The determination of galaxy peculiar velocities is, of course, an inherently statistical problem because the goal is not to measure a single number but to measure enough peculiar velocities to map cosmic flows.
What we must do, then, is to use one or more distance-independent-observables (DIOs) either (1) to define a subset of SNe Ia whose absolute magnitudes are sufficiently homogeneous (“nearly standard candles”), or (2) to correct the absolute magnitudes of all or of a subset of SNe Ia to make them sufficiently homogeneous (“standardized candles”). An already well known example of the second procedure is to use a light-curve decline rate, or shape, or width, as the DIO. This is just the same as using the periods of Cepheid variables as DIOs to standardize their absolute magnitudes.
In section 2, we consider the potential use of various photometric and spectroscopic SN Ia DIOs, as well as a parent-galaxy DIO. Absolute-magnitude calibrations and the value of are discussed in section 3. A few comments concerning the use of SNe Ia for measuring are made in section 4, and some summary comments appear in section 5.
2 SNe Ia AS NEARLY STANDARD, OR STANDARDIZED, CANDLES
In this section we consider ways to define subsets of nearly standard candles, or of standardized candles. The approach here is purely empirical, with matters of physical interpretation being deferred to section 3.
2.1 The SN Ia Absolute-Magnitude Distribution
The distributions of the blue and visual absolute magnitudes of SNe Ia in the current observational sample have been studied by Vaughan et al. (1995a, 1995b), using Tully-Fisher, SBF, and Hubble-law distances (the latter with to be consistent with the TF and SBF distance scales). The distributions are strongly peaked near “normal” or “ridge-line” absolute magnitudes (ridge line refers to plots of magnitude versus distance) of . In addition to the ridge line SNe Ia, there are some SNe Ia that are dimmer because they are extinguished by dust in their parent galaxies, and some that are intrinsically dim. Vaughan et al. (1995a) showed that it is possible to make an objective definition of the “ridge line”, based on the mode of the distribution, that does not appeal to any DIO. (The remarks of Hamuy et al. (1995a) concerning the non-objectivity of this definition reveal a misreading of the definition.) This mode-based definition was found to isolate a ridge-line subsample of SNe Ia that has observational dispersions mag; considering the errors, the intrinsic dispersions, and , were judged to be less than 0.2 mag. Vaughan et al. (1995b) incorporate the new data of Hamuy et al. (1995a), make more stringent criteria for inclusion in the sample, and define a ridge line in terms of a “binless mode”, to find dispersions mag; again the intrinsic dispersions are judged to be no more than 0.2 mag. Thus, ridge-line SNe Ia are nearly standard candles.
An important feature of the SN Ia absolute-magnitude distribution is that it declines steeply on its bright side (Vaughan et al. 1995b). So far, only the spectroscopically peculiar SN 1991T, after correction for extinction in its parent galaxy, was a substantially overluminous event. This steepness on the bright side of the luminosity function means that the effects of observational selection bias in favor of bright events at large distances will not be severe. Still, to the extent that overluminous SNe Ia do exist, and that observational bias does occur, SNe Ia that get into remote samples may tend to be more luminous than nearer ones, in which case using the ridge-line for direct matching of the two samples will tend to underestimate the distances of the remote events and overestimate the values of both and . Thus we turn our attention to the use of DIOs to correct for whatever systematic differences there may be between remote and nearer SNe Ia.
2.2 Photometric SN Ia DIOs
Vaughan et al. (1995a,b) use the B-V color at maximum light as a DIO to define a subset of nearly standard candles. B-V is available for most of the well observed SNe Ia, and it has the attractive feature of automatically excluding those that are substantially extinguished. Vaughan et al. (1995a) used the criterion to define a subset of normal-color SNe Ia having mag., and intrinsic dispersions of no more than 0.2 mag. For the more stringently defined sample of Vaughan et al. (1995b), the criterion is used to define subsets of normal-color SNe Ia again having observational dispersions less than 0.3 mag, and intrinsic dispersions less than 0.2 mag. Thus, SNe Ia that have normal B–V colors are nearly standard candles.
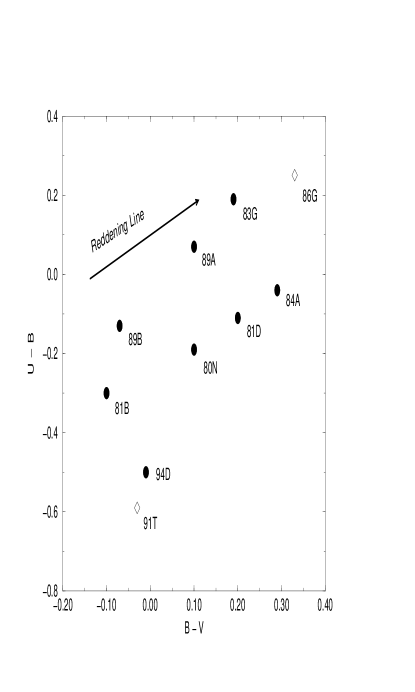
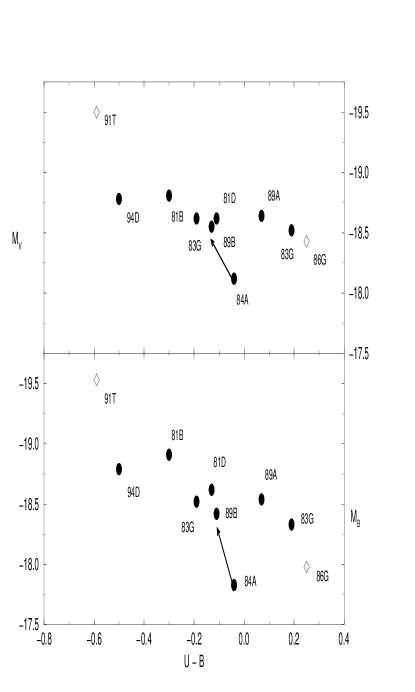
The color at maximum light also automatically identifies highly extinguished SNe Ia, and it is likely to be a more sensitive indicator of absolute magnitude than is . Schaefer (1995a) critically discusses what little data is available so far, and presents a versus diagram. The one presented here as Fig. 1 is restricted to only the “good” SN Ia data assembled by Schaefer, plus a recent measurement for SN 1994D (Patat et al. 1995; Meikle et al. 1995; Richmond et al. 1995). In this and subsequent figures, SNe 1986G, 1981B, 1989B, and 1991T have been corrected for the total extinction as estimated by Hamuy et al. (1995b), while the others have been corrected only for foreground extinction following Burstein & Heiles (1988). A few of the latter, such as SN 1984A, also may have been substantially extinguished in their parent galaxies. In Fig. 1, most of the SNe Ia can be regarded to form a sequence parallel to the reddening line. A reason to think that this is mainly a sequence of intrinsic SN Ia properties, rather than just due to extinction, is found in Fig. 2, which shows that with the exception of SN 1994D, correlates well with , which is not sensitive to extinction. Note that the spectroscopically peculiar SN 1991T had a very negative , i.e., it was anomalously bright in the band. The other event having a very negative value of is SN 1994D, which was a spectroscopically normal SN Ia on the system of Branch, Fisher, & Nugent (1993), but overluminous for its relatively rapid decline rate (Richmond et al. 1995; Patat et al. 1995). A reason to think that the overluminosity of SN 1994D for its decline rate is genuine, rather than due to an erroneously long (relative) SBF distance for its parent galaxy, is that its (distance-independent) was so unusual. and are plotted against in Fig. 3. Because appears to correlate well with absolute magnitude, it may prove to be useful for defining nearly standard candles or even standardized candles. The magnitude is, however, awkward to measure from the ground. The main importance of may be for high-redshift SNe Ia, where measurements at longer wavelengths can probe the rest frame wavelengths of the band.

The other photometric DIOs that have been used recently are based on the light–curve shape: the parameter of Phillips (1993) and Hamuy et al. (1995a); the light-curve-shape (LCS) analysis of Riess, Press, and Kirshner (1995a); or the LBL light–curve stretch factor (Perlmutter et al. 1995b). Both the and LCS approaches are said to be capable of standardizing absolute magnitudes to within dispersions of about 0.1 mag. As mentioned above, the well observed SN 1994D appears not to conform to the expectations of the and LCS techniques, having been too bright for its light-curve decline rate. Light-curve-shape DIOs necessarily require data at phases other than maximum light, and neither the approach nor the original version of LCS automatically handle highly extinguished supernovae. The LCS approach is now being extended to include colors to solve simultaneously for the extinction (Riess 1995).
2.3 Spectroscopic SN Ia DIOs
A simple spectroscopic DIO would be “normalcy”, as defined, for example, by Branch et al. (1993). Both intrinsically dim events such as SNe 1991bg, 1986G, and 1992K, and the overluminous SN 1991T, are not spectroscopically normal. An advantage of this DIO is that the spectrum does not need to be obtained at any particular phase, as long as it is early enough to exclude SNe Ia like 1991T, i.e., not later than about two weeks after maximum light. A potential disadvantage is the non-quantitative definition of “normal” and the consequent ambiguity for intermediate cases, if such exist.
The velocity of the red edge of the blueshifted Ca II H&K absorption blend in moderately late time spectra, , correlates with absolute magnitude (Fisher et al. 1995). Because of the limited number of events for which is available, it is not yet clear whether should be used only to define nearly standard candle subsets, or whether it can also be used to provide standardized candles. A disadvantage of , especially for high-redshift SNe Ia, is that it is based on observations more than 50 days after maximum light. The main importance of probably has to do with its implications for the explosion physics rather than for distance determinations.
Wells et al. (1994) showed, for a small sample of SNe Ia, that the blueshift of the absorption minimum of the Ca II H&K blend at maximum light, , correlates with the parameter. We have verified that, as would then be expected, also correlates with absolute magnitude. Unfortunately, near maximum light varies strongly with phase.
Nugent et al. (1995c) show that in maximum-light spectra, the ratio of the fractional depths of the Si II absorption features near 5800 and 6150 Å , and the ratio of the fluxes of the emission peaks redward and blueward of the Ca II H&K absorption blend, both correlate with absolute magnitude. Studies of the phase dependence of and are underway; preliminary indications are that near maximum light , at least, does not vary rapidly with phase.
2.4 A Parent-Galaxy DIO
Branch, Romanishin, & Baron (1995a; here BRB95) argue that there are convincing connections between the statistical properties of SNe Ia and the colors of their parent galaxies. The blueshift of the Si II absorption near 6150 Å in spectra ten days after maximum light (Branch & van den Bergh 1993) shows a larger dispersion among SNe Ia in red galaxies than among those in blue galaxies, and red galaxies produce SNe Ia having both the lowest and the highest Si II blueshifts. The parameter tends to be larger (faster light-curve decline) in SNe Ia in red galaxies than in SNe Ia in blue galaxies. And SNe Ia in red galaxies tend to be dimmer than SNe Ia in blue galaxies. Even when spectroscopically peculiar SNe Ia, which include the subluminous SNe 1986G, 1991bg, and 1992K in red galaxies and the overluminous SN 1991T in a moderately blue galaxy, are disregarded, the remaining, normal SNe Ia in red galaxies tend to be about 0.3 mag dimmer than those in blue galaxies. The observational dispersions of SNe Ia in blue and red galaxies, considered separately, are only . Thus, spectroscopically normal SNe Ia in red galaxies and, separately, spectroscopically normal SNe Ia in blue galaxies, are very nearly standard candles.
3 Absolute-Magnitude Calibration and the Value of
3.1 Cepheid Calibrations
Cepheid-based absolute-magnitude calibrations have been reported for SNe 1937C (Sandage et al. 1992, Saha et al. 1994), SNe 1972E and 1895B (Sandage et al. 1994; Saha et al. 1995a), and SN 1981B (Saha et al. 1995b), and preliminary results have been released for SN 1960F (Sandage 1995, Saha 1995). Four of these SNe Ia were spectroscopically normal (Branch et al. 1993) and the single spectrum that is available for the fifth, SN 1895B (Schaefer 1995b), is consistent with normalcy. In addition, as discussed by BRB95, the Cepheid-based distance to M96 measured by Tanvir et al. (1995) appears to have effectively measured the distance to a fellow member of the Leo Spur (Tully 1987), NGC 3627, and its spectroscopically normal SN 1989B. The dispersions of the Cepheid-calibrated absolute magnitudes of these six SNe Ia (all in blue galaxies) are very small (, ; BRB95).111NGC 4536, 4496, and 4527, the parent galaxies of SNe 1981B, 1960F, and 1991T, are thought to be members of the same group of galaxies in the foreground of the Virgo cluster (e.g., Tully 1988), and the Tully-Fisher distance moduli to NGC 4536 and 4527 listed by Pierce (1995), 30.50.3 and 30.60.3, are in agreement within the uncertainties. (NGC 4496 is too mildly inclined for a good Tully-Fisher distance determination.) Thus, it appears that by measuring Cepheid-based distances to NGC 4536 and 4496, Saha et al. have indirectly measured the distance to NGC 4527 and its SN 1991T. This event was, however, spectroscopically peculiar in a way that, so far, is singular. The extreme brightness of SN 1991T (after correction for extinction) raises interesting questions about its explosion mechanism and its stellar progenitor, but because SN 1991T is so unusual we will not use it in connection with . (SN 1991T has entered into several recent determinations of , and in our opinion it has caused some confusion.)
In the spirit of the previous section, there are a number of ways in which the Cepheid-calibrated absolute magnitudes can be matched to those of more remote SNe Ia in the Hubble flow, to determine the value of : e.g., by means of a straightforward standard-candle treatment (Tammann & Sandage 1995; Saha et al. 1995b); a binless mode or a cut (Vaughan et al. 1995a,b); a correlation between and absolute magnitude (Hamuy et al. 1995a); an LCS analysis (Riess et al. 1995a); or (Fisher et al. 1995). All of these treatments will give nearly the same answer (provided that the LCS analysis is redone so that it no longer rests on the Phillips (1993) slope of the light-curve decline-rate correlation, which was too steep). Because SNe Ia in blue galaxies appear to have very small absolute-magnitude dispersions, and because the Cepheid-calibrated SNe Ia are in blue galaxies, at this time we favor the value obtained by BRB95 by applying the Cepheid calibration to SNe Ia in blue galaxies, .
A reason to suspect that the actual value of may turn out to be a little lower is that, as Tammann & Sandage (1995) emphasize, it is unacceptable on statistical grounds that the nearby, Cepheid-calibrated SNe Ia should be systematically brighter than the remote SNe Ia in the Hubble flow. On the contrary, to the extent that there is an intrinsic dispersion in SN Ia absolute magnitudes, the remote SNe Ia should be systematically brighter than the nearer ones. From this kind of reasoning Tammann & Sandage conclude that an upper limit to is 57 8.
3.2 Physical Calibrations
There are two simple, instructive ways to think about the peak luminosity of an SN Ia in physical terms. One way is to consider that the luminosity is the thermal emission from an atmosphere that has a certain size and temperature structure. Rather than worry about what determines the properties of the atmosphere, one can use observed spectra to infer the properties, and then compute the luminosity. Early, primitive applications of this approach to SN Ia luminosities (Branch & Patchett 1973; Kirshner & Kwan 1974; Branch 1979) were referred to as the Baade, or Baade-Wesselink, method. For Type II Supernovae, this was succeeded by the more advanced Expanding Photosphere Method (Eastman & Kirshner 1989, Schmidt, Kirshner, & Eastman 1992). We have begun to refer to the method, as we (Baron et al. 1994, 1995: Nugent et al. 1995a,b,c) apply it to supernovae of all types, as the Spectral-fitting Expanding Atmospheres Method (SEAM), to emphasize that in our approach one actually fits a synthetic spectrum to the observed spectra of the supernova whose distance one is trying to determine, and one makes no assumptions about the existence of a photosphere. This has been carried out for SNe Ia by the program PHOENIX 5.9. This code accurately solves the fully relativistic radiation transport equation along with the non-LTE rate equations (for some ions) while ensuring radiative equilibrium (energy conservation). The following species were treated in non-LTE: Na I (3 levels), Ca II (5 levels), Mg II (18 levels), O I (36 levels) and Fe II (617 levels). These models allow us to predict a supernova’s luminosity given the following assumptions: (1) Homologous expansion, , from which it follows that the velocity of a given matter element is constant and hence that the position of a reference radius is given by , where is determined by the spectral fit. (2) The density gradient for the atmosphere follows a decaying exponential. (3) A high-quality fit to the spectrum implies that the model parameters were accurately determined.

Fig 4 shows the quality fits obtained for the near-maximum-light spectra of SNe 1981B (at maximum light), 1992A (five days post-maximum) and 1991bg (maximum light), and Table 1 lists the model parameters that were used to produce the synthetic spectra and the corresponding luminosities and colors. These models were based on a model–W7 composition in which we homogenized the abundances in matter moving faster than 8000 km s-1. In the case of SN 1991bg, we also increased the abundance of Ti II by a factor of 10. The rise times were estimated by means of a procedure similar to the one described in Nugent et al. (1995a). Two things are readily apparent from these SEAM results.
SN 1981B 9300 18 11400 1500 -19.38 -19.49 -0.48 -0.07 1992A 8700 20 8000 1400 -18.65 -18.73 -0.15 0.12 1991bg 7400 15 7400 800 -17.16 -16.67 0.58 1.00
First, these SNe Ia do indeed form part of the sequence discussed in Nugent et al. (1995c). There is a clear decline in temperature, velocity and , from SN 1981B to 1992A to 1991bg. The magnitudes and colors vary, from the blue and bright SN 1981B to the dim and red SN 1991bg. Note the over one magnitude range in , which agrees well with observation (see Fig 1).
Second, given reasonable estimates of the rise times, we obtain absolute magnitudes and distances. To estimate our errors we conservatively assume errors of 0.2 mag. from the velocity, 0.2 mag. from the composition, and 0.2 mag. for the fact that not all species are treated in non-LTE. Adding these in quadrature we arrive at errors of 0.35 (for the estimated rise times). Table 2 displays the resulting peak absolute magnitudes for each and their corresponding distance moduli (We have allowed for the fact that at the epoch of the SN 1992A spectrum, five days post–maximum, the light curve had declined 0.3 mag. in the blue from its peak (Suntzeff 1992)).
SN 1981B -19.49(35) -19.42(35) 12.03(05) 11.93(05) 0.10(05) 31.08(36) 1992A -19.03(35) -19.02(35) 12.57(03) 12.58(03) 0.00(02) 31.60(35) 1991bg -16.67(35) -17.67(35) 14.76(10) 14.02(05) 0.00(02) 31.62(35)
Using the relation between absolute magnitude and H0 given in section 2.1, the mean SEAM absolute magnitudes of the normal SNe 1981B and 1992A correspond to , where we have allowed for an uncertainty of 2 days in the rise times.
Alternatively, one can think about the peak luminosity as being powered by the gamma-ray and positron products of the radioactive decay chain 56Ni 56Co 56Fe. Then a natural first approximation to the luminosity is:
| (1) |
where , the instantaneous radioactivity luminosity at the time of maximum light, is a known function of the rise time, , is the ejected mass of 56Ni, and is a dimensionless parameter of order unity. For certain simplifying assumptions is unity (Arnett 1982, Branch & Khokhlov 1995). More realistic values of can be obtained only from detailed light-curve calculations which incorporate the dependence of the opacity on the physical conditions and the composition. Such calculations have been carried out by Harkness (1991), and by Höflich and his collaborators; the latter are summarized by Höflich & Khokhlov (1995; here H&K95). For the very wide variety of models considered by H&K95, the value of ranges from 0.62 to 1.46. However, many of the models are not really “in the running” as representations of the real SNe Ia that have been observed; e.g., some are “helium ignitors” (sub-Chandrasekhar white dwarfs whose first nuclear ignition is far off-center near the base of an accreted helium layer, rather than in carbon-oxygen near the center of a Chandrasekhar-mass white dwarf) which probably cannot satisfy observed light curves and spectra (H&K95; Branch et al. 1995b; Nugent et al. 1995x), and some have rise times to maximum light that are too short, ( 15 days). Fig. 5, in which is plotted against the rise time to bolometric maximum light for all of the H&K95 models, shows that low values of tend to be associated with models that rise to maximum too fast. (In Figs. 5, 6 and 7, open circles denote models that are not really in the running because they are helium ignitors or they have rise times of less than 15 days.) For models which have rise times of 15 days or more, the value of tends to be exceed unity (for physical reasons that are explained by H&K95 and references therein). If we adopt M(Ni)=0.6 M⊙ (Harkness 1991; Höflich 1995), , and a rise time of 182 days as characteristic values for normal SNe Ia, we obtain . With a characteristic bolometric correction for normal SNe Ia of 0.1 mag, we have , which corresponds to .

There are several alternatives to the formulation of the 56Ni approach to peak luminosities. For example, Fig. 6 shows the bolometric absolute magnitudes plotted against for the models of H&K95. This figure is just like one shown by H&K95, but here the models in the running as representations of observed SNe Ia are identified by filled circles. It is very interesting that in spite of the fact that the models have a variety of rise times and parameters, the peak luminosity turns out to be, to a good approximation, proportional to the nickel mass. For the range of interest for normal SNe Ia, , the bolometric magnitude is , which with the other parameters as above leads to .

Another way to use the H&K95 models is discussed recently by van den Bergh (1995; here vdB95), who plots against for the models and notes that the trend is nearly degenerate with an interstellar reddening line. He points out that consequently one can define a quantity , and predict for an SN Ia of an observed without knowing the reddening. Fig. 7 is just like Fig. 1 of vdB95, but with the H&K95 models that are in the running being identified by filled circles, and with observed SNe Ia (Vaughan et al. 1995b) also plotted, as asterisks. Note that the models that are in the running are even less scattered than are the models in general. The solid line, a linear fit to the models in the running, is ; thus its slope is close to the reddening slope of 3.1. Adopting the model slope of 3.39 and fitting all of the real SNe, except the three reddest ones for which there are no models, to the model line yields . (If the three reddest SNe Ia were included the result would be ). Thus we obtain a result that agrees with that of vdB95. Where we differ with vdB95 is in the choice of conclusions. Those offered by vdB95 are either (1) the H&K95 models are too bright; (2) the H&K models are too red, or (3) the Cepheid zero point is wrong by 0.75 mag. The latter conclusion is based on contrasting the low value of that is obtained from the SN Ia models of H&K95 to the the higher value of that has been derived on the basis of the Cepheid–based distances to galaxies associated with the Virgo cluster (Pierce et al. 1994; Freedman et al. 1994; Kennicutt et al. 1995; Mould, Freedman, & Kennicutt 1995; vdB95). However, the low value of from the H&K95 models is in excellent agreement with the result obtained in section 3.1, from Cepheid-based distances to parent galaxies of SNe Ia!
Therefore we offer choice (4): the route to through Virgo galaxies is a hazardous one, which currently overestimates . Not so much because there is anything wrong with the Cepheid zero–point, but in part because of the use of too large of an “unperturbed cosmic velocity” for Virgo (e.g., Freedman et al. 1994 use 1404 km s-1 while Jerjen & Tammann (1993) find 1179 km s-1 and Gudehus (1995) finds about 1000 km s-1), and in part because, owing perhaps to selection effects, the “Virgo” spirals whose distances have been measured on the basis of Cepheids, so far, tend to be on the near side of the very extended spatial distribution of the Virgo spirals. Note that before their Cepheid–based distances were measured, NGC 4536 and NGC 4496 were found to be on the front side by Tully (1988), from a Virgocentric flow model, and by Pierce (1994), from a Tully–Fisher analysis. This point of view is supported by a preliminary analysis of the distance to Virgo by means of SEAM (Nugent et al. 1996). Table 2 lists the SEAM distances to SNe 1981B in NGC 4536 and 1991bg in NGC 4374, an elliptical galaxy in Virgo. SEAM gives the same distance modulus to SN 1981B and NGC 4536 as do the Cepheids, 31.1 mag. ( 17 Mpc). But the SEAM distance modulus to SN 1991bg and NGC 4374 is 31.6 mag. ( 21 Mpc). This difference of 0.5 mag. is the same as is implied by Tully–Fisher analysis of NGC 4536 and SBF analysis of NGC 4374. Thus if one believes that the ellipticals are at the center of Virgo, and that SEAM and/or Tully–Fisher plus SBF provide the correct difference in distance modulus between NGC 4536 and NGC 4374, then one arrives at a distance to Virgo of 21 Mpc. Then the value of obtained via the Virgo cluster is easily reconciled with the low value obtained above from SNe Ia in general: for example, a plausible mean distance to Virgo of 21 Mpc, and a plausible unperturbed velocity of 1100 km s-1, would give from Virgo.

SEAM and the 56Ni method are not really separate, of course. The amount of ejected 56Ni determines the atmospheric structure, and the two approaches are destined to merge into one. Nugent et al. (1995b) combined the two approaches, but only to eliminate the rise time dependence, which enters in opposite directions when these two approaches are considered separately. Combining the two in a more fundamental sense has been begun by Harkness (1991) and Höflich (1995) who attempt to simultaneously match both light curves and spectra with a given model.
As in the previous section on from Cepheid-calibrated SNe Ia, we conclude this section with a reason to think that the true value of may be a little lower than obtained here from physical considerations. In Fig. 8, Höflich’s (1995) calculated spectrum of model M36 is compared with the observed spectrum of SN 1994D (Meikle et al. 1996). The flux excess in the synthetic spectrum near 3000 Å suggests an insufficiency of ultraviolet line blocking in the calculations. With more line blocking, the excess ultraviolet flux would be redistributed to longer wavelengths, where it would make and brighter. SEAM also could be underestimating the SN Ia luminosities if we are underestimating the rise times.

4 SOME ISSUES
Already about ten SNe Ia in the redshift range 0.3 0.5 have been discovered (Norgaard–Nielsen et al. 1989; Perlmutter et al. 1994, 1995a, 1995b, Schmidt et al. 1995). Preliminary indications are that when the eight remote SNe Ia found by the LBL group are matched to nearer SNe Ia on the basis of light-curve width — using the LBL “stretch factor” in lieu of or LCS — the value of comes out to be near 0.5 (Perlmutter et al. 1995b).
In principle, concerns about evolution with cosmic epoch of the SN Ia population and about observational selection effects (in favor of the brightest SNe Ia, or in favor some kind of parent galaxy), are alleviated by the use of the LBL light–curve stretch factor as a DIO to standardize the SNe Ia. SN 1994D warns us, however, that luminosity does not correlate perfectly with light–curve shape. If the rapidly declining SNe Ia in the LBL high-redshift sample happened to be like SN 1994D, then the stretch factor would overcorrect the luminosities of those SNe Ia, make them too bright, and overestimate the value of . For this reason, and also because some high–redshift SNe Ia may not be well observed at phases other than maximum light, it will be important for a definitive determination of to develop and refine some of the other DIOs that we discussed in section 2.
To the extent that the cosmic matter distribution is not homogeneous, the determination of from the Hubble diagram in the standard way can lead to an underestimate of (Kantowski, Vaughan, & Branch 1995). It is tempting to speculate about what the matter distribution might be like, and what correction might be required, for any measured value of . If were measured to be small, say 0.1, then we probably could conclude that the matter in the universe is clumped, in the sense of Kantowski et al. Then the measured value perhaps should be corrected to , which would be quantitatively, but not qualitatively, significant. On the other hand, if is measured to be high, near 0.5, then the matter distribution probably is rather smooth, and no correction may be required.
5 SOME COSMIC IMPLICATIONS
SNe Ia, whether calibrated by Cepheids in their parent galaxies, by spectrum fitting (SEAM), or by some version of the 56Ni method, indicate that the value of the Hubble constant is low, less than or about 60. (We see no prospect of reconciling SNe Ia with a high value of , such as 80.) Preliminary indications from the high-redshift SNe Ia discovered by the LBL group are that is near 0.5 (Perlmutter 1995b). It is interesting to recall that these are the values of and that were advocated by Fowler (1987, 1989), who wanted to close the universe with baryonic matter. They also are the values that are required by the decaying–neutrino theory of Sciama (1990, 1994), if the universe is to be closed by such neutrinos.
But, for values like these, is there a cosmic age problem? That depends to a great deal on how literally one takes the current estimates of , the globular cluster ages, and . We are tempted to take the point of view that if is being measured to be near 0.5, it probably is 0.5, because 0.5 is such a special number. Then , for example, gives an expansion age of 12 Gyr, which according to some is an uncomfortably short amount of time for globular clusters and for nucleocosmochronology. But introducing a non–zero value of , at 120 powers of ten from its “natural” value (to the extent that does have a natural value), to resolve whatever mild discrepancy there may be between current estimates of the cosmic expansion timescale and other timescales, would be incredibly fine tuning. and the globular cluster age, unlike q0, have no special values, so we need to respect their error bars. In view of the grand lesson of history - that people get their ’s too high - and in view of the tendency for recent estimates of globular cluster ages (e.g., Charboyer et al. 1995; Shi 1995; Mazzitelli, D’Antona, & Caloi 1995) to be somewhat lower than many previous estimates (but not Fowler’s), we conjecture that fine tuning by means of a non–zero will not be required. That is, even with , there probably is no cosmic age problem.
Acknowledgments
We would like to thank the organizers, Ramon Canal, Pilar Ruiz–Lapuente, and Jordi Isern, for making this meeting possible, and all the participants for making it so stimulating. We also thank our esteemed SEAM collaborators, Eddie Baron and Peter Hauschildt, for allowing us to present preliminary results for SN 1991bg. Our work has been supported by NSF and NASA.
References
- [] Arnett, W. D. 1982, ApJ, 253, 785
- [] Baron, E. Hauschildt, P. H., & Branch, D. 1994, ApJ, 426, 334
- [] Baron, E., et al. 1995, ApJ 441, 170
- [] Branch, D. 1979, MNRAS, 186, 609
- [] Branch, D., Fisher, A., & Nugent, P. 1993, AJ, 106, 2383
- [] Branch, D. & Khokhlov, A. 1995, Phys. Reports, 256, 53
- [] Branch, D., Lacy, C. H., McCall, M. L., Sutherland, P. G., Uomoto, A., Wheeler, J. C., & Wills, B. J. 1983, ApJ, 270, 123
- [] Branch, D., Livio, M., Yungelson, L. R., Boffi, F. R., & Baron, E. 1995b, PASP, 107, 1019.
- [] Branch, D., & Patchett, B. 1973, MNRAS 161, 71
- [] Branch, D., Romanishin, W. J., & Baron, E. 1995a, ApJ, in press
- [] Branch, D. & van den Bergh, S. 1993, AJ, 105, 2231
- [] Burstein, D. & Heiles, C. 1978, ApJ, 225, 40
- [] Canal, R., Ruiz–Lapuente, P., & Burkert, A. 1995, ApJ, in press
- [] Chaboyer, B. 1995, ApJ, 444, L9
- [] Eastman, R., & Kirshner, R. P. 1989, ApJ, 347, 771
- [] Fisher, A., Branch, D., Höflich, P., & Khokhlov, A. 1995, ApJ, 447, L73
- [] Fowler, W. A. 1987, QJRAS, 28, 87
- [] Fowler, W. A. 1989, in Proceedings of the 14th Texas Symposium on Relativistic Astrophysics; Ann. New York Acad. Sci., 571, 68
- [] Freedman, W. L. et al. 1994, Nature, 371, 385
- [] Goobar, A., and Perlmutter, S. 1995, ApJ, 450, 14
- [] Gudehus, D. 1995, A&A, 302, 21
- [] Hamuy, M., Philips, M. M., Maza, J., Suntzeff, N. B., Schommer, R. A., & Aviles, R. 1995a, AJ, 109, 1
- [] Hamuy, M., Phillips, M. M., Maza, J., Suntzeff, N. B., Schommer, R. A., & Aviles, R. 1995b, in preparation
- [] Harkness, R. P. 1991, in Proc. ESO/EPIC Workshop on SN 1987A and other Supernovae, ed. I. J. Danziger and K. Kjär (Munich: ESO), p. 447
- [] Höflich, P. 1995, ApJ 443, 89
- [] Höflich, P. & Khokhlov, A. 1995, ApJ, in press (H&K95)
- [] Jerjen, H., & Tammann, G. A. 1993, A&A, 273, 354
- [] Kantowski, R., Vaughan, T. E., & Branch, D. 1995, ApJ, 447, 35
- [] Kennicutt, R. C., Jr., Freedman, W. L., & Mould, J. R. 1995, AJ, 110, 1476
- [] Kirshner, R. P., & Kwan, J. 1974, ApJ, 193, 27
- [] Mazzitelli, I., D’Antona, F., & Caloi, V. 1995, A&A, 302, 382
- [] Meikle et al. 1995, preprint
- [] Mould, J. et al. 1995, ApJ, 449, 413
- [] Norgaard–Nielsen, H. U., Hansen, L., Jorgensen, H. E., Salamanca, A. A., Ellis, R. S., & Couch, W. J. 1989, Nature, 339, 523
- [] Nugent, P., Baron, E. Hauschildt, P. H., & Branch, D. 1995a, ApJ 441, L33
- [] Nugent, P., Branch, D., Baron, E., Fisher, A., Vaughan, T. E., and Hauschildt, P. H. 1995b, Phys. Rev. Lett., 75, 394; erratum: 75, 1874
- [] Nugent, P., Phillips, M. M., Baron, E., Branch, D., & Hauschildt, P. 1995c, ApJ, 455, L147
- [] Nugent et al., 1996, in preparation
- [] Patat, F. et al. 1995, MNRAS, in press
- [] Perlmutter, S. et al. 1994, IAU Circ., No. 5956; erratum: No. 5958
- [] Perlmutter, S. et al. 1995a. ApJ, 440, L41
- [] Perlmutter, S. et al. 1995b, this volume
- [] Phillips, M. M. 1993, ApJ, 413, L105
- [] Pierce, M. J. 1994, ApJ, 430, 53
- [] Pierce, M. J. et al. 1994, Nature, 371, 385
- [] Richmond, M. W. et al. 1995, AJ, 109, 2121
- [] Riess, A. G. 1995, personal communication
- [] Riess, A. G., Press, W. H., & Kirshner, R. P. 1995a, ApJ, 438, L17
- [] Riess, A. G., Press, W. H., & Kirshner, R. P. 1995b, ApJ, 445, L91
- [] Ruiz-Lapuente, P., Burkert, A., & Canal, R. 1995b, ApJ, 447, L69
- [] Saha, A., Labhardt, L., Schwengeler, H., Macchetto, F. D., Panagia, N., Sandage, A., & Tammann, G. A. 1994, ApJ, 425, 14
- [] Saha, A. 1995, personal communication
- [] Saha, A., Sandage, A., Labhardt, L., Schwengeler, H., Tammmann, G. A., Panagia, N., & Macchetto, F. D. 1995a, ApJ 438, 8
- [] Saha, A., Sandage, A., Labhardt, L., Tammann, G. A., Macchetto, F. D., & Panagia, N. 1995b, preprint
- [] Sandage, A., Saha, A., Tammann, G. A., Panagia, N., & Macchetto, F. D. 1992, ApJ, 401, L7
- [] Sandage, A. 1995, in Particles, Strings, and Cosmology (Singapore: World Scientific), in press
- [] Sandage, A., Saha, A., Tammann, G. A., Labhardt, L., Schwengeler, H., Panagia, N., & Macchetto, F. D. 1994, ApJ, 423, L13
- [] Schaefer, B. E. 1995a, preprint
- [] Schaefer, B. E. 1995b, ApJ, 447, L13
- [] Schmidt, B., Kirshner, R. P., & Eastman, R. 1992, ApJ, 395, 366
- [] Schmidt, B. et al. 1995, IAU Circ., No. 6160
- [] Sciama, D. 1990, ApJ, 364, 549
- [] Sciama, D. 1994, Modern Cosmology and the Dark Matter Problem (Cambridge: Cambridge University)
- [] Shi, X. 1995, ApJ 446, 637
- [] Suntzeff, N., 1992, in IAU Colloq. 145, Supernovae and Supernovae Remnants, ed. R. McCray (Cambridge: Cambridge University Press), in press
- [] Tammann, G. A. & Sandage, A. 1995, ApJ, 452, 16
- [] Tanvir, N. R., Shanks, T., Ferguson, H. C., & Robinson, D. R. T. 1995, Nature, 377, 27
- [] Tully, R. B. 1987, ApJ, 321, 280
- [] Tully, R. B. 1988, The Catalog of Nearby Galaxies (Cambridge: Cambridge University)
- [] van den Bergh, S. 1995, ApJ, 453, L55
- [] Vaughan, T. E., Branch, D., Miller, D. L., & Perlmutter, S. 1995, ApJ, 439, 558
- [] Vaughan, T. E., Branch, D., & Perlmutter, S. 1995, in preparation
- [] Wells, L. A. et al. 1994, AJ, 108, 2233