Near-infrared and optical broadband surface photometry of 86 face-on
disk dominated galaxies.
††thanks: Based on observations with the Jacobus Kapteyn Telescope and the
Isaac Newton Telescope operated by the Royal Greenwich Observatory at
the Observatorio del Roque de los Muchachos of the Instituto de
Astrofísica de Canarias with financial support from the PPARC (UK) and NWO
(NL) and with the UK Infrared Telescope at Mauna Kea operated by the
Royal Observatory Edinburgh with financial support of the PPARC.
1 Introduction
The light of a spiral galaxy is dominated by two components, the disk and the bulge. The basic difference between these components lies in their support against gravitational collapse. The disk is almost completely rotationally supported, while the bulge is for some fraction also pressure supported. At least two parameters are needed to describe the light distribution of each of these components: a surface brightness term and a spatial scaling factor. The fundamental parameters of the disk are usually expressed in central surface brightness () and scalelength (), while the bulge parameters are expressed in effective surface brightness () and effective radius (). These fundamental parameters were determined for a large statistically complete sample of galaxies by de Jong ([1995a], PaperII). The distributions of the fundamental parameters are still poorly known and their statistics are investigated in this paper with some emphasis on three relationships: 1) “Freeman’s law”, the empirical relation found by Freeman ([1970]) indicating the constancy of disk central surface brightness among galaxies, 2) the number density of galaxies as a function of their fundamental parameters and 3) the relation between the fundamental parameters and Hubble classification.
1.1 Freeman’s law
One of the most remarkable results presented in the classical paper of Freeman ([1970]) was the apparent constancy of the passband of spiral galaxies. For a subsample of 28 (out of 36) galaxies he found -mag arcsec-2. If the central is approximately constant among galaxies, this translates directly into a constant central surface density of matter associated with the luminous material.
Several authors have tried to explain this result. It has been argued that ignoring the contribution of the bulge to the light profile could produce the effect (Kormendy[1977]; Phillipps & Disney[1983]; Davies[1990]). Freeman ([1970]) did not decompose the luminosity profiles in a bulge and disk, but fitted a line to the linear part of the luminosity profile plotted on a magnitude scale. This linear part of the profile could be contaminated by bulge light. With their models Kormendy([1977]) and Davies([1990]) show that the central surface brightness of low surface brightness disks will be overestimated by this procedure because of the extra bulge light near the center. The central surface brightnesses of high surface brightness disks with a short scalelength are underestimated; because of the small disk scalelength the bulge light dominates the luminosity profile again in the outer region, but with a longer scalelength and a lower surface brightness than the disk. Several arguments can be raised against this interpretation (see also Freeman[1978]): 1) even with bulge light included the result is still important, 2) many later type galaxies hardly have a bulge, but the effect is still present (van der Kruit[1987]), 3) in samples where proper decomposition techniques are used the effect is still found, although with a larger dispersion (Boroson[1981]), 4) a limited range in bulge parameter space was explored in the models mentioned above, which might not be representative of the bulges in spiral galaxies.
Dust extinction has also been proposed as an explanation for the constancy of (Jura[1980]; Valentijn[1990]). If galaxies are optically thick in the passband, one is only looking one optical depth into the galaxies and always observes the same outer layer. This removes the inclination dependence from the Freeman relation, but leaves the unsolved problem of why all galaxies should have the same surface brightness at optical depth equal to one.
Freeman established his relation in the passband where the light of galaxies is dominated by a very young population of stars, which make up only a few percent of the stellar mass. Of all commonly used passbands the light of the massive old stellar population is relatively the most important in the near-infrared (near-IR) passband used here. The passband has the additional advantage that the extinction by dust is strongly reduced. The passband is therefore best suited to trace the fundamental parameters of the luminous mass. However, other passbands have been used as well in this study to investigate the wavelength dependence of the bulge and disk parameters due to dust and population effects.
De Vaucouleurs ([1974]) was one of the first to suggest that the constancy of might result from a selection effect. This was later quantified by Disney ([1976]) and Allen & Shu ([1979]). Catalogs of galaxies have usually been selected by eye from photographic plates using some kind of diameter limit. One might therefore select against very compact galaxies with a high central surface brightness, because these have small isophotal diameters. Likewise, galaxies with a very low surface brightness might have been missed due to the lack of contrast with the sky background. Disney & Phillipps ([1983]; see also Davies[1990]) define a visibility for a galaxy, which enables one to correct a sample for these selection effects if one has made a careful initial sample selection.
1.2 Bivariate distributions
Correcting for selection effects is in fact trying to determine from the observed statistics how many galaxies there are per unit volume with a certain property. More than one property can be used in determining such a distribution per volume. One needs at least two parameters to characterize the exponential light profile of a disk dominated galaxy and a bivariate distribution function of both disk parameters is a more general statistical description of galaxy properties than a one parameter function. The diameter, the central surface brightness and the luminosity distribution functions of galaxies are integrations of this bivariate distribution in a certain direction. In this process information is lost and the bivariate distribution function is therefore more useful in studies of deep galaxy counts and provides more constraints on theories of galaxy formation and evolution than its one dimensional counterparts.
Bivariate distribution functions of galaxies have been determined only a few times before (Choloniewski [1985]; Phillips & Disney [1986]; van der Kruit [1987], [1989]; Saunders et al.[1990]; Sodré & Lahav [1993]). Even though different fundamental parameters are used, almost all (except Saunders et al.) of these distributions describe fundamentally the same thing in different ways. These studies were performed in the or comparable passbands, which is, as mentioned before, not the wavelength most suited to study global fundamental properties of galaxies.
1.3 Morphological classification
For classification of spiral galaxies on the Hubble sequence three principal discriminators are used: 1) the pitch-angle of the spiral arms, 2) the degree of resolution of the arms (into H ii regions, dust lanes and resolved stars) and 3) the bulge-to-disk (B/D) ratio. In his detailed description of the Hubble sequence, Sandage ([1961]) indicates that the B/D ratio is the weakest discriminator unless galaxies are seen edge-on. He finds clear mismatches in type between classifications using items 1) and 2) and classifications using item 3). Another factor hampers the use of B/D ratio for classification of early spirals. On the photographs used for classification the central region of an early spiral galaxy is normally overexposed in order to show clearly the faint spiral structure.
Still, the B/D ratio is often assumed to be the principle parameter underlying the Hubble sequence, even though a tight correlation between classification and measured B/D ratios was never found. The measurements indicate at best a trend (e.g. Simien & de Vaucouleurs[1986]; Andredakis & Sanders[1994]) and the discrepancies between B/D ratio and Hubble type have been attributed to two sources of error. First there is the uncertainty in classification. Comparisons of Hubble types given by different classifiers show an rms uncertainty in type index of order 2 T-units (Lahav et al.[1995]). The second source of error is the uncertainty in the bulge/disk decomposition, due to, among other things, the mathematical peculiarities of the widely used bulge law (de Vaucouleurs[1948]).
1.4 Outline
The main goal of this investigation is to determine the nature of the Freeman law. In order to address the problems concerning the Freeman law, a large sample of face-on spiral galaxies was carefully selected and surface photometry was obtained in the passband as well as in several other passbands. A large number of other global and structural parameters of the galaxies were determined in this investigation and their nature is also explored in this paper.
The remainder of this article is organized as follows. The data set and the extraction of the observed bulge and disk parameters are briefly described in Sect.2. The corrections to the observations in order to calculate number distributions are described in Sect.3 and these distributions are presented for the and the passband in Sect.4. The relations found are discussed within the context of the three main points of interest (Freeman’s law, bivariate distributions and Hubble sequence) in Sect.5. The conclusions are summarized in Sect.6.
2 The data
In order to examine the parameters describing the global structure of spiral galaxies, 86 systems were observed in the and passbands. A full description of the selection, observations and data extraction can be found in de Jong & van der Kruit ([1994], PaperI). The galaxies in this statistically complete sample of undisturbed spirals were selected from the UGC (Nilson[1973]) to have red diameters of at least two arcmin and minor over major axis ratios larger than 0.625. The survey was limited to 12.5% of the sky globe. Standard reduction techniques were used to produce calibrated images.
In PaperII the extraction of the bulge and disk parameters from the calibrated images is described. An extensive error analysis was performed using different fit techniques. The best results were obtained with a model galaxy with an exponential radial light profile for both bulge and disk, that was two-dimensionally (2D) fitted to the full calibrated image. This 2D fit technique made it also possible to fit an additional Freeman bar (Freeman[1966]) component, which improved the fit for 23 of the 86 galaxies. The error analysis revealed the two dominant sources of error in the derived component parameters to be: 1) the assumed luminosity profile of the bulge and 2) the uncertainty in the sky background subtraction. Other uncertainties, like errors in seeing correction, zero-point errors and resolution problems were found to be much smaller in most cases.
Assuming that the exponential profile is a reasonable description of the bulge light distribution, the dominant source of error in the parameters is caused by the uncertainty in the sky background level. This uncertainty was not taken into account using the 2D fit technique, but the 1D errors can be used, because the 2D fit results are generally comparable to the double exponential 1D fit results (see PaperII, Fig.6). The 1D errors do include the uncertainty of sky background subtraction and are always larger than the formal 2D fit errors. The 1D errors are only shown in the graphs presented here if they are significantly larger than the symbol size.
In this paper the RC3 (de Vaucouleurs et al.[1991]) morphological type index T is used (see also PaperI). Because a few galaxies had no RC3 classification, I classified them as UGC 1551–(8), UGC 1577–(4), UGC 9024–(8) and UGC 10437–(7). The mean error in type index in the RC3 is stated to be 0.89. This number seems to be very low. Lahav et al.([1995]) showed that the dispersion between the RC3 T-index and the T-values of six expert classifiers was on average 2.2 T-units for a sample of 831 galaxies. The dispersion between any two classifiers ranged between 1.3 and 2.3 T-units, with 1.8 on average. It is safe to say that the uncertainty in classification in the RC3 is at least 1.5 T-units.
The data set comprises 86 galaxies in six passbands. To keep a clear view on the obtained results I will concentrate on the two most extreme cases, the and the passband data. The results for the other passbands are available in electronic form. The and passband results are displayed in the graphs with the same dynamic range (but often with different zero-points) and therefore they can be compared directly.
3 Corrections
The observed bulge and disk parameters determined in PaperII have to be corrected for all kinds of systematic effects. These corrections are often uncertain but necessary. One can only expect that they are at least in a statistical sense correct.
3.1 Galactic foreground extinction
The measurements of brightness and surface brightness were corrected (unless stated otherwise) for Galactic foreground extinction according to the precepts of Burstein & Heiles ([1984]) and the actual passband extinction values were adopted from the RC3. The Galactic extinction curve of Rieke & Lebofsky ([1985]) was used to convert these passband extinction values to other passbands. The sample galaxies were selected to have a Galactic latitude larger than 25∘; the extinction correction is in general small and gets smaller for the longer wavelength passbands. The average correction is 0.14 -mag and the largest correction is 0.68 -mag, which translates into 0.06 -mag.
3.2 Inclination corrections
Since Valentijn ([1990]) reopened the debate of optically thin versus optically thick spiral galaxies, inclination corrections for surface brightness have become less trivial. A simple equation for correcting surface brightnesses for inclination effects, taking internal extinction into account, has the form
| (1) |
where is the major over minor axis ratio of the galaxy and the internal extinction parameter, which takes values . Fully transparent galaxies are described by , while the case describes the optically thick ones.
It is unlikely that the inclination correction indeed takes such a form in the optical passbands, as extinction in the optical passbands is for a considerable fraction caused by scattering and not just by absorption alone. Light will be scattered preferably from edge-on directions to face-on directions, which means that extinctions will seem to be higher for edge-on than for face-on galaxies. On top of that, certain configurations of dust and stars can behave optically thin in an inclination test, while they may in fact be completely opaque. A clear example of this is a very thin layer of optically thick dust between a thicker slab of stars. It is not trivial to produce a better description as there are too many unknowns and itself may be a function of galactic radius (see e.g. Giovanelli et al.[1994]; Byun et al.[1994]). Therefore Eq.(1) is used as a working hypothesis. However, for a face-on selected sample such corrections are small. The average correction for the sample examined here is 0.26 mag arcsec-2 when , with a maximum of 0.60 mag arcsec-2 for the galaxy with the largest observed of 0.58.
3.3 Distances

The distances to the observed galaxies were calculated using a Hubble flow with an of 100 km s-1 Mpc-1, corrected for infall into the Virgo cluster using the 220 model of Kraan-Korteweg ([1986]). This model assumes that the Local Group has an infall velocity of 220 km/s towards the Virgo cluster and describes the motions of the galaxies around the cluster by a non-linear flow model. The velocities needed for this model were calculated from the velocities listed in the RC3, which are also tabulated in PaperI. The nearest galaxy is at 6.2 Mpc, the most distant galaxy is at 82.5Mpc. The peculiar velocities of galaxies were assumed to be on average 200 km/s in the line of sight, which introduces an uncertainty () of 2 Mpc in the distance estimates. The distribution of distances is displayed in Fig.1, which shows some excess of galaxies at 45 Mpc because of an extension of the Pisces-Perseus supercluster. The relationships presented in this study are very little affected when other infall and flow models are used to calculate distances.
3.4 Selection correction
The physically relevant quantities are not the observed numbers of galaxies with a certain property, but the frequency of galaxies with a certain property in a volume. Therefore, the fact that a galaxy is included in the sample has to be linked to the statistical probability of finding such a galaxy in a certain volume. The galaxies in the sample were selected to have UGC red major axis diameter () of at least 2 arcmin. This creates a selection bias against galaxies with low surface brightness and/or small scalelengths, as they appear smaller on photographic plates. The distances () to the observed galaxies and their angular diameters () are known and the maximum distance at which galaxy can be placed, while still obeying the selection criteria, can be calculated (). A galaxy can only enter the sample if it lies in a spherical volume which has this maximum observable distance as radius. Turning this argument around, one can expect on statistical grounds that a selected galaxy samples a spherical volume with a radius equal to its maximum observable distance (a more formal discussion can be found in Felten[1976]). The volume sampled by a galaxy in a diameter limited sample is thus
| (2) |
Following the previous line of reasoning, an estimate for the average number of galaxies in a unit volume obeying a certain specification () for a complete sample of galaxies is
| (3) |
where is summed over all galaxies in the sample and if the specification is true for galaxy and if false. The error in , assuming Poison statistics in a homogeneous universe and considering the uncertainties in the distances, can be calculated by
| (4) |
There is always a chance that a member of a peculiar class of galaxy happens to be nearby and gets a lot weight in Eq.(3) and this volume correction can therefore only be applied to large samples. One must ensure that a large enough volume of space is sampled so that galaxies are randomly distributed in space. Figure1 shows that the sample mainly traces the local density enhancement, as large scale structures in the universe have scales of order 50 Mpc. Equation3 should therefore be used with care, because the number of galaxies with small intrinsic diameters will be overestimated relative to the larger ones due to the local density enhancement. The average number of galaxies per Mpc3 calculated with Eq.(3) might be more representative of the local environment than of the mean cosmological values. Still it is a useful equation to observe general trends in bivariate distributions and to compare results obtained from different passbands.
Other methods to correct distributions for selection effects have been advocated, because they take spatial density fluctuations into account (for an overview see Efstathiou et al.[1988]). These methods assume that the intrinsic distribution function is independent of position (x) in space, so that we can write , thereby losing the absolute calibration of the number density. These methods all assume a clear relation between the distribution parameter(s) and the limiting selection parameter(s). This is not the case for the current investigation. A diameter limit is not trivially linked to the central surface brightness distribution, certainly not when a different passband is used for the selection and the distribution.
The correction of Eq.(3) is only valid if a particular galaxy would have been measured at the same intrinsic (as opposed to angular) diameter, had it been at a different distance. In PaperI it was shown that this is probably the case for the UGC galaxies with type index T6. For later types the situation is less clear, there is a too short a range in diameters to check and it must be assumed that for late-type systems the same type of galaxy is measured at the same intrinsic diameter at different distances. Under this assumption it is not important that the UGC eye estimated diameters of late-type galaxies correspond to lower average surface brightness than that of early types (see PaperI, Fig.11). This effect just means that there are more late-type galaxies in the sample than expected based on their isophotal diameter, but their average distance will be larger so that the number of galaxies per sampled volume stays the same.
The volume correction of Eq.(3) can be used to calculate number density distributions for all passbands, as long as the red UGC diameters are used to calculate the . The distribution of any galaxy parameter can be determined in any passband; the use of the red UGC diameters in Eq.(3) ensures the correction for the intrinsic selection effects of the whole sample.
Next to the diameter limit, there are two more selection criteria defining the sample. The selection was limited to 12.5% of the sky and only galaxies with were used, which is only 37.5% of all possible random orientations. Equation3 was corrected for these selection criteria. A correction was also applied for the fraction of galaxies for which no (photometric) data was available in a certain passband. All these corrections were made under the assumption that the incompleteness had no correlation with the investigated parameters.
Equation(3) can only be applied when the sample is complete. The statistical completeness of the sample can be tested with the -test (PaperI). The of a galaxy is the spherical volume associated with the distance of a galaxy divided by as defined in Eq.(3), thus for a galaxy in this diameter limited sample . For objects distributed randomly in space the average value of should be , where is the number of objects in the test. For the current sample and therefore there are slightly too many galaxies with a small angular diameter in the sample. The original sample of 368 galaxies from which the current subsample was selected had a (PaperI). Subsequent selection depended only on the position on the sky and therefore the excess of small diameter galaxies is probably caused by the density enhancement of the Pisces-Perseus supercluster, which gives some extra galaxies at the diameter selection limit. This might give some extra high surface brightness and/or large scalelength galaxies in the sample above the cosmological mean, because galaxies have to be intrinsically large to be included in the sample being at the distance of the Pisces-Perseus supercluster.
In a recent paper Davies et al.([1994]) argued that the sample used by van der Kruit ([1987]) was incomplete in a magnitude -test. They argued that a hidden magnitude limit had influenced the selection, so that an extra selection correction should be applied. I will follow up on this argument as the sample used here has been selected using similar criteria as van der Kruit used for his sample. 111Davies et al.([1994]) also indicate that van der Kruit’s sample becomes incomplete for low surface brightnesses at as . I would like to note that this might just be a statistical fluctuation of low number statistics, as for and for , and thus for even lower surface brightnesses the sample is in the statistically complete range of .
There is nothing hidden about a magnitude selection effect for a diameter limited sample. On the contrary, it is expected. For galaxies with a certain absolute magnitude there exists a range of possible (,) combinations, satisfying , but only a limited range of them will satisfy the diameter selection criterion . Thus for galaxies of the same apparent magnitude we will miss some of the small scalelength, bright and some of the large scalelength, faint galaxies, while still having selected a complete sample in diameter. The complication arises because apparent diameters and magnitudes are not independent parameters for galaxies and their -tests cannot be applied independently. Similar to Eq.(2), a corresponding to a magnitude limit can be constructed. The smallest of the magnitude and the diameter values should be used for each galaxy in a combined -test. These tests cannot be performed separately. The fundamental premise of a diameter limited sample is that the diameter is always smaller than the magnitude , and therefore a “hidden” magnitude limit does not have to be taken into account and Eq.(3) is sufficient.

4 The distribution of disk, bulge and bar parameters
In this section I investigate the distributions of the structural parameters of the different galaxy components as a function of morphological type and of each other. First the structural parameters of the disk and bulge are examined independently. In the final subsection, the relationships between disk and bulge parameters are investigated. The distributions of bulge and disk parameters are corrected for selection effects to yield volume number densities.
4.1 The disk parameters
Figure2 indicates some aspects of the completeness and selection effects of the sample. It shows the distribution of the observed central surface brightnesses versus scalelength as obtained from the 2D fits of PaperII. The passband values are plotted, because these values are most closely related to the (red UGC diameter) selection criteria. The dotted line indicates the selection limit for a diameter cutoff at 2 arcmin at a surface brightness of 24.7 -mag arcsec-2 for a perfect exponential disk. The 24.7-mag arcsec-2 is the average surface brightness at which the UGC red diameters were determined (see PaperI). As mentioned in PaperI, not all UGC galaxies had their diameters estimated at the same isophote level. This explains why there are some galaxies to the left of the selection line in Fig.2. If all galaxies have the same scalelength, the number of galaxies expected in the sample will decrease as and therefore it is not surprising that there are hardly any galaxies in the sample below 22-mag arcsec-2. Obviously no galaxies can enter the sample with fainter than 24.7 -mag arcsec-2.
| (-mag arcsec-2) | (-mag arcsec-2) | |||||||||
|---|---|---|---|---|---|---|---|---|---|---|
| RC3 type | nr. | nr. | ||||||||
| 61 | 21.32 0.78 | 21.45 0.76 | 21.58 0.74 | 60 | 17.48 0.71 | 17.61 0.69 | 17.75 0.67 | |||
| 12 | 22.01 0.75 | 22.16 0.73 | 22.30 0.72 | 10 | 18.34 0.90 | 18.50 0.90 | 18.65 0.90 | |||
| 8 | 22.97 0.60 | 23.12 0.57 | 23.26 0.55 | 7 | 20.05 1.05 | 20.21 1.03 | 20.37 1.01 | |||
| all | 81 | 21.59 0.92 | 21.72 0.90 | 21.86 0.89 | 77 | 17.82 1.08 | 17.96 1.08 | 18.10 1.08 | ||


Let us now look at the central surface brightness as function of morphological type (Fig.3). Apparently the galaxies from type T to 6 have on average the same , but with a large scatter. The later types have on average a significantly lower central surface brightnesses and they might be classified as late types just because they are low surface brightness (LSB) systems. It can be readily seen that this difference between early and late-type galaxies increases when going from the to the passband. This indicates that disks of the later type spirals are bluer than the disks of the early ones, but the discussion on the colors of these galaxies is postponed to PaperIV in this series (de Jong[1995b]). The average values were calculated for three morphological type bins indicated by the horizontal bars in Fig.3 as well as for the total sample. The values with their standard deviations are tabulated in Table1.


The average values were also calculated with an inclination correction according to Eq.(1) with values for and (semi transparent and completely transparent behavior). The results can also be found in Table1. The standard deviations on the average values are slightly smaller for , and even though it is a small effect, it is persistent for all subgroups and all passbands. The main result is of course a shift in the mean central surface brightness of the disks. For all remaining plots an inclination correction with will be used.
The distribution of the other disk parameter, the scalelength (), as function of type is shown in Fig.4. There is no trend of with type and there is a large range in scalelengths. There might be a lack of late-type galaxies with small scalelengths, but this can probably be attributed to a selection effect: the selection criteria are heavily biased against LSB galaxies with small scalelengths. The scalelengths are smaller in the passband than in the passband (discussion in PaperIV).
The information of Figs3 and 4 are combined in Fig.5. This figure shows that there is an upper limit in the (,)-plane, as there are no galaxies with large scalelengths and high central surface brightnesses. This cannot be caused by selection effects, large bright galaxies just cannot be missed in a diameter selected sample. This upper limit has been noted before by Grosbøl ([1985]). The upper limit partly follows the line of constant total disk luminosity, as indicated by the dashed line in Fig.5. Note that the Tully-Fisher relation ([1977], hereafter TF-relation) implies that this is also a line of constant maximum rotation speed of the disk. There is also an upper limit to the central surface brightness at about 20 -mag arcsec-2 (16 -mag arcsec-2). Again galaxies brighter than these limits are hard to miss because of selection effects.
Late-type galaxies have lower central surface brightnesses in Fig.5, but the early and intermediate types show no segregation. The scalelengths also gives no segregation according to type. Very few late-type galaxies with very short scalelengths were selected, but as shown before, late-type galaxies have lower surface brightnesses and the selection biases against galaxies with low surface brightness and short scalelengths are large. These biases are indicated by the dotted lines in Fig.5. To the right of these lines the sample should be complete to the indicated distance. The lines are calculated under the assumption that all galaxies have perfect exponential disks with the same color at the selection radius (–, –) and that the selection limit is at 2′ diameter at the 24.7 -mag arcsec-2 isophote (as in Fig.2). Although these assumptions are not valid for an individual galaxy, the dotted lines help to estimate the selection effects; the galaxies near the 50 Mpc line had about 125 times more chance of being included in the sample than the galaxies near the 10 Mpc line! The fact that the number density of objects does not decrease by 125 from one line to the other already indicates that there are many more “small” galaxies per volume element than “large” galaxies.
The distribution of the absolute magnitude of the disk () against type (Fig.6) can also be deduced from Figs3 and 4 (, no inclination dependent extinction correction was applied). As scalelengths show little correlation with type, the distribution of disk magnitudes reflects the distribution of the central surface brightness against type. There was no apparent segregation according to bar classification in Figs3, 4, 5 and 6.
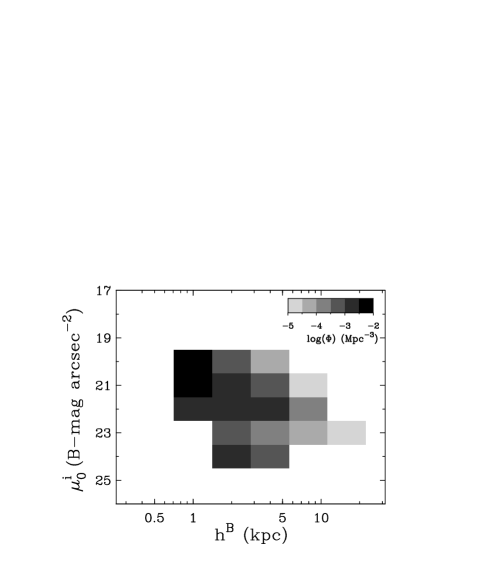
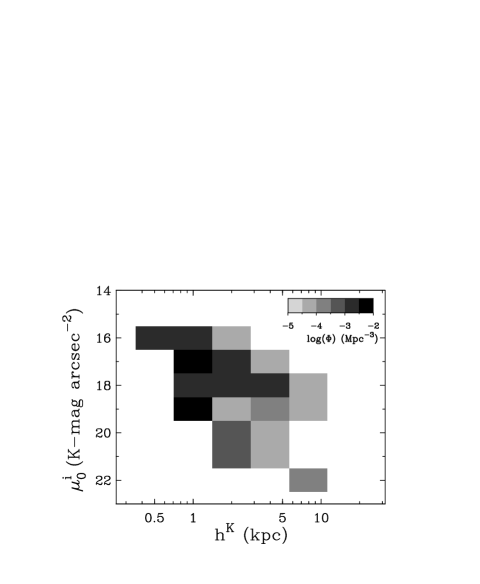
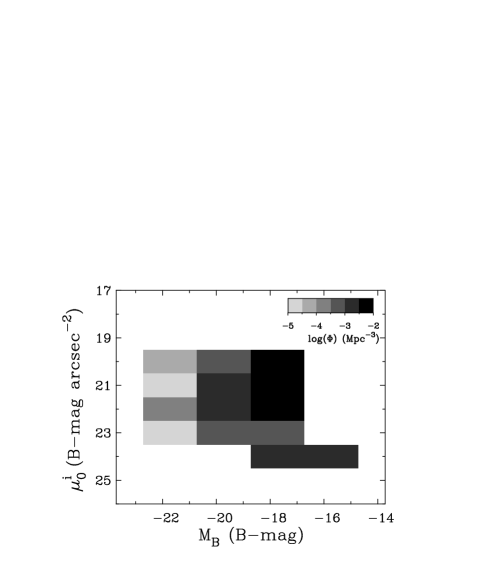
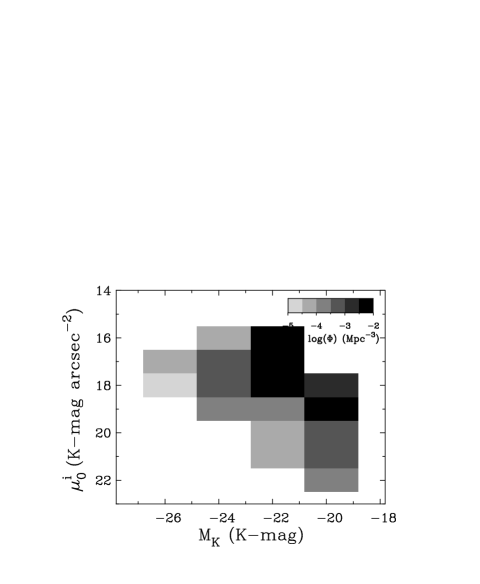
So far, only the observed distributions were presented, but the distributions per volume are of more importance. Therefore the volume correction as described in Sect.3 was applied. The correction transforms Fig.5 into the bivariate distribution in the (,)-plane presented in Fig.7. This is a representation of the true number distribution of spiral galaxies per volume element of one Mpc3 with respect to both disk parameters. The magnitude and upper limits noticed in Fig.5 are also present here. We are dealing with low number statistics now, which is reflected in the erratic behavior of the distribution. The uncertainty increases in the direction of small scalelength and low surface brightness. These galaxies have so small isophotal diameters that they really have to be nearby to be included in the sample and such a small volume is sampled that statistics are working against us. For example if the true volume densities in the (17 -mag arcsec-2, 1 kpc) and (21 -mag arcsec-2, 1 kpc)-bins are equal, the chance of observing a galaxy in the last bin would be 0.5. If there had been such a galaxy in the sample, a lot of weight would have been given to it. In short, the distributions are not well sampled in the low surface brightness, small scalelength region. No galaxies were selected in this region, but the traced volume is also very small. The dominant type of spiral galaxy has a scalelength of about 1 kpc and a central surface brightness of 21-mag arcsec-2 (17-mag arcsec-2).


By summing all bins in one direction, the bivariate distributions of Fig.7 can be used to calculate the distributions of and separately. This figure indicates therefore where one can expect problems in the determinations of the and distributions due to the undersampling in the low surface brightness, small scalelength region. The distributions will get incomplete for central surface brightnesses fainter than 21.5 -mag arcsec-2 (19 -mag arcsec-2) and the distributions should not be trusted for scalelengths smaller than 1 kpc. The undersampling in the distribution is considerably reduced when only the galaxies with scalelength larger than 1 kpc are used. The undersampling problem of this sample could also be circumvented by imposing absolute magnitude or intrinsic diameter limits. To speak of the distribution is incorrect and one should indicate to what type of galaxies the sample is restricted.
The distributions of central surface brightnesses of galaxies with scalelength larger than 1 kpc are displayed in Fig.8. The distributions are remarkably flat for the total sample. The number density density decreases by about a factor of 4 from to 24 -mag arcsec-2 and by a factor 10 from 17.5 to 22 -mag arcsec-2. The distributions are narrower when only types earlier than T=6 are used. Disks of late-type galaxies are bluer, which makes the overall distribution narrower in than in . The distributions are not limited by selection effects at the bright end, even if one assumes there is an upper limit to the total luminosity of a galaxy (see Fig.5). The number density of galaxies decreases sharply with brighter than 20 -mag arcsec-2 (16 -mag arcsec-2). At the faint end a limited volume is sampled, and Fig.5 indicates that the sample is biased against galaxies with a fainter than 23 -mag arcsec-2 even for galaxies with scalelength larger than 1 kpc. Obviously galaxies with central surface brightness fainter than 26 -mag arcsec-2 could never enter the sample. The distributions of in Fig.8 could be slightly higher at the faint end and should probably be extended to much lower surface brightnesses.
The volume corrected distributions of the logarithm of the scalelengths (Fig.9) show first a small increase of galaxies to scalelengths of about 1 kpc. This is probably caused by the undersampling effect at low surface brightnesses and small scalelengths. For scalelengths larger than 1 kpc we notice a steady decline of about a factor 100 in one dex. There is no segregation with morphological type.


The most important results obtained in this subsection are as follows. There is a large range in disk central surface brightnesses among galaxies, mainly due to the lower surface brightnesses of late-type galaxies. The range decreases slightly when a transparent inclination correction is used. Selection effects are very significant in determining number density distributions and after correcting for these effects there is no single preferred value for the central surface brightnesses of disks. There is an upper limit to , but the number density distribution decreases only slowly at the faint end.
4.2 The bulge parameters
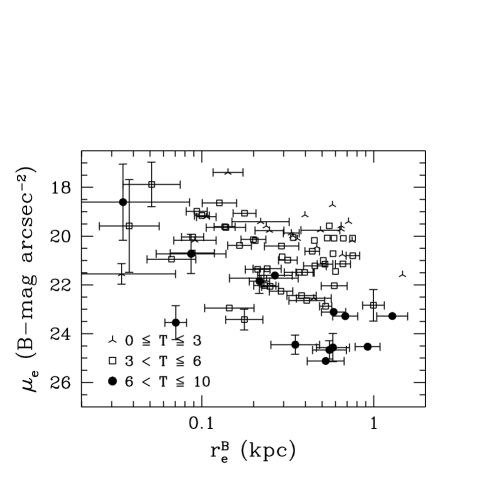
The same diagrams used to describe the disk parameters are now used to present the bulge parameters. The distributions of effective surface brightness are presented in Fig.10. The effective surface brightness shows a tight correlation with type index, especially considering the uncertainty of at least 1.5 T-units (1 sigma) in type index (Lahav[1995]). Almost all of the scatter can be explained by this uncertainty. This relation also holds for the parameters obtained with the other fitting methods presented in PaperII, although with a slightly larger scatter. There is no apparent correlation of effective radius with galaxy type (Fig.11). The relations in Figs10 and 11 are tighter in than in . There are several explanations for this effect. Bulges are relatively brighter with respect to the disks in compared to , which will make the fit routine work better. Furthermore, circumnuclear star formation and dust lanes will affect the passband more than the passband and make the quality of the decomposition worse. There are some galaxies in the sample with clear circumnuclear star formation and with dust lanes right down to the center. Finally, there is the effect of the Freeman TypeII profiles (Freeman[1970]) which is reduced in , thus making fitting easier (see PaperII). The distribution of points in the (,)-plane (Fig.12) shows no correlation. The absence of a correlation between and morphological type makes the trend in the distribution of the absolute bulge magnitude () versus type (Fig.13) dominated by the .


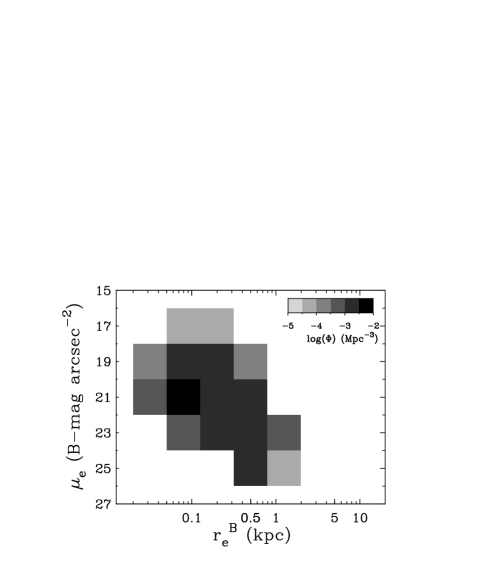
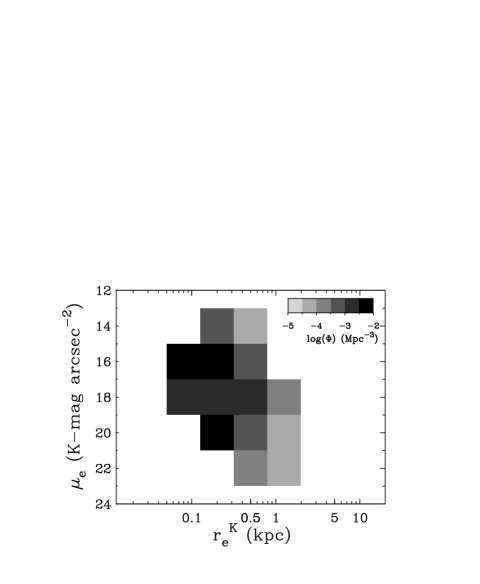
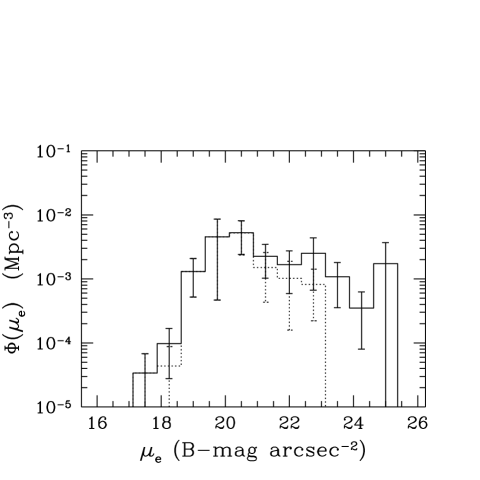


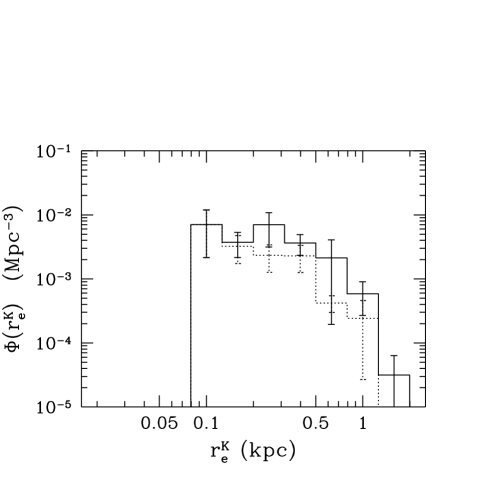
The bivariate distribution of and (Fig.14) shows no trends. The dominant type of galaxy in our local universe has a bulge with effective radius in the range of 0.1-0.3kpc and effective surface brightness of order 21 -mag arcsec-2 (16 -mag arcsec-2). The relation between the bulge parameters and the diameter selection criterion is not very obvious and therefore all galaxies are used in the calculations of the separate bulge parameter distributions. The volume corrected distributions of the bulge and (Figs15 and 16) show the same behavior as the disk parameters, i.e. constant distribution of the effective surface brightness and a steady decline of a factor of 50-100 per dex of the effective radius in the passband.
4.3 The bulge/disk relation
The chronology of the bulge and disk formation is a major issue and the relationships between bulge and disk parameters might give some insight in this matter. A strong correlation between bulge and disk parameters is expected if the bulge formed from the disk by secular evolution. A correlation might be expected in the hierarchical infall and small merger models producing bulges, because both bulge and disk originate from the same smaller components. In models where the bulge forms first and the disk forms later, there is no obvious reason for a bulge-disk correlation.


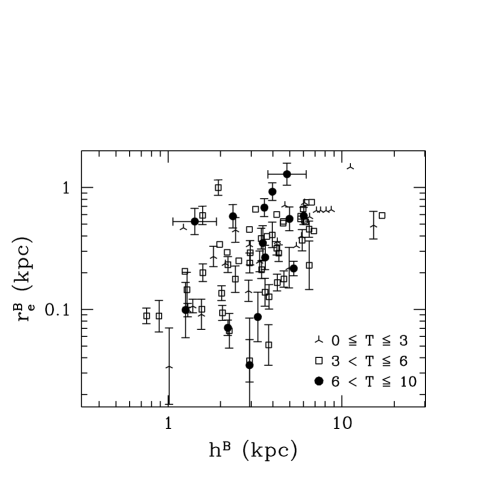


Comparing the with (Fig.17) we see no correlation, except that the late-type spirals clearly stand out. This is most obvious in the passband. The correlation between and (Fig.18) is only tight in the passband and not in the passband. Actually the correlation is becoming steadily tighter from the to the passband with correlation coefficients increasing from 0.6 in and to in and and in and passbands. The equation for the least squares fitted line is in the passband
| (5) |
with a standard deviation of 0.17. The scalelength difference between bulge and disk thus is of order 10. The relation also holds for all the 1D fit techniques presented in PaperII (but less strongly) except for the case of an law bulge. In the case of 1D law bulge there is at best a weak trend (correlation coefficient 0.15). This relation could partly be produced by the fitting routine if the errors in both parameters are intrinsically correlated. The facts that this relation holds in the but not in the passband and for both of the totally different 1D and 2D fitting techniques indicate that the correlation is intrinsic and not an artifact of the fit routines. The distribution around the solutions found by the fit routine also showed no correlation with the relationship between disk scalelength and bulge effective radius.
The absolute magnitudes of bulge and disk correlate well (Fig.19). This is probably an example that large galaxies have more of everything, more bulge, more disk. The combined effect of good correlation between and and weak correlation between and ensures the correlation between and . Looking at the bulge-to-disk ratio as function of morphological type (Fig.20), one sees that there is a correlation, but this correlation is less strong than for instance the one of with type (Fig.10). The B/D ratio is on average higher in than in ; bulges are redder than disks. This partly explains why the correlations which involve bulge parameters are tighter in . The bulge/disk decomposition is more easily performed when the bulge is relatively brighter.
Fig.20 shows also that the selected galaxies are indeed disk dominated systems. The B/D ratios plotted here are much smaller than the ratios normally found in the literature. This is mainly due to the use of an exponential bulge. In Fig.21 the results with an law bulge (PaperII) are shown. The B/D ratios are higher, but the scatter has increased and there still is no tight correlation with morphological type.
5 Discussion
In this section I will place the previously described relations in the context of the three topics of main interest: 1) Freeman’s law, 2) bivariate distributions and 3) the relation between Hubble classification and the structural parameters.
5.1 Freeman’s law
Since Freeman[1970] found disk central surface brightnesses to be constant among spiral galaxies, a number of explanations have been brought forward. In the introduction three explanations were mentioned: 1) optically thick dust, 2) erroneous measuring of the disk parameters from the light profiles and 3) selection effects. For each of these possibilities I check if they are of importance for the current sample and whether they can explain Freeman’s result.
5.1.1 Optically thick dust
It has been suggested that optically thick dust could be the cause of Freeman’s law (Jura[1980]; Valentijn[1990]; Peletier et al.[1994]). This is only a partial explanation, because it removes the inclination dependence from the law. To produce Freeman’s law in this way, galaxies must have the same surface brightness at (where the typical surface brightness is produced in an optically thick system), which means the problem is only shifted from one part of the galaxy to another. One now has to explain why all galaxies have the same surface brightness at . Taking a constant dust-to-stellar light ratio will not produce a constant surface brightness. This is only the case if all dust is in front of the star light, but dust and stars are mixed in a galaxy and a fraction of stars to the near side is less obscured. The amount of extinction in a galaxy is not linearly dependent on the amount of dust present (de Jong[1995c]). Coupling the amount of dust and stars in galaxies can only reduce the scatter in , but can never produce a constant .
I have shown that applying the inclination correction of Eq.(1) reduces the scatter in the of the disk going from to (Table1), indicating transparent behavior. The effect is small and the scatter is still dominated by the intrinsic differences in the brightnesses of the disks. One should realize that the disk parameters are largely determined by the outer regions of the galaxy. They probably do not reflect the optical thickness of the central regions. I note again that galaxies can behave optically thin in an inclination test, while in fact being optically thick.
The passband data should hardly be affected by dust extinction. Looking at Table1 one can see that the standard deviation of is for the early-type galaxies smaller in the passband than in the passband, contrary to what is expected for optically thick dust. The increase in standard deviations for the later types can be explained by stellar population differences (PaperIV). I conclude that dust extinction is not a major effect in Freeman’s law, certainly not in the passband data used here.
5.1.2 Erroneous profile fitting
Kormendy ([1977]), Phillipps & Disney ([1983]) and Davies ([1990]) have argued that Freeman’s law results from fitting exponential disks to light profiles without taking the bulge contribution to the profiles into account. To prove their point, they created model profiles with law bulges and exponential disks with a range of properties, to which exponential disks were fitted in a specified range. These models were able to reproduce Freeman’s “universal” central surface brightness value of 21.65 -mag arcsec-2 with just a small scatter.
The parameter space explored in the models is not very physical according to current insights. Kormendy([1977]) used B/D ratios of 1–120 for the low surface brightness systems and Phillipps & Disney([1983]) assumed that bulges were so extended that they dominated the light profiles again at the 24.5 -mag arcsec-2. Davies ([1990]) used a range of properties for the bulge parameters which are typical in samples of galaxies, which suffer from severe selection effects. He used a constant central surface brightness of the bulge to show that the central surface brightnesses of disks need not be constant. A change in ratio was used to produce a range in bulge-to-total light ratios (). I have shown that is not constant (Fig.10) and that the ratio is nearly constant (Fig.18). Even though these results where obtained with a exponential rather then a law bulge, a constant central brightness for bulges is excluded and a relationship between and might be expected.
I use the parameterization of Davies([1990]) to show that erroneous bulge/disk decomposition is not a major factor in the Freeman law. Figure22 was produced in the same way as Davies’ Fig.6 by fitting exponential profiles in the range of 22 to 25.5 mag arcsec-2 to model profiles, which were a combination of an law bulge and an exponential disk. In this figure the intrinsic of the model profile is compared with the central surface brightness of the fitted disk (). The ratio was taken fixed to 0.4 and was adjusted to produce ratios in the range from 0.05 to 0.75 in steps of 0.1 (contrary to Davies, who used a fixed and varied the ratio). The tendency to shift intrinsic bright disks to the observed value of 21.65 mag arcsec-2 has disappeared. The low surface brightness disks have too bright values for their , but these were clearly fitted in the curved part of the profile at the brighter end. From Fig.22 one can conclude that it is unlikely that the high surface brightness disks were underestimated (even with using the “marking the disk” fit of PaperII). The situation for LSB systems is not as bad as it seems, because the B/D ratios are low for LSB galaxies and the curvature of the profiles can be readily seen. Choosing values for / in the range from 0.1 to 1 hardly changes these results.

The central surface brightnesses of the galaxies were determined in PaperII with a full 2D decomposition technique, but also with the “marking the disk” technique and a few 1D decomposition techniques. If Freeman’s result was caused by his use of the “marking the disk” method, the central surface brightnesses obtained with this method should show large and systematic differences with the results of the other methods. In PaperII it was shown that making a proper decomposition of the profiles in a law bulge and an exponential disk adds a scatter of at most 0.4 mag arcsec-2 to with respect to the “marking the disk” results. Assuming that about the same value would hold for Freeman’s sample, this would still result in a rather small range in for his sample. In PaperII it is furthermore argued that the 2D decomposition technique, using exponential light profiles for both disk and bulge, is more accurate and reduces the rms difference between the “marking the disk” method and the 2D fit to 0.3 mag arcsec-2. Both the model decompositions using Davies’ method and the comparisons between different decomposition methods of real galaxies indicate that it is unlikely that Freeman’s results were caused by improper decompositions.
5.1.3 Selection effects
After taking selection effects into account, Fig.8 shows that there is no such thing as a simple Freeman’s law for galaxies with scalelengths larger than 1 kpc. There seems to be a clear upper limit to the central surface brightness, which cannot be explained by selection effects. Even taking the apparent upper limit in absolute luminosity in Fig.5 into account, there still should have been galaxies with brighter than 20 -mag arcsec-2 (16 -mag arcsec-2) in the sample according to this figure. Figure8 shows further that there is no strong decrease in the number of galaxies with lower surface brightness. The distribution becomes narrower if we exclude late-type spirals, but this exclusion can hardly be justified. Late-type spirals are in many respects no separate class of galaxies, but just a continuation of the trends set by the earlier type spirals. A clear example of such a trend is seen in Fig.10.
In PaperII it was shown that there is at most 0.30 mag arcsec-2 rms uncertainty in the central surface brightnesses. The uncertainties also showed no correlation with the surface brightness itself (PaperII, Fig.4) and the results presented here can therefore not be the results of measurement errors. The central surface brightness distribution of Fig.8 changes in some details if one of the other fit techniques of PaperII is used, but the general trend remains unchanged. The same holds true when the distances of the galaxies are calculated with other flow models.
Sample selections are influenced by both and and therefore the most important distribution for disk dominated galaxies is the bivariate distribution in the (,)-plane (Fig.7). These two parameters describe a large fraction of the light of disk dominated galaxies and to derive this distribution one needs distances. To derive the distribution of of sample of galaxies without knowing the distance to the galaxies, one must assume that the distribution of is not correlated to for instance or (Davies et al.[1994]; McGaugh et al.[1995]). The total distribution can only be calculated in this statistical way if the distribution at each or at each has the same shape. Figure7 shows that this is probably not the case for and Figure23 shows the same for . The statistical methods can at best only be used to get an impression of the distribution.
5.2 Bivariate distributions
The reason for our limited knowledge of low surface brightness galaxies is clearly indicated by the selection lines in Fig.5. The use of catalogs like the UGC prevents galaxies with central surface brightness fainter than 25 -mag arcsec-2 from being included in a sample, independent whether the sample is diameter or magnitude selected. Only the use of deeper photographic plates enabling a selection at fainter isophotes (Schombert et al.[1992]) or deep CCD surveys will result in samples with a larger number of low surface brightness galaxies. A galaxy like MalinI (Impey & Bothun[1989]), with -mag arcsec-2 and kpc, is not found in conventional catalogs, even though it has an integrated magnitude comparable to M 101 and a 10 times as a large scalelength as M 101. Figure7 indicates that galaxies like MalinI are probably not very numerous in the local universe, but this cannot be said of galaxies with -mag arcsec-2 and kpc. There is a clear need for deeper local surveys, especially in the near-IR.
Few bivariate distributions have appeared in the literature which can be used in comparisons with the current results. Van der Kruit ([1987]) calculated a bivariate distribution of spiral galaxies in the (-)-plane. His distribution shows similar features as the distribution presented here. The distribution has an upper limit in central surface brightness at about 21 -mag arcsec-2(photographic passband, which is similar to the Johnson passband) and an exponentially declining density distribution with scalelength.
Another comparison can be made with the bivariate distribution of van der Kruit ([1989]). This distribution was constructed in exactly the same way as Fig.7, with only a modification to Eq.(3) to include the effects of an additional magnitude selection limit. The central surface brightnesses were convolved with a Gaussian of 0.3 mag arcsec-2 to incorporate the effects of calibration uncertainty. This explains the smoothness of the distribution. The galaxies of type later than T5 were excluded and a Hubble constant of 75 km s-1 Mpc-1 was used. The same upper limits in absolute magnitude and central surface brightness can be seen as in Fig.5. There is only one galaxy with brighter than 18-mag arcsec-2 at 0.7(100/75) kpc. The general trend in the bivariate distribution of van der Kruit agrees quite well with Fig.7, with equal probabilities along lines of equal absolute luminosity.
The luminosity function of galaxies is a tool often used to investigate galaxy evolution on cosmological time scales. This makes sense as the total luminosity of a galaxy seems, also by use of the TF-relation, related to the total mass of a galaxy. In determining the local LF one has sometimes failed to notice that galaxies are extended and that for selection correction one should not treat them as point sources. This can lead to a change in the slope of the LF as function of redshift and results in the faint blue galaxy problem (McGaugh[1994]). Another disadvantage of the one-dimensional LF is that each luminosity bin contains galaxies with totally different surface brightnesses and scalelengths (Fig.5). The physical processes in disk galaxies seem to be more related to surface brightness than to total mass (see also PaperIV). Therefore, to investigate the distributions related to both the total mass and the surface brightness, the luminosity function has been divided in several central surface brightness bins in Fig.23. The absolute magnitudes were calculated from the values given in PaperI. Figure23 shows the bivariate distribution of a local sample of galaxies and can be useful as a reference for high redshift samples observed with the Hubble Space Telescope.
Figure23 shows that the LF is more or less the same for all central surface brightness bins in the passband. In the passband something becomes apparent which was already hinted at in the passband. The LF for fainter central surface brightnesses is lower and/or shifted to lower absolute luminosities. Figure23 is somewhere in between both options presented in Fig.3 of McGaugh([1994]), which means that both the shape of the LF and its normalization depend on the bivariate distribution of and . Unfortunately, this data is too scarce to make a firm quantitative statement, but it is clear that further attention should be given to “the LF”.
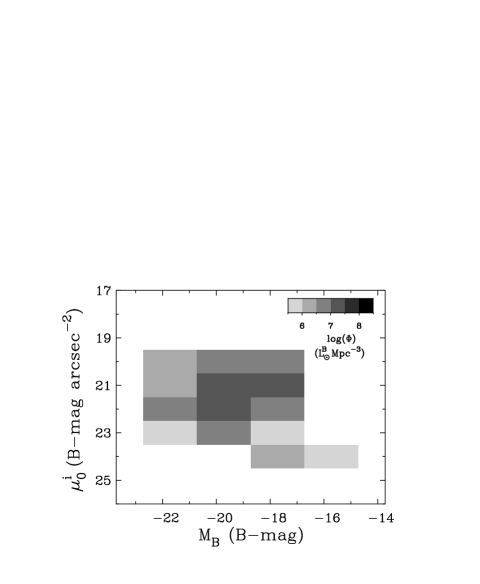
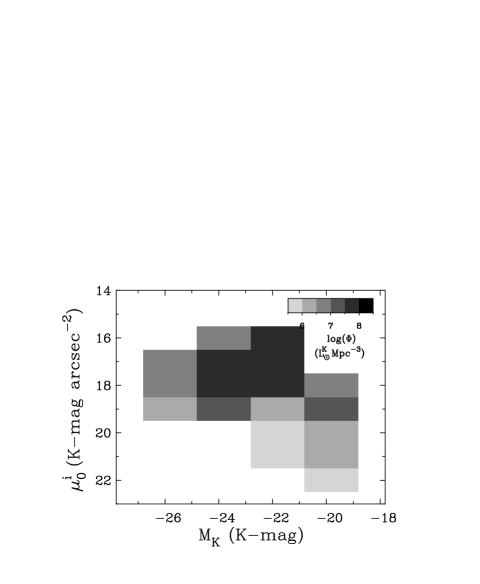
At least as important as the number density of the local universe is the local luminosity density, which can be transformed in a luminous mass density using an description. In order to calculate the luminosity density, the number density value of each galaxy used in Fig.23 was given an additional weight depending on its absolute luminosity, which results in Fig.24. This figure shows the total luminosity one expects to find in a random Mpc3 from galaxies in the indicated bins of (,). The luminosities are expressed in solar luminosities per passband, calibrated using the absolute solar luminosity values of Worthey ([1994]).
The distribution in the passband is remarkably flat, almost all bins that contain galaxies are equal to within 1.5 order of magnitude. In the passband distribution there is more structure, as most of the passband light in the local universe comes from higher surface brightness galaxies. Due to the scarceness of the data, this figure is again more of qualitative than of quantitative interest.
5.3 Hubble classification
The Hubble sequence is one of the basic ingredients of galaxy formation and evolution schemes, even though the underlying physical processes are only partly understood. In this section I describe the consequences of some of the relations between the structural parameters and Hubble type as presented here.
Figure20 showed that B/D ratio cannot be used to determine the Hubble type of face-on systems, which means that the classification of edge-on systems is different from that of face-on systems. Furthermore, the B/D ratios seem to be quite small (), even in the passband where the differences in color (and ) due to stellar population effects between disk and bulge are minimized. The B/D ratios are larger when law bulges are used. The difference between exponential and law bulges in terms of generalized exponential profiles is extensively discussed in PaperII. Young & Curry ([1994]) showed that for ellipticals and dwarf ellipticals there is a trend in profile shape with luminosity. The brighter ellipticals have like profiles, while fainter (dwarf) ellipticals have more exponential like profiles. If this is also true for bulges, we might expect early-type spirals to have more centrally peaked bulge profiles than later type spirals. In PaperII it was found that law bulges gave smaller residuals for T3 than exponential bulges. This picture conflicts with the scale independence of Hubble type as seen in the passband data of Fig.18. Within one Hubble type, a range in integrated bulge luminosities exists, which should result in different profiles when the model of Young & Curry ([1994]) is applied to bulges. There is a weak indication for this trend, because the galaxies with the brightest bulges are slightly better fitted by the law bulges than by the exponential bulges. The law bulges never give the smallest residuals, not even for the most luminous bulges.
Using an exponential bulge, an important relation is found, which is not apparent if an law bulge is used: correlates with , but these parameters do not correlate with Hubble type (Fig.18). This is an important relation as it makes the Hubble sequence scale free. Each Hubble type comes in a range of different sizes, both in terms of diameter and total luminosity. It is an example of larger (in the sense of scale size, not mass) galaxies having more of everything, larger disk, larger bulge. Due to this correlation the scale parameters cancel each other out in calculating B/D ratios, which means that a plot of – (, important in density wave models) versus type looks like Fig.20 with a different scaling. Consequently – is also a bad diagnostic for Hubble type.
The relationship between Hubble type and (Fig.10) holds, independent of bulge profile function used. In fact the relation holds if one just fits a line to the central region of the profile and uses the true central surface brightnesses, because the bulge generally dominates the luminosity in this central region. One might wonder if in classifying galaxies one has mainly looked at the surface brightness of the bulge and not at the B/D ratio. For the earlier systems this is harder to accept; the central regions are in general overexposed on photographic plates used for classifying. It is instructive to know that S0 galaxies do not fit in this relation. The central surface brightnesses of S0 galaxies range from 17.7 to 19 -mag arcsec-2, estimated from the data of Kormendy ([1977]) and Peletier et al.([1990]). This translates to effective surface brightnesses in the range of 19.5-21-mag arcsec-2, in accordance with the two S0 galaxies in the current sample, but significantly below the trend of the rest of the spiral galaxies (Fig.10).
If B/D ratio is such a bad diagnostic for Hubble type, we are left according to Sandage([1961]) with only two other classification discriminators: 1) the spiral arm structure, 2) the pitch angle of the arms. The two remaining criteria indicate that the Hubble sequence should be explained in terms of spiral arm appearance, even though the second criterion might also be in doubt, as measurements by Kennicutt ([1981]) showed that pitch angle has no tight correlation with morphological type.
The main theory on spiral structure is the spiral density wave theory (Lin & Shu[1964]; Roberts et al.[1975]). The fact that Hubble type is a scale free quantity fits into this theory. When the bulge and the disk scale with the same amount, the shape of the rotation curve stays the same, only its amplitude changes. This means that the shape of the resonances also scale along with the scalelength changes. If bulge and disk scalelengths are correlated, the shape of the rotation curve is fully determined by the relative brightness of the bulge and disk component. Therefore it is harder to understand in the density wave theory, why Hubble type does not correlate tightly with B/D ratio (Fig.20), or to be more precise with –. The strength and the pitch angle of the density wave gets modified by the ratio of mass that participates in the density wave to the mass that does not. If B/D ratios are so small that they hardly could affect the density wave (Fig.20) and if on top of that the B/D ratios and – values are only weakly correlated with Hubble type, it seems that some modifications to the standard density wave model are needed. Maybe a connection between the of the bulge and the distribution of dark matter can solve this problem.
6 Conclusions
The statistics of the fundamental parameters of 86 spiral galaxies have been studied in the optical and the near-IR. The use of the near-IR passband enabled for the first time determination of these parameters without being hampered by the effects of dust extinction and differences in stellar populations. Volume density distributions with respect to the fundamental parameters were made, which was possible due to the careful selection of the sample. The main conclusions are as follows:
-
–
Freeman’s law of a preferred disk central surface brightness value needs a modification. Although there seems to be a clear upper limit to the central surface brightnesses of galaxies, there is no clear limit at the faint end of the distribution. The number of galaxies in a volume with a certain is only slowly declining function of .
-
–
The bulge and disk scalelengths are correlated, parameterised by . This correlation suggests that the formation of the bulge and the disk is coupled.
-
–
The Hubble classification is related to the surface brightness properties of spiral galaxies. However, the relations are in general not very tight and can therefore not be turned around to give morphological classification. The B/D ratio is not a good indication of Hubble type (Fig.20and21). The best relation with Hubble type found in this study is the one with (Fig.10). The physical interpretation is difficult, because cause and effect are hard to separate.
-
–
Hubble type is a scale size independent parameter, but not a total luminosity independent parameter of a galaxy. Therefore, it would be better to divide by scale size instead of luminosity to derive scale independent parameters of galaxies in comparisons. The suggestion that Hubble type is mainly driven by total mass (Zaritsky[1993]) seems an oversimplification. To carry this point a bit further, it is probably better to separate the determination of the LF of galaxies into bins which are related to the effective surface brightness (like Fig.23) than into bins which are related to Hubble type.
Larger samples are needed to enable the parameterization of the bivariate distributions. There is especially need for accurate surface photometry of a large sample of galaxies, selected from deep photographic plates providing isophotal diameters at very faint levels.
-
Acknowledgements.
I thank Renée Kraan-Korteweg for providing her Virgo-centric inflow computer model. Piet van der Kruit and Reynier Peletier are thanked for the many fruitful discussions. Erwin de Blok, René Oudmaijer, David Sprayberry and Arpad Szomoru are acknowledged for their many useful suggestions on the manuscript. This research was supported under grant no.782-373-044 from the Netherlands Foundation for Research in Astronomy (ASTRON), which receives its funds from the Netherlands Foundation for Scientific Research (NWO).
References
- 1994 Andredakis Y.C., Sanders R.H. 1994, MNRAS 267, 283
- 1979 Allen R.J., Shu F.H 1979, ApJ 227, 67
- 1981 Boroson T.A. 1981, ApJS 46, 177
- 1984 Burstein D., Heiles C. 1984, ApJS 54, 33
- 1994 Byun Y.I., Freeman K.C., Kylafis N.D. 1994, ApJ 432, 114
- 1985 Choloniewski J. 1985, MNRAS 214, 197
- 1990 Davies J.I. 1990, MNRAS 244, 8
- 1994 Davies J., Phillipps S., Disney M., Boyce P., Evans Rh. 1994, MNRAS 268, 984
- 1995a de Jong R.S. 1995a, submitted to A&A (PaperII)
- 1995b de Jong R.S. 1995b, in preparation (PaperIV)
- 1995c de Jong R.S. 1995c, Ph.D.Thesis, University of Groningen, The Netherlands
- 1994 de Jong R.S., van der Kruit P.C. 1994, A&AS 106, 451 (PaperI)
- 1948 de Vaucouleurs G. 1948, Ann. d’Astrophys. 11, 247
- 1974 de Vaucouleurs G. 1974, in The Formation and Dynamics of Galaxies, IAU Symp.58, ed. J.R.Shakeshaft (Reidel, Dordrecht), p.1
- 1991 de Vaucouleurs G., de Vaucouleurs A., Corwin H.G., Buta R.J. et al. 1991, Third Reference Catalog of Bright Galaxies (Springer-Verlag, New York) (RC3)
- 1976 Disney M.J. 1976, Nature 263, 573
- 1983 Disney M.J., Phillipps S. 1983, MNRAS 205, 1253
- 1988 Efstathiou G., Ellis R.S., Peterson B.A. 1988, MNRAS 232, 431
- 1976 Felten, J.E., 1976, ApJ 207, 700
- 1966 Freeman K.C. 1966, MNRAS 133, 47
- 1970 Freeman K.C. 1970, ApJ 160, 811
- 1978 Freeman K.C. 1978, in Structure and Properties of Nearby Galaxies, IAU Symp.77, eds: E. Berkhuysen and R. Wielebinski (Reidel, Dordrecht), p.3
- 1994 Giovanelli R., Haynes M.P., Salzer J.J., Wegner G., Da Costa L.N., Freudling W. 1994, AJ 107, 2036
- 1985 Grosbøl P.J. 1985, A&AS 60, 261
- 1989 Impey C, Bothun G. 1989, ApJ 341, 89
- 1980 Jura M. 1980, ApJ 238, 499
- 1981 Kennicutt Jr. R.C. 1981, AJ 86, 1847
- 1977 Kormendy J. 1977, ApJ 217, 406
- 1986 Kraan-Korteweg R.C. 1986, A&AS 66, 255
- 1995 Lahav O., Naim A., Buta R.J, Corwin H.G., de Vaucouleurs G. et al. 1995, Science 267, 859
- 1964 Lin C.C., Shu F.H. 1964, ApJ 140, 646
- 1994 McGaugh, S.S. 1994, Nat 367, 538
- 1995 McGaugh, S.S., Bothun D.B., Schombert J.M. 1995, MNRAS, in press
- 1973 Nilson P. 1973, Uppsala General Catalog of Galaxies (Roy.Soc.Sci., Uppsala) (UGC)
- 1990 Peletier R.F., Davies R.L., Davis L.E., Illingworth G.D., Cawson M. 1990, AJ 100, 1091
- 1994 Peletier R.F., Valentijn E.A., Moorwood A.F.M., Freudling W. 1994, A&AS 108, 621
- 1983 Phillipps S., Disney M.J. 1983, MNRAS 203, 55
- 1986 Phillipps S., Disney M.J. 1986, MNRAS 221, 1039
- 1985 Rieke G.H., Lebofsky M.J. 1985, ApJ 288, 618
- 1975 Roberts Jr. W.W., Roberts M.S., Shu F.H. 1975, ApJ 196, 381
- 1961 Sandage A. 1961, The Hubble Atlas of Galaxies (Carnegie Inst. of Washington, Washington DC)
- 1990 Saunders W., Rowan-Robinson M., Lawrence A., Efstathiou G., Kaiser N., Ellis R.S., Frenk C.S. 1990, MNRAS 242, 318
- 1992 Schombert J.M., Bothun G.D., Schneider S.E., McGaugh S.S. 1992, AJ 103, 1107
- 1986 Simien F., de Vaucouleurs G. 1986, ApJ 302, 564
- 1993 Sodré L.Jr., Lahav O. 1993, MNRAS 260, 285
- 1977 Tully R.B., Fisher J.R. 1977, A&A 54, 661
- 1990 Valentijn E.A. 1990, Nat 346, 153
- 1987 van der Kruit P.C. 1987, A&A 173, 59
- 1989 van der Kruit P.C. 1989, The distribution of properties of galaxies. In: Gilmore, G., King, I., van der Kruit, P.C., The Milky Way as a Galaxy (Geneva Observatory, Sauverny-Versoix, Switzerland), p.263
- 1994 Worthey, G. 1994, ApJS 95, 107
- 1994 Young C.K., Currie M.J. 1994, MNRAS 268, L11
- 1993 Zaritsky D. 1993, PASP 105, 1006