The Detection of Far Ultraviolet Line Emission from Balmer-Dominated Supernova Remnants in the Large Magellanic Cloud11affiliation: This work is based on data obtained for the Guaranteed Time Team by the NASA-CNES-CSA FUSE mission operated by the Johns Hopkins University. Financial support to U.S. participants has been provided by NASA contract NAS5-32985.
Abstract
We present the first far ultraviolet (FUV) spectra of the four known Balmer-dominated supernova remnants (SNRs) in the Large Magellanic Cloud, acquired with the Far Ultraviolet Spectroscopic Explorer (FUSE). The remnants DEM L 71 (SNR 050567.9), SNR 050967.5, SNR 051969.0 and SNR 054870.4 are all in the non-radiative stages of evolution and exhibit expansion speeds ranging from 500 km s-1 to 5000 km s-1 . We have detected broad emission lines of Ly , Ly , C III and O VI in DEM L 71 ( 1000 km s-1 ) and have detected broad Ly and O VI emission in SNR 051969.0 ( 3000 km s-1 ). In addition, broad Ly emission ( 3700 km s-1 ) has been observed in SNR 050967.5, the first detection of broad line emission from this SNR. No emission was detected in our FUSE spectrum of SNR 054870.4, allowing us to place only upper limits on the FUV line fluxes. The spectra of these SNRs are unaffected by postshock cooling, and provide valuable probes of collisionless heating efficiency in high Mach number shocks. We have used the F(Ly )/F(1032) flux ratio and relative widths of the broad Ly and O VI lines to estimate the degree of electron-proton and proton-oxygen ion equilibration in DEM L 71, SNR 050967.5 and SNR 051969.0. Although our equilibration estimates are subject to considerable uncertainty due to the faintness of the FUV lines and contributions from bulk Doppler broadening, our results are consistent with a declining efficiency of electron-proton and proton-oxygen ion equilibration with increasing shock speed. From our shock velocity estimates we obtain ages of 295-585 years for SNR 050967.5 and 520-900 years for SNR 051969.0, respectively, in good agreement with the ages obtained from SN light echo studies.
Subject headings:
ISM: supernova remnants: individual (050567.9 (DEM L 71), SNR 050967.5, SNR 051969.0, SNR 054870.4)– ISM: kinematics and dynamics, shock waves1. INTRODUCTION
The proximity of the Large Magellanic Cloud (LMC) (50 kpc; Feast 1991, 1999) and the relatively small extinction along the line of sight to this galaxy (E(B-V) 0.1) make it an excellent laboratory for study in the X-ray and ultraviolet. In particular, the well calibrated distance of the LMC allows us to study both the kinematics of individual supernova remnants (SNRs) (Blair et al. 2006) and properties of the global SNR distribution within this galaxy.
The first systematic X-ray survey of the LMC was performed with the Imaging Proportional Counter of the Einstein observatory (Long, Helfand & Grabelsky 1981) in the 0.15-4.5 keV range. The observations revealed that nearly half of the 97 detected sources exhibited an extended morphology characteristic of SNRs, making these objects the largest class of X-ray sources revealed in the survey. Four of the SNRs identified with Einstein were shown by Tuohy et al. (1982) to exhibit optical spectra consisting almost entirely of faint hydrogen Balmer line emission (i.e., they are ‘Balmer-dominated’). The four remnants 050567.9 (DEM L 71 from the Davies, Elliott & Meaburn (1971) catalogue), SNR 050967.5, SNR 051969.0 and SNR 054870.4 vary widely in age, ranging from a mere few hundred years (SNR 050967.5; Rest et al. 2005) to 10,000 years (SNR 054870.4, Smith et al. 1991).
Balmer-dominated line emission is produced when the expanding SNR encounters low density (0.1-1 cm-3), partially neutral interstellar ISM (Chevalier & Raymond 1978; Bychkov & Lebedev 1979). Due to the high temperature and low density behind the blast wave, the cooling time scale of the gas greatly exceeds the dynamical time scale of these SNRs (they are non-radiative). The hydrogen overrun by the shock is collisionally excited in a thin (1015 cm) ionization zone, producing optical spectra dominated by the Balmer lines of hydrogen (Chevalier & Raymond 1978; Chevalier, Kirshner & Raymond 1980). In the ultraviolet, the spectra are ’Lyman-dominated’. Balmer-dominated shocks are mostly found in young remnants (e.g., SNRs in the Sedov-Taylor stage or younger) of Type Ia explosions. In these objects the survival of significantly neutral, low density ISM gas is likely aided by the lack of strong ionizing radiation and stellar wind from the progenitor star (a white dwarf). X-ray spectroscopy of the reverse-shocked ejecta in the four LMC Balmer-dominated remnants has revealed strong Fe L shell emission (Hughes et al. 2003; Hendrick, Borkowski & Reynolds 2003; Warren & Hughes 2004), confirming the Type Ia origin of these SNRs. These overall characteristics place the four Balmer-dominated LMC remnants into the same class as the well-known Galactic Type Ia SNRs Tycho and SN 1006 (Chevalier, Kirshner & Raymond 1980; Kirshner, Winkler & Chevalier 1987; Smith et al. 1991; Ghavamian et al. 2001), making them the first examples of such remnants identified outside our galaxy.
The hydrogen line emission in Balmer-dominated shocks consists of two components: a narrow component produced by collisional excitation of overrun ambient H I, and a broad component generated when the hot postshock H I produced by charge exchange is collisionally excited. Both broad and narrow component Balmer lines can often be detected in the optical, but interstellar absorption in the ultraviolet completely removes the narrow component Lyman line emission. However, if the broad component Lyman lines are both bright and wide, the profile wings can be detected.
The diagnostic utility of the broad H I lines is twofold. First, the width of a broad H I line gives the postshock proton temperature, thus yielding an estimate of the shock speed when combined with the Rankine-Hugoniot jump conditions (Chevalier, Kirshner & Raymond 1980; Smith et al. 1991; Ghavamian et al. 2001). Second, comparing the width and flux of the Lyman lines with those of ultraviolet resonance lines such as O VI 1032, 1038 and C III 977 yields an estimate of the ion-ion temperature equilibration at the shock front, well before the equipartition of energy between the different ionic species by Coulomb collisions (Hester, Raymond & Blair 1994; Raymond, Blair & Long 1995). This is key information for probing the nature of collisionless (plasma) heating processes at the shock front, one of the central problems in understanding high Mach number shocks in many astrophysical settings.
The availability of broad hydrogen, carbon and oxygen emission lines, along with high quality X-ray spectra from Chandra provides us with an invaluable opportunity to simultaneously study both the electron-proton and ion-ion equilibration in fast collisionless shocks and the evolution of remnants from Type Ia SNe. In this paper we present FUV spectra of the four Balmer-dominated LMC SNRs. We utilize numerical shock models to interpret the spectra, constrain the kinematics of the four SNRs and investigate collisionless heating processes in fast astrophysical shock waves.
2. OBSERVATIONS AND DATA REDUCTION
2.1. THE RAW DATA
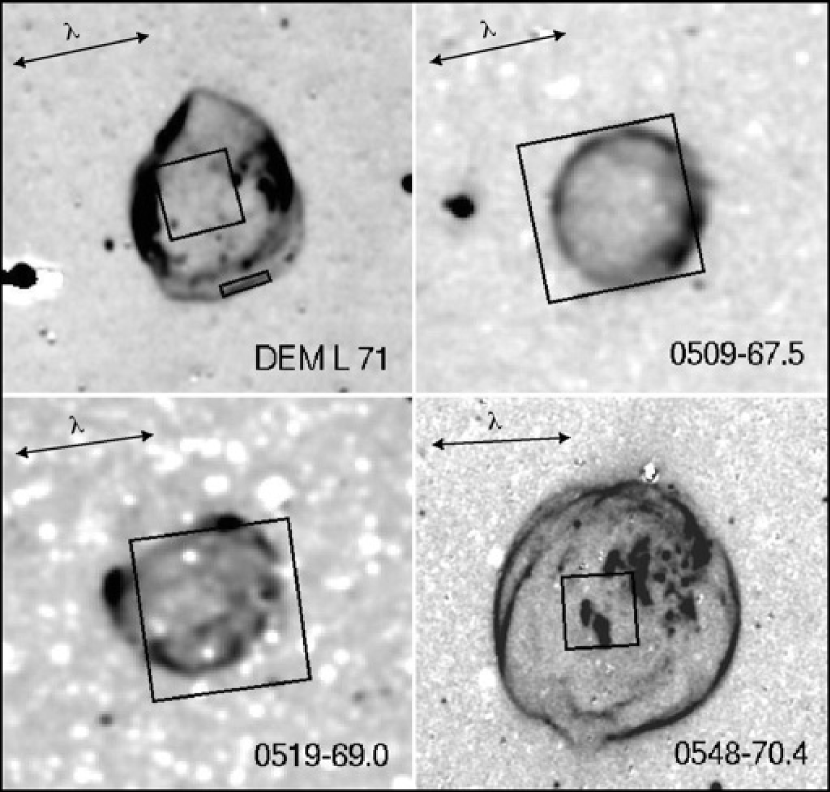
We observed the four Balmer-dominated LMC SNRs with the Far Ultraviolet Spectroscopic Explorer (FUSE) in 2001 September 23 and 24 (see Moos et al. 2000 and Sahnow et al. 2000 for a detailed description of the spectrograph). The data were acquired as part of a Cycle 3 Guaranteed Time Observation program (P214; W. P. Blair, PI), with each remnant observed through the low resolution (LWRS) square aperture of FUSE (30″ 30″). In each case the LWRS aperture was centered on the geometric center of each SNR as measured in the optical by Tuohy et al. (1982). The roll angles of these observations were set by the nominal spacecraft roll at the time of data acquisition. The total integration time and the time obtained during orbital night is listed for each object in Table 1. The Balmer-dominated LMC SNRs vary in size from approximately 30″ across (SNR 050967.5) to 11 across (SNR 054870.4), resulting in significant variations in the fraction of the shell covered in each observation (see Figure 1). While the LWRS aperture covered nearly the entire shell of SNR 050967.5 and SNR 051969.0, it sampled primarily the approaching and receding faces of the shell in DEM L 71 and SNR 054870.4. As we show in the following sections, the fraction of each SNR covered by the FUSE aperture can significantly affect the shapes and centroids of the FUV lines in the final extracted spectra.
We acquired a separate FUSE observation of DEM L71 during Cycle 3 (Guest Observer program C072; PI: P. Ghavamian). In this observation we placed the MDRS aperture (4″ 20″) parallel to the southern edge of the blast wave at a position angle of 113∘ (see Figure 1). The aperture orientations were nearly constant during these observations. A total integration time of 121.6 ks was accumulated during five separate pointings on 2003 January 4-7 (C0720202-C0720205) and 2003 December 29 (C0720206). However, the target acquisition in observation C0720205 failed, leaving 100 ks of useful data.
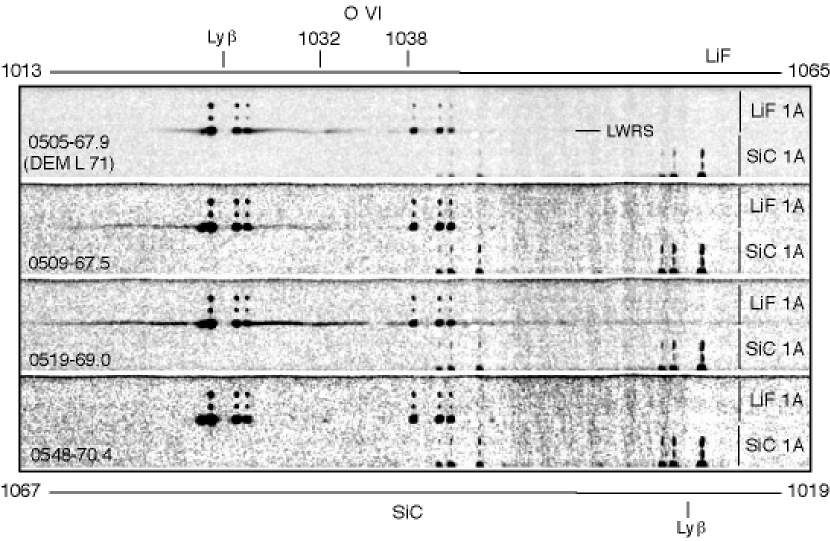
Our data reduction was performed using version 3.1.3 of the CalFUSE pipeline. The expected FUV line emission in the four LMC remnants is expected to be faint (10-13 ergs cm-2 s-1), with line widths (1000 km s-1 ) greatly exceeding the resolution of the filled LWRS aperture (approximately 106 km s-1 ). These properties make the detection of the FUV lines quite sensitive to the quality of the background subtraction. Since the CalFUSE pipeline derives an empirical background for each spectrum using non-illuminated portions of the detector, we can improve the signal-to-noise of the measured background by co-adding the individual raw exposures for each of the four FUSE detectors (1A,1B,2A,2B), then extracting 1-D spectra from the combined raw frames. We used the IDL routine ttag_combine to combine the raw exposures (Figure 2), then used the CalFUSE pipeline to extract the 1-D spectra. We retained only the orbital night portions from each dataset (Table 1) to minimize the contribution of airglow emission lines and scattered airglow continuum to the object spectra.
We combined the raw exposures from the MDRS data in the same manner described above for the LWRS data. Since the C0720206 data were acquired nearly a year after the other observations, the FUV spectrum of this observation is significantly shifted in detector pixels relative to the earlier observations. Therefore, we first co-added the C0720202-C0720204 datasets into one raw image, then co-added C0720206 into a separate raw image. We extracted spectra from each image, cross-correlated each one and finally co-added them to obtain the 1-D MDRS spectrum of the DEM L71 blast wave.
2.2. SPECTRAL EXTRACTION
The FUSE spectra are recorded on four channels: LiF 1, LiF2, SiC 1 and SiC 2. Each channel is divided into A and B segments, with the two segments covering the approximate wavelength range 905 Å - 1100 Å for each of the LiF 1 and LiF 2 channels, and the wavelength range 987 Å - 1180 Å for the SiC 1 and SiC 2 channels (see the FUSE Observer’s Guide111 http://fuse.pha.jhu.edu/support/guide/guide.html). In each of our LWRS observations, the LiF 1A and SiC 2A (917 Å - 1006 Å) segments offer the highest effective area at the positions of the expected FUV emission lines. Therefore, we searched the spectra from these segments for SNR emission first. Although the extracted FUSE spectra are meant to be summed into one high signal-to-noise data product, inter-channel thermal drifts during each exposure can result in misalignments as large as 10″ between LiF 1 and the other channels. While the LiF 1 channel was held fixed on the SNR during an observation, the others sampled emission from slightly different portions of the SNR. The resulting spectra can differ from channel to channel. Therefore, for each observed SNR we combined spectra from multiple channels only when they appeared consistent with one another to within the flux uncertainties.
In the case of DEM L 71, prominent, broad emission lines of Ly , Ly , O VI and C III are detected in the LWRS observations. The spectral features are observed in all segments of the FUSE detector save for the LiF 1B and LiF 2A segments, whose spectral range excludes these emission lines. Although inter-channel drift is expected to have occurred during the 28 ks observation, the spectra are all consistent with one another to within the errors. We generated the spectra in Figure 3 by cross-correlating and combining data from SiC 2A with SiC 1B (905 Å 1005 Å) and the data from LiF 1A with those of LiF 2A and SiC 1A (988 Å 1090 Å). Although broad Ly and O VI emission were seen in the SiC 2B segment, we did not include this data in our co-addition because the background was unevenly over-subtracted for this segment by the CalFUSE pipeline.
Unlike DEM L 71, SNR 050967.5 and SNR 051969.0 fit almost completely within the LWRS aperture (Figure 1), increasing the likelihood that inter-channel drifts would adversely affect the detection of FUV emission from these objects. Since SNR 050967.5 exhibits the faintest FUV emission of all the Balmer-dominated SNRs (Figure 4), we restricted our analysis of this object to data from the LiF 1A segment.
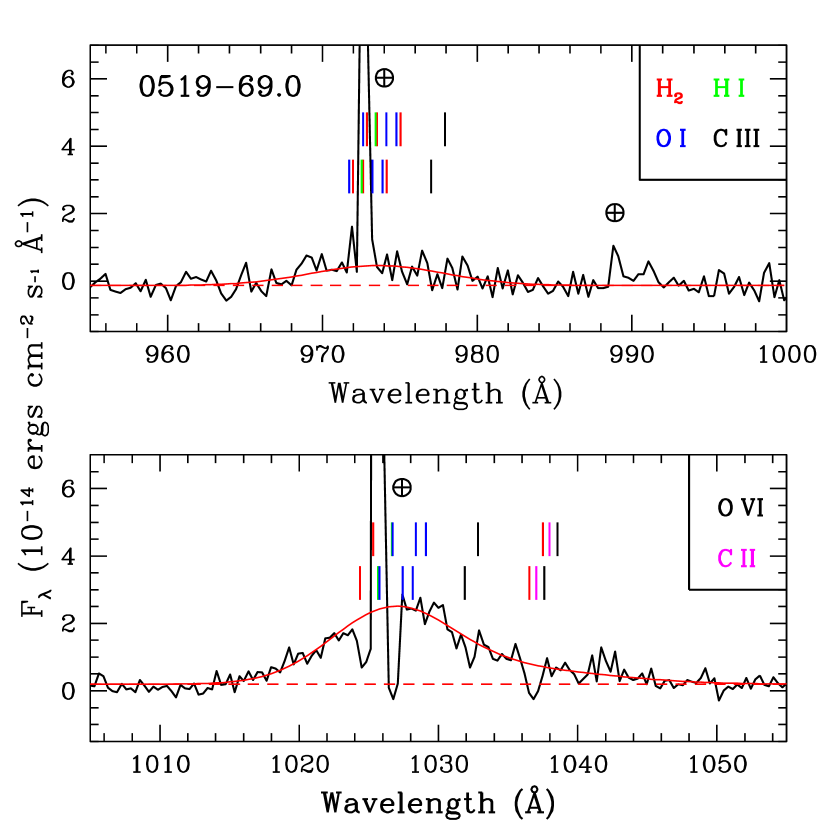
In the case of SNR 051969.0, on the other hand, FUV line emission was detected in all segments shortward of 1100 Å. One factor complicating our interpretation is the presence of a very faint continuum under the Ly and O VI features (clearly seen in Figure 2). The continuum is absent on the short wavelength side of the broad Ly line, but rises to a nearly constant level beneath the broad lines and continues to the long wavelength end of the spectrum. The continuum is absent in the other channel spectra near 1030 Å, and appears to be stellar contamination. After comparing the emission in all channels, we cross-correlated and combined the LiF 1A, LiF 2B, SiC 1A and SiC 2B data to obtain spectra in the 940 Å 1050 Å range. Although broad Ly was also detected, it was present solely in the SiC 2A spectrum of SNR 051969.0 (the channel with the highest effective area in this wavelength region).
In our MDRS observation of DEM L 71, FUV emission was detected only in the spectrum of the LiF 1A segment. The lack of detection in the other segments is likely due to a combination of their lower effective areas and the the strong impact of inter-channel thermal drifts. The latter effect is especially important here, where the smaller size of the MDRS aperture makes it easier for non-primary channels to drift off the targeted filament.
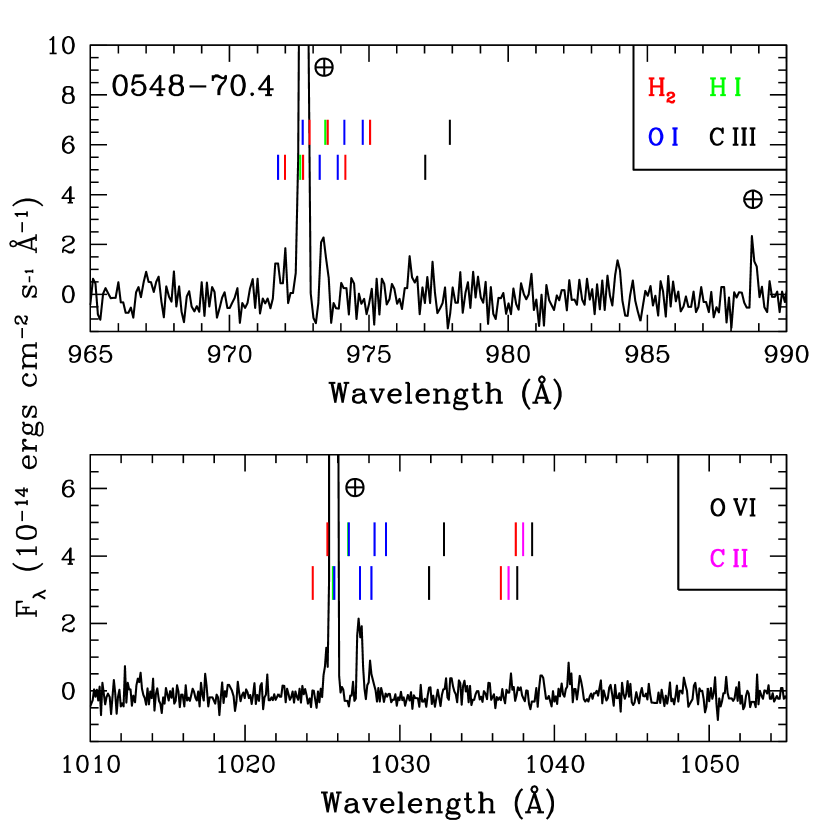
One of the more surprising results of our observations is the lack of any discernible FUV emission from the largest of the Balmer-dominated SNRs, SNR 054870.4 (see Figure 6). No emission is detected in either the raw combined data, the individual channel spectra or the co-added spectra from all channels. In the following section we will describe a possible explanation for this non-detection, and discuss its implications.
3. FAR ULTRAVIOLET SPECTRA
Of the observed Balmer-dominated remnants, two objects DEM L 71 and SNR 051969.0 exhibit readily identifiable, broad FUV line emission consistent with Balmer-dominated shocks: Ly (1025.7), O VI 1032, 1038, Ly (972.5) and C III 977. In a third remnant, SNR 050967.5, only the broad Ly line is detected with reasonable certainty. However, this is the first detection of broad hydrogen line emission from this remnant. Surprisingly, no discernible FUV emission is seen from the fourth remnant, SNR 054870.4, despite the known detection of broad Balmer line emission in this remnant by Smith et al. (1991). Here, we describe the FUSE spectra of each remnant in detail. All spectral fits have been performed using the SPECFIT task (Kriss 1994) from the STSDAS contributed package in IRAF222IRAF is distributed by the National Optical Astronomy Observatories, which is operated by the AURA, Inc. under cooperative agreement with the National Science Foundation. unless noted otherwise.
3.1. DEM L 71
3.1.1 LWRS Spectra
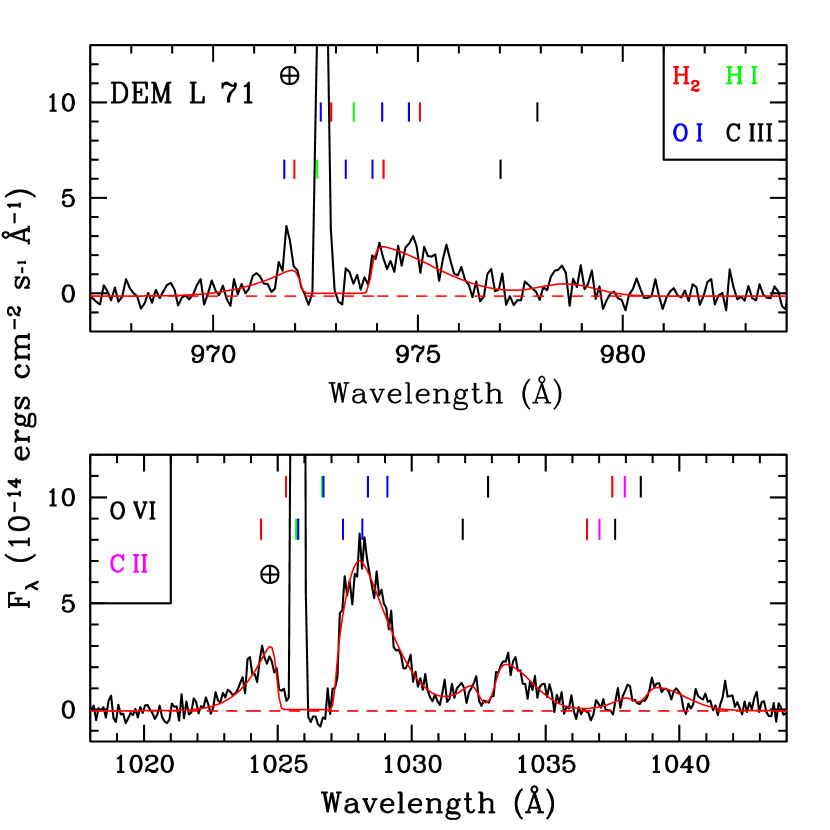
The combined LWRS spectrum of DEM L 71 (Figure 3) provides an especially impressive example of the FUV emission from a Balmer-dominated SNR. The emission lines are very broad (1000 km s-1 ), bright and clearly impacted by Galactic and LMC halo absorption. The presence of strong, broad Ly indicates that a significant fraction of the gas entering the blast wave is neutral, while the relative faintness of the C III line relative to O VI indicates that postshock cooling is negligible (Raymond 2001). The wavelengths of prominent absorption features from both the Milky Way and LMC are marked in Figure 3. The broad Ly , O VI 1032 and O VI 1038 lines are moderately blended, as are the Ly and C III 977 lines.
The LWRS aperture samples emission near the projected center of DEM L 71 (Figure 2). Therefore, each emission line should appear doubled by the bulk motion of the postshock gas () on near and far sides of the SNR. The shock velocities in DEM L 71 have been estimated to lie between 600 km s-1 and 1100 km s-1 (Smith et al. 1991; Ghavamian et al. 2003; Rakowski, Ghavamian & Hughes 2003), so the emission lines in DEM L 71 should appear blue/red-shifted by 400800 km s-1 from the rest velocity of the LMC (which we take to be +275 km s-1 ). However, the presence of strong interstellar absorption near the center of each emission line in Figure 3 makes it difficult to distinguish whether each emission line is doubled. As we show in Section 4, the line profile shapes observed in DEM L 71 are in fact consistent with the presence of two Doppler-shifted components. We have devised a spherical shell model of the blast wave to address the significant interplay between bulk and thermal Doppler motions in this spectrum. We present this model in the next section.
Although a spherical shell model is required for a kinematic interpretation of the spectrum in Figure 3, we can still estimate the observed flux in each of the broad emission features by fitting each with a single Gaussian line. Prior to fitting each spectrum we estimated the baseline level by fitting the data on the blue and red ends of the spectrum (devoid of emission features) with a straight line of zero slope. After obtaining the best fit value to the baseline, we held this quantity fixed during our subsequent fits to the emission lines. We chose a 9-component fit for the DEM L 71 spectrum, fitting the emission components with a flat baseline and three Gaussian emission lines for broad Ly and O VI 1032, 1038. We included three absorption components for broad Ly (Galactic and LMC halo H I absorption, Galactic O I absorption at 1027 Å) while excluding the wavelength range covering the Ly airglow line. We also included one O VI LMC absorption component for each of the broad O VI lines. Although there is possible evidence for more absorption components along the line of sight, we found that adding more of these components did not substantially improve the statistical quality of the overall fit.
We improved the constraining power of our fits by tying together the widths and velocity centroids of the O VI 1032, 1038 emission lines. We applied the same constraint to the O VI absorption features, with the additional requirement : = 2:1. In fitting the emission near 972 Å we used a 5 component model consisting of a linear baseline, one Gaussian each for Ly and C III 977, and one Galactic and one LMC H I absorption component. We held the velocity width and line centroid of the Ly line equal to the values measured from our Ly profile fit. We included the H I absorption components solely as an aid for better fitting of the broad Ly emission line. The fitted H I absorption lines do not actually provide reliable information on the H I column density because the data quality near the cores of the absorption profiles are heavily compromised by the bright airglow Ly line. Furthermore, we used a Gaussian profile shape to describe what are actually saturated H I absorption lines, further invalidating a physical interpretation of the fitted parameters for these components.
The resulting emission line fit for DEM L 71 is marked in Figure 3 and the predicted emission line parameters are listed in Table 2. The Ly line width (113530 km s-1 ) is significantly larger than that of the O VI 1032 line (74045 km s-1 ), already suggesting that the protons and oxygen ions have undergone significant temperature equilibration at the shock front. However, we defer the task of estimating the specific shock velocities and comparing the results to existing optical measurements to Section 4. We note the slight velocity shift for the fitted emission line centroids: taking a systemic velocity of +275 km s-1 for the LMC, the Ly and O VI 1032 lines are redshifted by 100150 km s-1 (Table 2). This feature suggests that the emission from the far side of the DEM L 71 shell is slightly brighter than the near side. In Section 4 we quantify this result with more detailed. models of the blast wave shell.
The prominent absorption features present in the O VI 1032, 1038 lines are centered at 25050 km s-1 , indicating that they arise in the LMC halo. The Galactic absorption component is considerably weaker. Our model fits indicate (Gal) = 1.70.6, with 5022 km s-1 after deconvolving the measured FWHM with the filled slit spectral response of 106 km s-1 . The implied O VI column density is approximately (3.52.2)1014 cm-2. Both the line width and column density lie at the upper end of, but are fully consistent with, values measured by Howk et al. (2002) in their analysis of FUSE spectra of 12 early-type stars in the LMC.
Aside from the O VI doublet, C III 977 in DEM L 71 is the only other heavy ion line detected in our LWRS spectra of the Balmer-dominated LMC remnants. Our single Gaussian fit (Table 2) indicates that the C III line is less than half as broad as the Ly line, indicating that significant temperature equilibration has taken place between protons and carbon ions at the shock front.
3.1.2 MDRS Spectrum
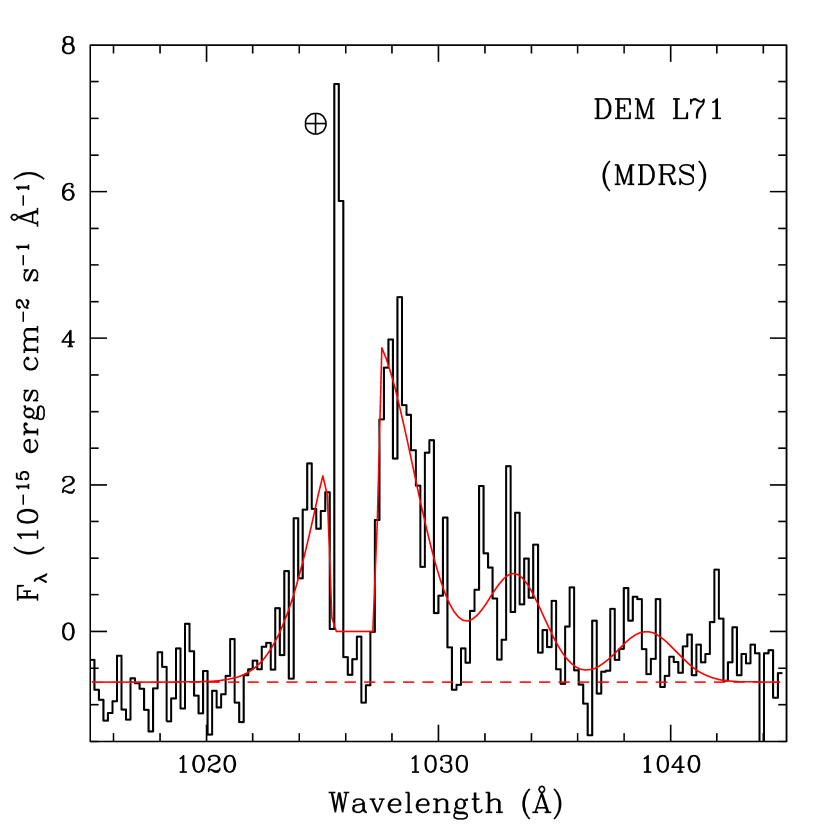
The night-only MDRS spectrum of DEM L 71 (Figure 7) reveals prominent, broad Ly emission moderately blended with faint O VI lines. As with the face-on LWRS spectrum, we fit the three lines together while including a fixed baseline level and both Galactic and LMC H I absorption. The O VI lines are faint enough to make the Galactic and LMC halo absorption features undiscernible, so we did not include absorption in our O VI profile fits. The inclusion of absorption components had minimal impact on the quality of the fit. The final results, quoted in Table 2, indicate a broad Ly width of 136575 km s-1 FWHM. The O VI line is significantly narrower, 935125 km s-1 , an indication that partial ion-ion equilibration has taken place at the shock transition.
3.2. SNR 050967.5
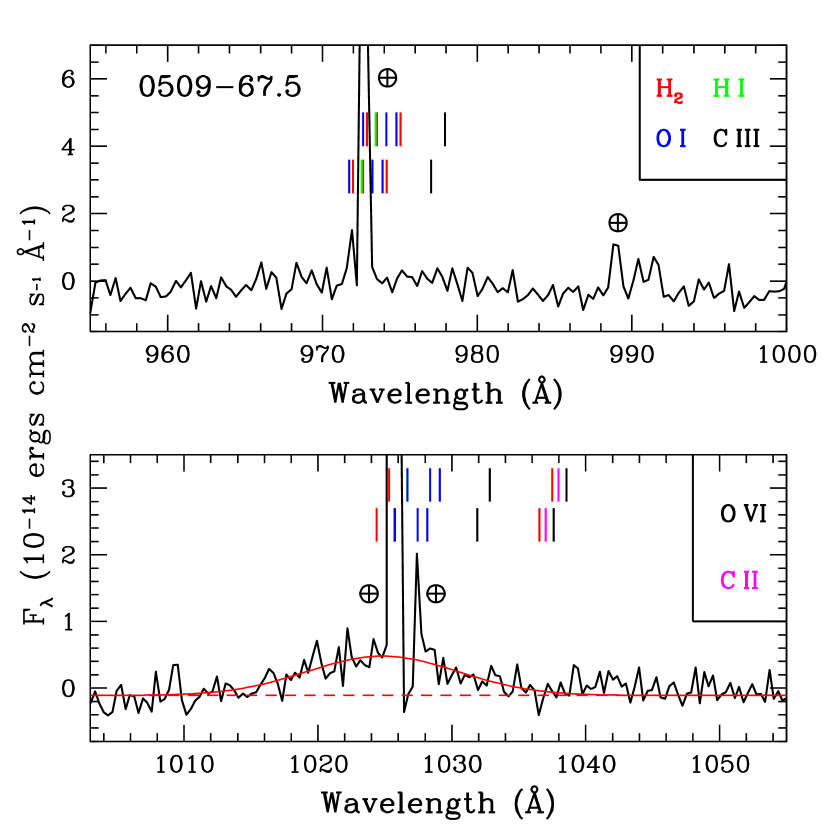
In their optical spectroscopy of this SNR Tuohy et al. (1982) and Smith et al. (1991) were unable to detect broad Balmer line emission and concluded that the line was too faint and broad to be detected. Our LWRS spectrum of SNR 050967.5 reveals a faint, strongly blueshifted broad Ly line (Figure 4), the first broad emission line detected from this SNR to date. The detected line emission is indeed faint, amounting to only 20% and 35% of the broad Ly flux in DEM L 71 and SNR 051969.0, respectively. We fit the broad Ly profile with a single Gaussian and ignored the regions containing the Ly airglow and H I absorption features. The result of this fit (Table 2) is a broad Ly width of 3710400 km s-1 , where the uncertainty includes both the random statistical error (325 km s-1 ) and the baseline uncertainty (240 km s-1 ; this quantity is the variation in line width when the background level is fixed to the upper or lower limits allowed by the initial baseline fit). This is the largest H I line width measured for a broad component in any of the Balmer-dominated SNRs thus far.
Aside from being very broad, the Ly line is blueshifted to 263125 km s-1 , indicating a large velocity shift (540 km s-1 ) relative to the LMC frame. The velocity shift of the broad line center is proportional to the projected component of the bulk velocity along the line of sight. The blueshift of the line indicates that the Ly emission arises on the near side of SNR 050967.5. As seen in Figure 1, there is a prominent patch of enhanced H emission stretching inward from the southwest corner of the shell. It is likely that this patch lies on the near side of SNR 050967.5 and that FUSE has detected the FUV emission from this region. As we will show in Section 4, the size of the Ly broad component shift is fully consistent with the position of the patchy enhancement relative to the geometric center of SNR 050967.5. Note that the region of enhanced emission is isolated close to the edge of the shell, so the range of viewing angles to this section of the blast wave is likely small (i.e., the emitting region can be approximated as a plane-parallel shock tilted slightly toward the observer).
3.3. SNR 051969.0
This Balmer-dominated SNR is similar in size to SNR 050967.5 (and likely of comparable age as measured from light echoes from the SN explosion, Rest et al. 2005). The FUV spectrum (Figure 5) exhibits broad Ly emission line at 1026 Å, blended with broad O VI 1032, 1038 line emission. A broad Ly line can clearly be discerned near 972 Å although the C III line falls below the detection threshold.
We can draw a direct comparison between the broad Ly widths measured in SNR 051969.0 and the H widths measured by Tuohy et al. (1982) and Smith et al. (1991). After deconvolving with the filled slit resolution (106 km s-1 ) we find good agreement between the broad Ly width of 3130155 km s-1 and the H value of 2800300 km s-1 measured along the rim by Tuohy et al. (1982). However, our line width is over twice the 1300200 km s-1 width measured for the broad H line by Smith et al. (1991). The reason for the difference is that the spectroscopic slit used by Smith et al. (1991) was placed E-W across SNR 051969.0, intersecting the bright knot on the eastern rim of the remnant (clearly seen in Figure 2). The spectra of Smith et al. (1991) were only deep enough to reveal broad H emission from this bright knot, where the blast wave has encountered a relatively dense region of the ISM and slowed. On the other hand, Tuohy et al. (1982) observed the fainter, more uniform portions of the SNR 051969.0 rim, where considerably less deceleration has occurred. As shown in Figure 2, the position and orientation of the LWRS aperture placed the brightened emission knots entirely outside the slit during the FUSE observation. Therefore, our FUV spectrum samples the less decelerated portions of SNR 051969.0 and should give Ly widths closer to the results of Tuohy et al. (1982).
3.4. SNR 054870.4
There are no emission lines detected in the FUSE spectrum of this object (Figure 6). The broad H width measured by Smith et al. (1991) along the eastern rim of SNR 054870.4 is 760140 km s-1 , corresponding to shock speeds of 700950 km s-1 . Since we easily detected shocks of similar speed in our LWRS FUSE spectrum of DEM L 71 in both Ly and O VI, it appears that the blast wave region covered by our LWRS slit (Figure 1) is propagating into a very low density, mostly ionized medium. In that case, pressure conservation would require very high shock speeds at this position, meaning that aside from being faint, the lines are probably also very broad.
Interestingly, our FUSE aperture includes several bright clumps of shocked interstellar material near the projected center of SNR 054870.4 (Figure 1). The lack of C III and O VI emission from the knots in our FUSE spectrum suggests that they are excited by slow radiative shocks (90 km s-1 ; Hartigan, Raymond & Hartmann 1987). In their narrowband imagery of SNR 054870.4 Tuohy et al. (1982) detected all of these clumps in H, but only detected [O III] emission from the clumps lying outside the FUSE aperture. In addition, the Chandra ACIS S image of SNR 054870.4 (Hendrick, Borkowski & Reynolds 2003) does not show any obvious X-ray emission from clumps within the FUSE aperture. These features are all characteristic of slow radiative shocks and suggest that dense, localized material has been overrun by the blast wave on the near and/or far side of SNR 054870.4.
4. TEMPERATURE EQUILIBRATION AND KINEMATICS
The FUSE spectra of the Balmer-dominated LMC SNRs are particularly valuable in that they feature prominent emission lines of hydrogen, carbon and oxygen, allowing us to directly measure the degree of ion-ion equilibration in fast non-radiative shocks. The diagnostic information available to us includes (1) the relative widths of the C III 977, Ly and O VI 1032, 1038 lines, which reflect both the relative temperatures of these ions and the shock speed (assuming we know the contribution of bulk Doppler broadening to the line profiles), and (2) the Ly / O VI flux ratio, which reflects the electron-proton equilibration, shock speed and preshock fraction of neutral hydrogen.
In the case of SNR 051969.0, the good agreement between our measured broad Ly width and the H width measured by Tuohy et al. (1982) from the edge of the SNR suggests that the FUV profiles are primarily broadened by thermal motions, i.e., that the emission is dominated by the limb-brightened edges where the bulk motion along the line of sight is small. Since the LWRS slit also covers most of SNR 050967.5, we can expect the broad Ly profile from this SNR to also be shaped by thermal broadening. Finally, we can expect our MDRS spectrum of the DEM L 71 blast wave to also exhibit lines dominated by thermal broadening, since the edge of the blast wave was targeted in this observation. In all these cases, we have used the FUV line widths as a direct measure of the ion temperatures and have utilized the non-radiative shock code of Ghavamian et al. (2001, 2002) to predict the emission line fluxes.
In contrast to the spectra mentioned above, the interpretation of our LWRS line profiles for DEM L 71 is less straightforward. In this case most of the FUV emission is sampled from the projected center of the SNR, where emission from a range of viewing angles (and hence bulk velocities) is sampled in the FUSE spectrum. Furthermore, the fraction of the DEM L 71 interior covered by the LWRS slit is large enough to make a simple plane-parallel approximation inadequate for describing the two sides of the shell. In the next section we describe a more realistic model where we approximate the SNR as an expanding spherical shell. Having used these models to disentangle the bulk and thermal contributions to the line broadening, we then compute the proper shock speed(s) and / ratio(s) required to match the FUV line profiles for DEM L 71. Finally, we model the flux ratios for DEM L 71 using our numerical shock code and constrain the electron-ion equilibration and the preshock neutral fraction.
4.1. NUMERICAL MODELS
We begin by describing our plane parallel shock models, then describe the spherical shell model for DEM L 71. We use the former models to predict flux ratios for the broad Ly and O VI emission lines, and use the latter models to match the shapes of these lines in the LWRS spectrum of DEM L 71.
Before presenting our models, we note that Heng & McCray (2006; hereafter HM06) have recently presented new calculations of Balmer-dominated shock structures. In their models HM06 found that the fast neutral distribution evolves in shape over multiple charge exchanges, with the overall broad component profile being the sum of multiple profiles (this effect was ignored in our earlier works). They find that for 2000 km s-1 the fast neutrals become ionized before they have undergone enough charge exchanges to fully sample the bulk-shifted velocity distribution of the incident hot protons. The resulting fast neutral distribution is shifted by a bulk velocity substantially less than , and is narrower than predicted from the models of Chevalier, Kirshner & Raymond (1980) and our own models (Ghavamian et al. 2001, 2002). HM06 find this effect to be far less important at the shock speeds relevant to DEM L 71, so the shell model results presented for that SNR in Section 5.1.1 should remain valid. However, in the cases of SNR 050967.5 and SNR 051969.0 where shock speeds are expected to exceed 2000 km s-1 , our interpretation of the FUV line profiles changes significantly if we adopt the HM06 mapping between shock speed and broad hydrogen line width. In the HM06 calculations the range of shock speeds implied by a given broad H I line width is significantly narrower in the limits of minimal to full electron-proton equilibration (for 2000 km s-1 ) than in our line profile calculations (Ghavamian et al. 2001). We describe these results in more detail in Sections 5.2 and 5.3.
4.1.1 SHOCK MODEL
The numerical code described by Ghavamian et al. (2001; 2002) computes the ionization and temperature structure behind a non-radiative shock with arbitrary electron-ion and ion-ion equilibration. The original purpose of the code was to compute the broad-to-narrow flux ratio of the Balmer H and H lines, including the enhancement of the narrow Balmer lines by Lyman line radiative transfer. We have now extended the ionization structure calculation of this code to include heavier elements up to and including silicon. In addition to the electrons and protons, our code now includes Coulomb equilibration of the He, C and O ion temperatures behind the shock.
At the large shock velocities expected in SNR 051969.0 and SNR 050967.5 (4000 km s-1 ), collisional ionization of neutral hydrogen by He+ ions and alpha particles becomes important (Laming et al. 1996), so we have included these processes in the code via rates computed with the atomic close-coupling cross sections of Toshima (1994). We have also updated the ionization balance to include charge exchange between neutral hydrogen and both He+ ions and alpha particles, again utilizing the cross sections computed by Toshima (1994). All our rate calculations assume Maxwellian particle distributions and are computed in the center of mass frame of the incident and target particles in the manner described by Ghavamian (1999). The other update included in this shock code is the calculation of emission line fluxes in broad Ly , C III 977, broad Ly and O VI 1032, 1038 out the front of the shock. We computed the collisional excitation of these lines by electron, proton, He+ and alpha particle impact. The atomic data used in our calculation utilize fits to collision strengths for O VI excitation by electron impact from the compilation of Merts et al. (1980). To compute heavy ion excitation rates we have integrated the proton and alpha particle excitation cross sections of O VI from Laming et al. (1996), again under the assumption of Maxwellian particle distributions. We have also computed Ly and Ly rates from He+ and alpha particle impact from the scaled cross sections of Janev (1996).
Although all of the observed emission lines arise from resonant transitions, we have ignored the radiative transfer of the FUV photons within the shock in our calculations. The integrated resonance scattering optical depth perpendicular to the shock front in the broad Ly , Ly , C III and O VI lines is generally small, 0.03 for a preshock density of 1 cm-3, preshock hydrogen neutral fraction of 0.5 and shock speeds in the range 6005000 km s-1 . In addition, the very large Doppler widths of the FUV lines (6003000 km s-1 for the SNRs considered here) ensure that most photons propagating perpendicular to the shock front escape before being absorbed. The prominent absorption features observed at the centers of the emission lines are almost entirely due to LMC and Galactic halo absorption.
Before describing the spherical shell model for DEM L 71 we consider the question of whether the ion-ion equilibration can be measured separately from the electron-proton equilibration in the LMC Balmer-dominated SNRs. At shock speeds greater than 3000 km s-1 , FUV line emission from collisional excitation by protons, He+ ions and alpha particles becomes increasingly important. This implies that the flux ratios can be sensitive not just to the electron-proton equilibration, but the proton-helium ion equilibration as well. Since there are no He lines in our FUSE spectra of the Balmer-dominated SNRs, we have no a priori knowledge of the degree of proton-He ion equilibration in these objects. This raises the question of whether flux ratios uniquely determine the electron-proton equilibration. The F(Ly )/F(1032) ratio is most sensitive to in shocks with minimal electron-proton equilibration. For 0.05, the ratio F(Ly )/F(1032) for shocks in the range 35008000 km s-1 (appropriate for SNR 050967.5 and SNR 051969.0) increases by only 10% as is varied from 4 (i.e., ) to 1. Therefore, while the FUV line fluxes are sensitive to and in SNR 050967.5 and SNR 051969.0 ( 3000 km s-1 ), they do not vary strongly with ion-ion equilibration over the range of shock speeds set by the width of the broad Ly profile.
4.1.2 SPHERICAL SHELL MODEL
To predict the shapes of the FUV line profiles in our FUSE spectrum of DEM L 71 we have computed the emergent intensity in broad Ly and O VI from two limb-brightened, hemispherical shells joined together in the plane of the sky. For each shell the shock speed, preshock density and degree of temperature equilibration between the protons and oxygen ions are free parameters. From Figure 1 we estimate that approximately half the DEM L 71 shell is subtended by the LWRS slit.
The first step in computing the line profile within the aperture is to compute the emission at a velocity and an angle from the center of a given shell via the well known radiative transfer relation
| (1) |
where is the source function of the shell and is the optical depth of the shell at the azimuthal angle . Under the assumption of a Gaussian line profile, the optical depth for the front or back side of the shell is
| (2) |
where is the bulk velocity of the postshock gas, and is the Doppler parameter of the emission line. The symbol is negative for the approaching shell and positive for the receding shell. The face-on optical depth is evaluated at the center of the line profile,
| (3) |
where is the column density through the shock of the ion and are the oscillator strength and the rest wavelength of the ionic resonance line. In terms of these quantities, the source function is
| (4) |
In the limit 1, Equation (1) reduces to the usual expression for limb-brightened emission , where is the face-on emission line intensity. If the shock speed, preshock density and postshock equilibration are allowed to differ between the approaching and receding sides of the shell then , , and will also differ between the two sides. Although photons from the far side of the shell must traverse the near side of the shell as they exit the SNR, we assume that there is negligible absorption of these photons on the near side due to large velocity offsets. Despite the moderate blending of the Ly and O VI lines in the LWRS spectrum of DEM L 71, the optical depth for absorption of highly Doppler shifted photons from one profile into another is negligible within the shock, so we neglect this effect in our models.
The flux per velocity interval from each shell is obtained by inserting Equation (2) into Equation (1) for each of the two sides, then performing the integral
| (5) |
for a sample of velocities over the line profile (we assume azimuthal symmetry). The total observed profile is then the summed fluxes from the front and back sides of the shell.
In a spherical shell of radius and thickness , the maximum limb brightening is , where is the radius of the SNR and the thickness of the emitting layer. The larger the radius and the thinner the emitting layer, the greater the limb brightening. In our models we relate the upper limit on the angular integral in Equation 5, , to the limb brightening factor via , where 01 is determined by the fraction of the SNR shell covered by the spectrograph slit. For a slit covering the full SNR, 1. For a preshock density of 1 cm-3, for example, (3-60)10-3 pc between shock speeds of 500 and 5000 km s-1 . Taking 10 pc for DEM L 71, the limb brightening factor lies in the range 9 40, so that the integrated emission line profile is dominated by the contribution near the edge of the shell.
To predict the line profile shapes we have used our numerical shock code to compute a grid of values for over a wide range of shock speeds and equilibrations. When computing the line profile for a given set of shock parameters, we interpolated within the pre-calculated grid to compute the appropriate value of . For a given shock speed between 500 km s-1 and 5000 km s-1 the O VI column density behind the shock is relatively insensitive to the shock speed, but declines with increasing electron-proton equilibration, dropping by a factor of 3 between the limits of minimal and full electron-proton equilibration.
For the range of shock parameters quoted above, the line center optical depths of broad Ly , O VI 1032 and C III 977 in our models can reach values 0.5-1 at the edge of the SNR shell. At these moderate optical depths the resonance scattering removes photons from the line center and leaves emission line profiles with slightly flattened, broadened peaks. In the case of the O VI doublet the : ratio drops below the optically thin ratio of 2:1, an effect that has already been observed in non-radiative shocks in the Cygnus Loop (Long et al. 1992; Sankrit & Blair 2002; Raymond et al. 2003). Although consideration of resonance scattering is important for interpreting the spectra of a localized filament in a nearby object such as the Cygnus Loop, the net effect on the spectra of the LMC Balmer-dominated SNRs is rather small. In cases where the FUSE aperture includes edge-on emission from the SNR, enough O VI 1032 photons are contributed from positions just inside the edge of the shell to compensate for photons scattered out of the line of sight from positions at the edge of the shell. Our simple shell models do not include these effects, so they may over-estimate the importance of resonance scattering on the FUV profiles of the LMC remnants. In comparing line fluxes from these objects with predictions from our plane parallel shock models we have neglected the effects of resonance scattering.
The line profiles calculated with the spherical shell model are flatter on top and exhibit slightly more extended wings than Gaussian profiles. However, given the strong interstellar absorption near the centers of the FUV lines and the limited signal-to-noise of most FUV line profiles, both the single Gaussian profile and the spherical shell model adequately match the line shapes in the SNR 051969.0 and SNR 050967.5 spectra.
5. MODEL RESULTS
In previous modeling of Balmer-dominated SNRs (Ghavamian et al. 2001; 2002), we estimated the degree of electron-proton temperature equilibration by first measuring the width of the broad H component from edge-on shocks to constrain the range of shock speeds, then modeling the broad to narrow flux ratio to constrain the combination of shock speed and consistent with all the data. Unfortunately, the narrow Ly emission is completely absorbed by the ISM in our FUSE spectra, as is the core of the broad Ly line. In addition, the widths of the FUV emission lines in all our FUSE spectra reflect both thermal and bulk Doppler broadening. Without taking into account the latter contribution to the line profile, the shock velocities tend to be overpredicted.
In the ensuing analysis we take the following approach to constraining the shock kinematics: (1) We use existing measurements of the broad component H width (where available) from the rim of each SNR to constrain the range of shock speeds. The line widths from these measurements should primarily reflect thermal broadening and give the best constraint on the appropriate range of . (2) Using the range of constrained shock speeds from the plane parallel models, we calculate fluxes in broad Ly and O VI. Comparing these model fluxes with the observed values, we attempt to further refine our estimates of and , while also obtaining constraints on the preshock neutral fraction of hydrogen. (3) Again utilizing the shock speed constraints from the plane parallel models, we use our spherical shell models to predict the shapes of the integrated Ly (and when possible, O VI) profiles. Comparing these predictions with observed profiles in the LWRS spectra, we gauge the contribution of bulk Doppler broadening to the profile width. By subtracting the bulk Doppler component in quadrature from the total profile width in Table 2, we obtain limits on and , thereby constraining .
In the following we compare the observed F(Ly )/F(1032) with predictions from our plane parallel shock models to constrain for the DEM L 71 blast wave, SNR 050967.5 and SNR 051969.0. In all calculations we adopt the LMC abundances of Russell & Dopita (1992) (in this case by 12 + log(O/H) = 8.35).
5.1. DEM L 71
5.1.1 SOUTH RIM OF DEM L 71
The FWHM of the broad Ly line in our MDRS spectrum is 136575 km s-1 , nearly 40% larger than the H width of 805 km s-1 measured by Ghavamian et al. (2003) from Rutgers Fabry-Perot (RFP) observations of DEM L 71. There are several potential explanations for this discrepancy. First, there was a lack of extensive spectral coverage on either side of the H profiles in the RFP spectra of Ghavamian et al. (2003). Since the H profiles were not sampled beyond 800 km s-1 , fitting a line with wings extending well beyond that range may have resulted in an anomalously low line width. On the other hand it is possible that contrary to our expectation, the MDRS observation of DEM L 71 did not completely isolate the limb emission. In recent optical spectra of DEM L 71 acquired with the Magellan 6.5m telescope (C. Rakowski 2006; private communication) several broad H components are observed along portions of the eastern rim. The two components are of comparable width (600 km s-1 ), but their line centroids are shifted in opposite directions in velocity. This indicates that even near the limb of the SNR the slightly off-edge emission can be bright enough to significantly affect the observed broad component profile. The multiple nested filaments observed at the southern limb of DEM L 71 (Figure 2) suggest multiple tangencies between the blast wave and line of sight, indicating that the emission between these tangencies is likely to include partially face-on emission. Unlike the RFP spectral extraction, which cleanly isolated the H emission from the southern rim of DEM L 71, the MDRS slit is wide enough to include some of this off-tangent emission, so the MDRS spectrum is more likely to be affected by this problem. If this explanation is correct, then the line widths measured in our MDRS spectra would overpredict the shock velocity.
With the above caveats in mind, we modeled the DEM L 71 MDRS spectrum by first using the H line width of 805 km s-1 from Ghavamian et al. (2003) to set the range of shock speeds. Since the shock speed is likely to remain relatively constant near the rim of DEM L 71, we assume that the FUV line ratios reflect excitation from a single shock, even though the lines exhibit some bulk broadening. Under these assumptions, we then compared the predicted F(Ly )/F(1032) ratios with the observed values.
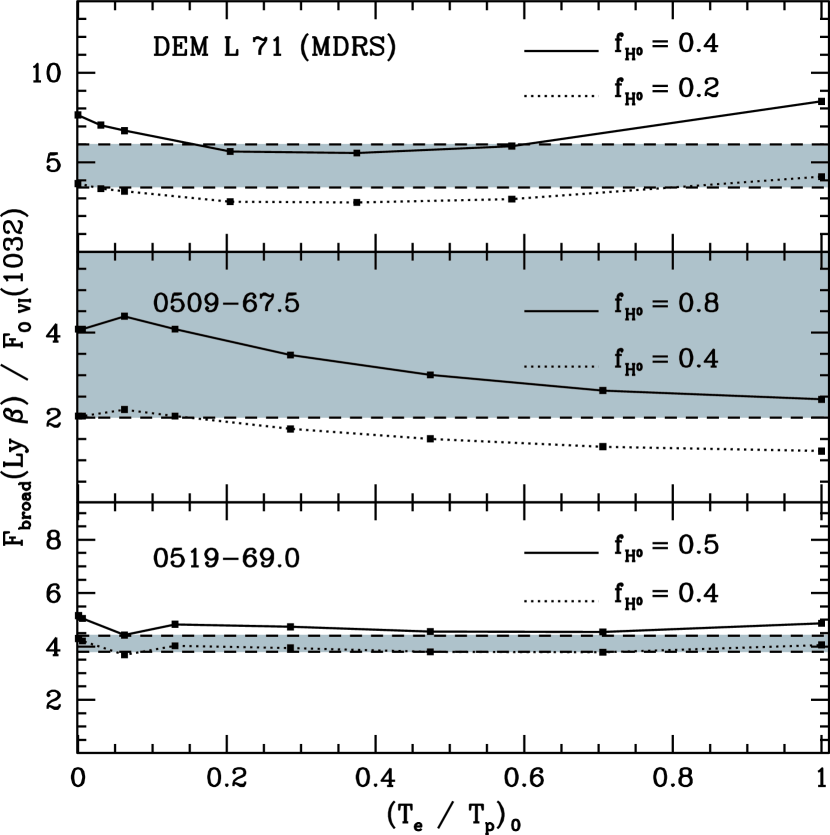
Using the relationship between hydrogen line FWHM and shock speed calculated by Ghavamian et al. (2001), the implied range of shock speeds from the H broad component width (Ghavamian et al. 2003) is 7751005 km s-1 over the range = to 1. We calculated a grid of F(Ly )/F(1032) values over this range of shock speeds, combining each with the corresponding velocity needed to match the width of the broad Ly line. A plot of our results is shown in the top panel of Figure 8.
For the range of shock speeds here, the electrons in the H I neutral zone behind the shock are close to the optimum temperature (106 K) for exciting Ly close to the shock front, producing a peak in the F(Ly )/F(1032) curve near = 0. At higher equilibrations and shock speeds, however, the charge exchange rate begins to dominate over the collisional ionization rate, resulting in higher overall density of fast neutral hydrogen behind the shock. The broad Ly flux increases accordingly, producing the rise in F(Ly )/F(1032) seen in Figure 8 at high equilibrations.
Unfortunately, due to the linear dependence of F(Ly )/F(1032) on preshock neutral fraction, the double valued behavior of the predicted F(Ly )/F(1032) at low and high , and the uncertainty in the measured flux ratio, we are unable to obtain a unique combination of and from the plot. Although we cannot unambiguously determine these two quantities, we can at least constrain the range of preshock hydrogen neutral fractions in the southern rim of DEM L 71. If we require at least one point of intersection between the range of measured and predicted F(Ly )/F(1032), the maximum and minimum allowed preshock neutral fractions are 40% and 20%, respectively.
Assuming a uniform shock speed along the southern rim of DEM L 71, we have attempted to estimate the degree of proton-oxygen equilibration at the shock transition. At the range of shock speeds considered here (8001000 km s-1 ), charge exchange behind the shock produces a fast neutral distribution with a velocity width nearly equal to the width of the proton distribution. Therefore, the proton temperature is just the temperature obtained from the broad component H width (805 km s-1 ). If we assume that the difference between this value and our measured Ly width is due to the effect of bulk motion of emitting material within the FUSE aperture, then we can estimate the Doppler broadening as (13652 - 8052)1/2 = 1100 km s-1 . This value, however, is larger than the measured O VI line width of 935 km s-1 . Therefore, is not well constrained from our fit to the O VI profile, and we can only estimate an upper limit on under the assumption that the O VI width represents pure thermal broadening. Under these assumptions, = , giving 8. Note that the oxygen temperature derived from the O VI line width represents an average value weighted by the postshock O VI emissivity. The O VI zone behind the shock is extended enough for Coulomb collisions to have transferred some energy from the oxygen ions to the lighter ions. Comparing our measured values of with predictions from shock models, we find the emission-weighted ratio should be 10% smaller than the immediate postshock value, so that 9 is a better estimate of the temperature ratio. Clearly this is a rough limit, but it suggests that a moderate amount of proton-oxygen temperature equilibration has taken place at the shock transition.
5.1.2 LWRS SPECTRUM OF DEM L 71
As described earlier, the LWRS slit in the DEM L 71 observation is filled mostly with emission from the interior of DEM L 71. Therefore, we expect each of the emission lines in Figure 3 to consist of two components, one red-shifted and one blue-shifted from the rest frame of the SNR. Utilizing our spherical shell model for DEM L 71 we have attempted to match the shapes of the broad Ly and O VI 1032 lines. The faintness of the C III 977 feature prevents us from obtaining meaningful constraints on its shape, so we have not attempted to model the C III 977 profile.
We focused first on separating the thermal and geometric contributions to the width of the broad Ly line. We attempted to match the profile shape with our spherical shell models by varying and together for each of the two sides of the shell contained in the aperture. The amplitudes of the frontside and backside profiles are not allowed to vary independently, but are tied together via the requirement of ram pressure conservation: . We do not model the LMC and Galactic Halo absorption in these models, but focus upon matching the wings of the observed Ly profile.
Our best estimate of the Ly profile shape from the shell models is shown in Figure 9. As a first estimate, we assumed the LWRS slit was aimed at the center of the SNR and covered half the projected area of that shell (approximately correct for our observational setup). Interestingly, the line profiles predicted by this model (dashed line in Figure 9) overpredict the emission near the center of the observed profile, and give only slightly better agreement in the far wings of the profile. Varying the amplitude or width of the model profile for any individual component (approaching or receding side of the shell) can produce better agreement toward the center of the broad Ly line, but the agreement then worsens in the wings of the profile. Since the profiles from the front and back sides of the shell are centered on the bulk velocities (= ) of these two components, the blueshifted and redshifted peaks are spread far apart, with too little emission predicted at the center of the profile. We found that the only solution to this problem was to include emission from edge-on shocks in the profile calculation (i.e., by setting 1 in Equation 5), despite the fact that the LWRS observation does not appear to include filaments near the edge of DEM L 71 (Figure 1). Under that assumption the wings of the calculated profile draw inward, with emission from zero radial velocity filling in the center of the broad Ly line. The necessary inclusion of an edge-on component in our models indicates that some of the O VI emission may be distributed differently from the H emission (particularly if parts of the DEM L 71 blast wave are propagating into fully ionized gas).
While the addition of the edge-on component significantly improves the ability of our models to match the observed profile, asymmetric flux contributions from the front and back sides of the shell are also required to match the residual redshift of the broad Ly centroid. To reproduce the +235 km s-1 redshift of the broad Ly feature from the LMC rest velocity (Table 2), the central peak of the Ly profile from the far side of the shell must be higher that of the near side. Keeping this constraint in mind, we adjusted the shock velocity, total preshock density and electron-proton equilibration for the two sides of the shell while conserving ram pressure as described earlier. The final result of our Ly profile calculation for DEM L 71 is marked with the solid line in Figure 9.
Using the calculated relationship between the velocity width of the proton distribution and the width of the H I profile transmitted by charge exchange (Chevalier, Kirshner & Raymond 1980; Ghavamian et al. 2001), the best combination of Ly profile widths from our spherical shell model are 920 km s-1 for the approaching side of the shell and 585 km s-1 FWHM for the receding side of the shell. The corresponding combination of shock parameters ( , , ) are (900, 0.5, 0.05) for the approaching side of the shell and (650, 1.0, 0.6) for the receding side of the shell. Note that the absolute quoted values of are not the meaningful quantities here, but rather their ratio, as required by ram pressure conservation.
Although there is some degeneracy between the various shock parameters estimated above, they are fully consistent with prior measurements of the broad component H width, shock speed and equilibration estimated for DEM L 71 by Smith et al. (1991), Ghavamian et al. (2003) and Rakowski et al. (2003). The analyses in these papers indicated that the blast wave of DEM L 71 has decelerated to 600 km s-1 in the northeastern corner of the SNR, precisely where the FUSE LWRS slit grazes the edge. On the other hand, the RFP H spectra and Chandra X-ray analyses of Ghavamian et al. (2003) and Rakowski et al. (2003) indicated a nearly 50% variation in shock speed around the rim of of DEM L 71, with the highest shock speeds (800-1000 km s-1 ) measured along the southern rim. The results of our broad Ly profile models indicate that the far side of DEM L 71 may be propagating into a higher density medium than the near side, with a correspondingly lower shock speed on the far side of the SNR.
After applying our shell models to the broad Ly profile, we modeled the O VI 1032 profile. As a first guess we set the shock speeds of the front and back sides of the shell equal to the values derived from the broad Ly profile model, with the O VI line width a free parameter. Our best estimates for the O VI line widths are 475 km s-1 FWHM for the receding shell and 900 km s-1 FWHM for the approaching shell. The centroid of the observed O VI 1032 feature is shifted by the same velocity as the centroid of the Ly feature (Table 2), and can be matched with a 2:1 ratio of preshock density between the back and front sides of the shell. Taken together, the Ly and O VI 1032 results suggest that while the front and back sides of DEM L 71 are propagating into an ISM with a 2:1 ratio in total density, the hydrogen neutral fractions are similar on both sides of the shell.
From our above analysis, we can estimate for the approaching and receding sides of the shell in DEM L 71. Given = 650 km s-1 , = 0.6 and an estimated O VI 1032 width of 475 km s-1 on the back side, we obtain 6.5. On the near side, for shock speed of 900 km s-1 , = 0.05, we obtain 16. Although these estimates are subject to the uncertainty of deconvolving the thermal broadening from the bulk Doppler broadening in our spectra, both the magnitude and declining trend of with shock speed are consistent with results established for the Balmer-dominated shocks in other SNRs such as the Cygnus Loop (Raymond et al. 2003) and SN 1006 (Laming et al. 1996; Korreck et al. 2004).
5.2. SNR 050967.5
The sole emission line positively detected in the LWRS spectrum of this Balmer-dominated SNR is broad Ly (Figure 4). The fitted FWHM (3710400 km s-1 ) is the largest hydrogen line width measured in a Balmer-dominated SNR to date. The centroid of the broad Ly line is substantially blueshifted (540 km s-1 ) relative to LMC frame, suggesting that the FUV emission from SNR 050967.5 primarily arises from the near side of the SNR shell. It is likely that the broad Ly profile is affected by bulk Doppler motions. However, unlike the other three Balmer-dominated SNRs, there has been no prior detection of broad ionic line emission from SNR 050967.5, so we have no clear constraint on the appropriate range of shock speeds for modeling the profile in Figure 4.
Since we do not have enough information for disentangling the bulk Doppler contribution of broad Ly from the thermal Doppler contribution, we proceed with a plane parallel shock analysis under the crude assumption that the broad Ly width in SNR 050967.5 reflects purely thermal broadening. Using the calculations of HM06, the measured FWHM corresponds to shock speeds of 52006300 km s-1 over the range 1 (for comparison, the FWHM calculations of Ghavamian et al. (2001, 2002) give a range of 56107780 km s-1 ).
Although the O VI lines are not detected in the FUSE spectrum of SNR 050967.5, we can still place a lower limit on both F(Ly )/F(1032) and the widths of the O VI lines. First, we estimate an upper limit on the O VI 1032 flux. The upper limit on the flux per wavelength interval from the FUSE spectrum of SNR 050967.5 is 210-15 ergs cm-2 s-1 Å-1 at the center of the O VI 1032 line. To convert this number to a flux, we require a limit on the O VI line width. For each shock speed in the range quoted earlier, the FWHM of the O VI line is related to the oxygen temperature via , so that full proton-oxygen equilibration would produce an O VI line width as broad as the proton velocity distribution, while no equilibration would yield equal widths. Over the full range of allowed equilibrations, the predicted O VI line width ranges from 1245 km s-1 (for = = 1) to 5300 km s-1 (for = 1 and = 16). km s-1 (equilibrated). The corresponding limit on the O VI 1032 flux is then F(1032) = (0.9-3.9)10-14 ergs cm-2 s-1 in the limits of full and minimal proton-oxygen equilibration respectively.
In Figure 8 we present the predicted F(Ly )/F(1032) ratio for SNR 050967.5 for the range of shock speeds implied by the width of the broad Ly profile. The lower limit on the F(Ly )/F(1032) ratio corresponds to the largest O VI line width (5300 km s-1 ) allowed from our analysis above. For a given broad Ly width and corresponding combination of shock parameters (, ), the O VI emission rises more rapidly with increasing (and shock speed) than the broad Ly emission, causing the modest decline in the predicted F(Ly )/F(1032) (Figure 8). Our models are shown for two limiting preshock neutral fractions: 0.4 and 0.8. The lower neutral fraction is the smallest value allowing an overlap between our model curves and the observed range. The higher fraction is the largest value likely for the warm ISM, given the minimum photoionization expected from both the SNR and the ambient UV and soft X-ray backgrounds.
We can draw several conclusions from the middle panel of Figure 8. First, efficient proton-oxygen ion equilibration is ruled out. In such a case, the narrow O VI line width (a minimum of 1245 km s-1 FWHM for = 1) would require a very low total O VI 1032 flux to stay consistent with the non-detection of O VI in the LWRS spectrum. This would raise the observed F(Ly )/F(1032) ratio (i.e., the lower edge of the shaded region) to 9, which cannot be matched by any model regardless of equilibration or preshock neutral fraction. The prediction from our models is that F(Ly )/F(1032) 4.5, a constraint which is satisfied for 2400 km s-1 . This places the proton-oxygen ion equilibration in the range 4 16 (the assumed upper limit corresponds to the oxygen to proton mass ratio, though 16 has been observed on occasion in solar wind shocks). We cannot place a strong constraint on from Figure 8, but we can deduce that the preshock gas should be significantly neutral, 0.4 0.8.
We can use our derived shock velocity for SNR 050967.5 to estimate its age. Assuming pure thermal broadening for the detected Ly line and taking into account the measurement uncertainty in the broad Ly width, the predicted shock speed is 36007100 km s-1 over the range 1. We compute the age by assuming a radius of 3.6 pc (Warren & Hughes 2004) and using , where is the expansion parameter. Between the limits of free expansion and the asymptotic Sedov-Taylor limit, ranges from around 1.0 down to 0.4. Our derived shock speeds are significantly lower than the 10,000-20,000 km s-1 expansion velocities predicted for Type Ia SNe, indicating that some deceleration of the blast wave has occurred. Assuming standard Type Ia parameters and a constant ISM density, Dwarkadas & Chevalier (1998) predicted that declines to around 0.6 during the first few hundred years after the SN explosion. Using this expansion parameter, we find 295-585 years for SNR 050967.5. This value compares favorably with the light echo age of 400120 years found for SNR by Rest et al. 2005). Given the neglect of bulk Doppler broadening in our analysis, we are at the very least encouraged by the broad agreement between our derived age for SNR 050967.5 and the independent age estimate of Rest et al. (2005).
5.3. SNR 051969.0
5.3.1 PLANE PARALLEL MODEL RESULTS
The broad component H width measured along the rim of SNR 051969.0 by Tuohy et al. (1982) was 2800300 km s-1 , comparable to the value measured in the Galactic Balmer-dominated SNR SN 1006 (Ghavamian et al. 2002; Korreck et al. 2004). From the line profile calculations of HM06 this width corresponds to shock speeds in the range 32003900 km s-1 in the limits 1 (again these are considerably narrower values than the range of 41155930 km s-1 predicted by our own models).
The predicted F(Ly )/F(1032) ratios for SNR 051969.0are shown in the bottom panel of Figure 8. It is clear that in this case the flux ratios do not vary strongly with electron-proton equilibration, partly a result of the narrow range of shock speeds implied by the width of the broad Ly line. The F(Ly )/F(1032) curves are shown for two limiting preshock neutral fractions: the lower fraction (0.4) being the smallest value allowing overlap between our model curves and the observed range, with the higher fraction (0.8) being the largest value likely for the warm ISM surrounding the SNR. We cannot place a strong constraint on from Figure 8. However, the preshock neutral fraction is well constrained, 0.4 0.5.
Despite the considerable uncertainty (40%; Table 2) in the O VI line width, we can still place reasonable limits on the degree proton-oxygen ion equilibration in the blast wave of SNR 051969.0. The FWHM of the broad Ly line is 3130155 km s-1 , while that of the O VI 1032 is 49751830 km s-1 . The contribution to the FUV profiles from bulk Doppler broadening, , can be estimated by subtracting the Tuohy et al. (1982) H width from the observed Ly width, = 1400 km s-1 . Assuming the same bulk broadening for the O VI line, the thermal width of the oxygen ion distribution is then 48001750 km s-1 . Since the O VI line width cannot significantly exceed that of broad Ly , our result can only be consistent with equal line widths, or 16.
The age obtained by Rest et al. (2005) from their light echo study of SNR 051969.0 is 600200 years. Taking into account the measurement uncertainty in the broad H width, the full range of shock speeds for SNR 051969.0 between the limits of minimal and full electron-proton equilibration is 26004500 km s-1 . Taking 0.6, this results in an age of 520900 yrs, in good overall agreement with the age predicted by the light echo study.
5.3.2 SPHERICAL SHELL MODEL RESULTS
Using the above constraints on the shock speed and equilibration, we have computed the shape of the broad Ly line produced by a spherical shell. Using Figure 7 of HM06 we find that for an H line width of 2800 km s-1 (the edge-on shock value of Tuohy et al. 1982) the predicted bulk velocity of the fast neutrals is , rather than the usually assumed value of . In that case 2000 3000 km s-1 for SNR 051969.0 in the range 1. In addition, since the centroids of the FUV emission lines in SNR 051969.0 (Table 2) are consistent with the LMC rest velocity, we assume equal shock speeds and preshock densities for the front and back hemispheres. Using all of these parameters, we were able to match the observed broad Ly profile with a thermal broadening FWHM of 2500 km s-1 , consistent with the lower bound on the H width of Tuohy et al. (1982). The corresponding shock speed is approximately 2600 km s-1 from Figure 7 of HM06, with a correspondingly low electron-proton equilibration ( 0.2). This result is consistent with shock speeds at the lower end of the range predicted in the previous section. It worsens the disagreement between the light echo age of Rest et al. (2005) and our dynamical age estimate, and may provide further evidence of blast wave deceleration.
6. THE EFFECT OF ASSUMED ABUNDANCES
It is clear that our interpretations above are significantly affected by our choice of oxygen abundance via the linear dependence of the F(Ly )/F(1032) ratio on the O/H abundance ratio. Hughes, Hayashi & Koyama (1998) obtained a lower average oxygen abundance than Russell & Dopita (1992) from their analyses of ASCA spectra of LMC SNRs: 8.210.07 dex. It is instructive to consider the effect of such lower O/H ratios on the comparison of our shock models with the observations. If ISM oxygen abundances around all four Balmer-dominated SNRs were set to the values derived by Hughes, Hayashi & Koyama (1998), the modeled O VI 1032 flux would decrease by 28%, raising the predicted F(Ly )/F(1032)ratios in Figure 8 and lowering the range of acceptable preshock neutral fractions. In the case of DEM L 71, the predicted range of acceptable preshock neutral fractions becomes 15%-30%, while a fraction above 30% is allowed for SNR 050967.5. The neutral fraction for SNR 051969.0 is most tightly constrained, with a value close to 30% required to match the new F(Ly )/F(1032)ratio.
7. REDDENING CONSTRAINTS FROM THE FUV SPECTRA OF DEM L 71 AND SNR 051969.0
Aside from the kinematic diagnostics available in the FUV spectra of the Balmer-dominated SNRs, the ratio of Ly to Ly flux is sensitive to the interstellar reddening, providing further useful information on these objects. Over the range of and considered in this paper, the impacting electrons and ions have kinetic energies greatly exceeding the energy difference between the n = 3 and n = 4 levels of hydrogen, and the ratio of these two lines reduces to the ratio of their collision strengths. In addition, the Ly and Ly lines are optically thin due to their large Doppler widths and the low density of the postshock gas. This allows us to ignore radiative transfer of Ly and Ly photons when computing their flux ratio. The ratio is then nearly constant, ranging from approximately 3.3 for minimal equilibration to 3.1 for maximal equilibration.
In the LWRS spectra of DEM L 71 and SNR 051969.0, where emission from both lines has been detected, the Ly / Ly ratios are 3.70.4 and 3.40.5, respectively. Comparing these numbers with the predicted values, these numbers are consistent with low to minimal reddening. Koornneef & Code (1981) noted that the slopes of the Galactic and LMC extinction curves are very similar at 1400 Å. This implies that for the ratio of two line fluxes in this wavelength range, the correction will be nearly identical whether we use an LMC or Galactic extinction law. Indeed, the range of extinctions we derive for DEM L 71 and SNR 051969.0 using a Galactic reddening law (Cardelli, Clayton & Mathis 1989) are very similar to the range derived for the non-30 Doradus regions of the LMC (Fitzpatrick 1985). The color excess predicted for DEM L 71 is then E(B V) = 0.05-0.13, while for SNR 051969.0 we find E(B V) 0.11.
8. DISCUSSION AND CONCLUDING REMARKS
We have presented the first far ultraviolet spectra of the four known Balmer-dominated SNRs in the LMC. These objects - DEM L 71, SNR 050967.5, SNR 051969.0 and SNR 054870.4, are the non-radiative (adiabatic) remnants of Type Ia SN explosions. They feature optical spectra dominated by Balmer line collisional excitation of ambient H I gas overrun by the blast wave. Our FUSE observations resulted in the detection of three of the four SNRs, DEM L 71, SNR 050967.5 and SNR 051969.0. The detected emission lines C III 977, O VI 1032, 1038, Ly and Ly are very broad (600 3700 km s-1 ) and are generated in the thin ionization zones behind the non-radiative shocks. In the case of SNR 050967.5, the only detected feature is faint, broad Ly (FWHM of 3710 km s-1 ); however, this is the first and only broad emission line detected in this SNR since its discovery by Tuohy et al. (1982).
The relative fluxes of the FUV emission lines are sensitive to the shock velocity, preshock neutral fraction and the degree of electron-proton equilibration at the shock front. On the other hand, the widths of the FUV emission lines in Balmer-dominated SNRs are proportional to the relative temperatures of the heavy ions, making them useful diagnostic probes of the degree of ion-ion temperature equilibration in collisionless shocks. These properties make FUV spectra of these SNRs valuable tools for probing the collisionless heating in high Mach number collisionless shocks.
Comparing the F(Ly )/F(1032) flux ratios with predictions from plane parallel and spherical shell models of non-radiative shocks, we find that the observed flux ratios are consistent to within the errors with low to minimal electron-proton equilibration in shocks faster than 2500 km s-1 (observed in SNR 050967.5 and SNR 051969.0). On the other hand, spectra from the interior and limb of DEM L 71 ( 6001000 km s-1 ) show evidence for small to moderate electron-proton temperature equilibration. Our results are generally consistent with the inverse trend between electron-proton equilibration and Mach number derived from optical (Ghavamian et al. 2001, 2002; Rakowski 2005, Ghavamian, Laming & Rakowski 2007) and joint optical and X-ray (Ghavamian, Laming & Rakowski 2007; Rakowski, Ghavamian & Hughes 2003) observations of Balmer-dominated shocks in SNRs.
We have estimated at the shock transition by comparing the broad Ly and O VI emission line widths in our FUSE spectra of the Balmer-dominated LMC remnants. Over the range of shock speeds sampled by our FUSE observations (600 6000 km s-1 ) our observations indicate that increases from 7 for shock speeds near 600 km s-1 to 16 (mass-proportional heating) for shock speeds exceeding 1000 km s-1 . A summary of our modeling results is shown in Table 3. From the shock velocities listed in Table 3 we obtain ages of 295-585 years for SNR 050967.5 and 520-900 years for SNR 051969.0, respectively, in good agreement with the ages estimated for these SNRs by SN light echo studies (Rest et al. 2005).
The main source of uncertainty in our estimates of is our uncertainty in the O VI emission line widths. In the case of SNR 051969.0, the faintness of the O VI lines and their heavy blending with broad Ly makes a precise measurement of their widths difficult. In the case of SNR 050967.5, the O VI emission falls below the detection threshold, allowing only an indirect estimate of the O VI line widths. Although line blending is far less severe in our FUV spectrum of the southern rim of DEM L 71 all the emission lines are intrinsically very faint, again making the measurement of the O VI line widths (and hence ) uncertain. Line blending is also less severe in our FUSE spectrum of the interior of DEM L 71. However, disentangling the frontside from backside emission in this case is the dominant source of uncertainty in measuring .
Modulo the bulk Doppler broadening, our results are consistent with an inverse relationship between the degree of ion-ion equilibration and shock speed, with slower shocks exhibiting more prompt equilibration at the shock front than faster shocks. This trend is similar to that found for the electron-proton temperature equilibration, suggesting that the collisionless processes responsible for prompt electron-proton equilibration at low shock speeds may also cause prompt ion-ion equilibration at low shock speeds. A stronger verification of this trend will require further measurements of in other non-radiative shocks at intermediate velocities (5002500 km s-1 ). Obtaining these observations will remain the subject of future work.
P.G. would like to thank R. C. Smith for providing H images of the Balmer-dominated LMC remnants and J. M. Laming for helpful discussions on the atomic physics of heavy ion excitation. P. G. acknowledges support from NASA grants NNG04GL79G and NAS5-32985, and W.P.B. acknowledges NASA grants NNG04GD150 and NNG05GD75G, all to Johns Hopkins University.
References
- (1)
- (2) Blair, W. P., Ghavamian, P., Sankrit, R. & Danforth, C. 2006, ApJS 165, 480
- (3)
- (4) Blair, W. P., Long, K. S. & Vancura, O. 1991, ApJ, 366, 484
- (5)
- (6) Cardelli, J. A., Clayton, G. C. & Mathis, J. S. 1989, ApJ, 345, 245
- (7)
- (8) Chevalier, R. A. & Raymond, J. C. 1978, ApJ, 225, L27
- (9)
- (10) Chevalier, R. A., Kirshner, R. P. & Raymond, J. C. 1980, ApJ, 235, 186
- (11)
- (12) Davies, R. D., Elliott, K. H. & Meaburn, J. 1976, MmRAS, 81, 89
- (13)
- (14) Draine, B. T. & McKee, C. F. 1993, ARA&A, 31, 373 (p 410)
- (15)
- (16) Dwarkadas, V. V. & Chevalier, R. A. 1998, ApJ, 497, 807
- (17)
- (18) Fitzpatrick, E. L. 1985, ApJ, 299, 219
- (19)
- (20) Ghavamian, P., 1999, PhD thesis, Rice University
- (21)
- (22) Ghavamian, P., Raymond, J., Smith, R. C. & Hartigan, P. 2001, ApJ, 547, 995
- (23)
- (24) Ghavamian, P., Rakowski, C. E., Hughes, J. P. & Williams, T. B. 2003, ApJ, 590, 833
- (25)
- (26) Ghavamian, P., Laming, J. M. & Rakowski, C. E. 2007, ApJ, 654, L69
- (27)
- (28) Hartigan, P., Raymond, J. & Hartmann, L., 1987, ApJ, 316, 323
- (29)
- (30) Hendrick, S. P., Borkowski, K. J. & Reynolds, S. P. 2003, ApJ, 593, 370
- (31)
- (32) Hendrick, S. P. & Reynolds, S. P. 2001, ApJ, 559, 903
- (33)
- (34) Heng, K., & McCray, R. 2006, ApJ, in press (astroph/0609331) (HM06)
- (35)
- (36) Hester, J. J., Raymond, J. C. & Blair, W. P. 1994, ApJ, 420, 721
- (37)
- (38) Howk, J. C., Sembach, K. R., Savage, B. D., Massa, D., Friedman, S. D. & Fullerton, A. W., 2002, ApJ, 569, 233
- (39)
- (40) Hughes, J. P., Hayashi, I. & Koyama, K. 1998, ApJ, 505, 732
- (41)
- (42) Hughes, J. P., Ghavamian, P., Rakowski, C. E. & Slane, P. O. 2003, ApJ, 582, L95
- (43)
- (44) Janev, R. K., 1996, Phys. Rev. A, 53, 219
- (45)
- (46) Kirshner, R. P., Winkler, P. F. & Chevalier, R. A. 1987, ApJ, 315, L135
- (47)
- (48) Koornneef, J., & Code, A. D. 1981, ApJ, 247, 860
- (49)
- (50) Korreck, K. E., Raymond, J. C., Zurbuchen, T. H. & Ghavamian, P. 2004, ApJ, 615, 280
- (51)
- (52) Kriss, G., 1994, Astronomical Data Analysis Software and Systems III, ASP Conf. Series, Vol. 61, p 437
- (53)
- (54) Laming, J. M., Raymond, J. C., McLaughlin, B. M. & Blair, W. P. 1996, ApJ, 472, 267
- (55)
- (56) Long, K. S., Helfand, D. J. & Grabelsky, D. A. 1981, ApJ, 248, 925
- (57)
- (58) Long, K. S. & Blair, W. P. 1990, ApJ, 358, L13
- (59)
- (60) Long, K. S., Blair, W. P., Vancura, O., Bowers, C. W., Davidsen, A. F. & Raymond, J. C. 1992, ApJ, 400, 214L
- (61)
- (62) Merts, A. L., Mann, J. B., Robb, W.D. & Magee, N. H., Jr., 1980, Los Alamos Informal Report LA-8267-MS
- (63)
- (64) Moos, H. W. et al. 2000, ApJ, 538, L1
- (65)
- (66) Rakowski, C. E., Ghavamian, P. & Hughes, J. P. 2003, ApJ, 590, 846
- (67)
- (68) Rakowski, C. E. 2005, AdSpR, 35, 1017
- (69)
- (70) Raymond, J. C., Blair, W. P. & Long, K. S. 1995, ApJ, 454, L31
- (71)
- (72) Raymond, J. C. 2001, AdSpR 99, 209
- (73)
- (74) Raymond, J. C., et al. 2003, ApJ, 584, 770
- (75)
- (76) Rest, A., et al. 2005, Nature, 438, 1132
- (77)
- (78) Russell, S. C. & Dopita, M. A. 1990, ApJS, 74, 93
- (79)
- (80) Russell, S. C. & Dopita, M. A. 1992, ApJ, 384, 508
- (81)
- (82) Sahnow, D. J. et al. 2000, ApJ, 538, L7
- (83)
- (84) Sankrit, R., & Blair, W. P., 2002, ApJ, 565, 297
- (85)
- (86) Smith, R. C., Kirshner, R. P., Blair, W. P. & Winkler, P. F. 1991, ApJ, 375, 652
- (87)
- (88) Smith, R. C., Raymond. J. C. & Laming, J. M. 1994, ApJ, 420, 286
- (89)
- (90) Toshima, N., 1994, Phys. Rev. A, 50, 3940
- (91)
- (92) Tuohy, I. R., Dopita, M. S., Mathewson, D. S., Long, K. S. & Helfand, D. J. 1982, ApJ, 261, 473
- (93)
- (94) Treffers, R. R. 1981, ApJ, 250, 213
- (95)
- (96) Warren, J. S. & Hughes, J. P. 2004, ApJ, 608, 261
- (97)
| Object | Program ID | Aperture | Exp. (ks)aaTotal integration time for each object. Orbital night time fractions are listed in parentheses. | ||
|---|---|---|---|---|---|
| SNR 050567.9 (DEM L 71) | P21403 | 67° 52′ 380 | LWRS | 27.7 (12.7) | |
| SNR 050567.9 (DEM L 71 SW) | C072(03-04),C07206 | 67° 53′ 144 | MDRS | 100.2 (44.6) | |
| SNR 050967.5 | P21402 | 67° 31′ 172 | LWRS | 29.6 (9.7) | |
| SNR 051969.0 | P21401 | 69° 02′ 097 | LWRS | 27.4 (12.7) | |
| SNR 054870.4 | P21404 | 70° 24′ 521 | LWRS | 29.5 (10.4) |
| Object | Broad Ly | O VI | O VI bbThe velocity width and velocity centroid of the 1038 line are tied to the width and centroid of 1032 during spectral fitting. | Broad Ly ccThe velocity width and velocity centroid of Ly are fixed to those of Ly | C III |
|---|---|---|---|---|---|
| SNR 050567.9 (DEM L 71) | |||||
| P214 (LWRS) | |||||
| [Å] | 1027.10.05 | 1033.20.1 | 1038.9 (fixed) | 973.7 (fixed) | 978.7 |
| Vcent [km s-1] | +41015 | +43530 | +435 (fixed) | +410 (fixed) | 48050 |
| VFWHM [km s-1] | 113530 | 74045 | 740 (fixed) | 1135 (fixed) | 490270 |
| Flux [10-14 ergs cm-2 s-1] | 37.21.9 | 6.00.4 | 3.00.3 | 10.00.8 | 1.20.3 |
| C072 (MDRS) | |||||
| [Å] | 1026.80.1 | 1033.10.2 | 1038.8 (fixed) | ||
| Vcent [km s-1] | +32030 | +34560 | +345 (fixed) | ||
| VFWHM [km s-1] | 136575 | 935125 | 935 (fixed) | ||
| Flux [10-14 ergs cm-2 s-1] | 2.40.1 | 0.50.07 | 0.30.06 | ||
| SNR 050967.5 | |||||
| P214 (LWRS) | |||||
| [Å] | 1024.80.24 | ||||
| Vcent [km s-1] | 263125 | ||||
| VFWHM [km s-1] | 3710400 | ||||
| Flux [10-14 ergs cm-2 s-1] | 7.80.6 | ||||
| SNR 051969.0 | |||||
| P214 (LWRS) | |||||
| [Å] | 1026.80.24 | 1033.65.6 | 1039.3 (fixed) | 973.5 (fixed) | |
| Vcent [km s-1] | +32070 | +4951630 | +495 (fixed) | +320 (fixed) | |
| VFWHM [km s-1] | 3130155 | 49751830 | 4975 (fixed) | 3130 (fixed) | |
| Flux [10-14 ergs cm-2 s-1] | 22.00.5 | 5.40.36 | 2.7 (fixed) | 6.40.9 | |
| Object | Plane Parallel | Spherical Shell | |||||
|---|---|---|---|---|---|---|---|
| VS [km s-1] | VS [km s-1] | ||||||
| SNR 050567.9 (DEM L 71) | |||||||
| Blueshifted Shell (LWRS) | 650 | 0.5 | 6.5 | ||||
| Redshifted Shell (LWRS) | 900 | 0.05 | 16 | ||||
| Southern Edge (MDRS) | 775-1005bbEstimate from combined H and X-ray spectroscopy of Rakowski, Ghavamian & Hughes (2003) | 0.05bbEstimate from combined H and X-ray spectroscopy of Rakowski, Ghavamian & Hughes (2003) | 1-9 | ||||
| SNR 050967.5 | |||||||
| Global Spectrum (LWRS) | 5200-6300 | 4-16 | |||||
| SNR 051969.0 | |||||||
| Global Spectrum (LWRS) | 32003900 | 16 | 2600 | 0.2 | |||
| aafootnotetext: When is unconstrained for plane parallel models, the shock velocities are quoted between the limits of minimal and full electron-proton equilibration |