Field galaxies at intermediate redshift () in the direction of the galaxy cluster LCDCS-S001
Abstract
We present spectroscopic and photometric analysis for eight field galaxies in the direction of the galaxy cluster LCDCS-S001. The spectra were obtained with the GMOS instrument in the Gemini South Observatory. The objects were selected in an band image and the multi-object spectroscopic observations were centered at 7 500 Å. For the galaxies ID 440 and ID 461 we have determined redshifts of and , respectively. For the other six galaxies we have confirmed the redshift calculated by Rembold & Pastoriza (2006). The redshifts of the field galaxies are in the range of . We determined the blue and visual luminosities and they are brighter than M. The galaxies ID 180, ID 266, ID 461 follow the Faber-Jackson relation of the Coma and Virgo early-type galaxies, and therefore do not present a brightening of the luminosity as observed in galaxies at higher redshifts. The stellar velocity dispersion was measured for five galaxies (ID 146, ID 180, ID 266, ID 428 and ID 440) and estimated to be in the range of . Lick indices were measured and used to determine the stellar population properties of galaxies ID 120 and ID 146, by means of spectral synthesis. The first galaxy, ID 120, presents in its spectrum absorption and emission lines, and we have found that the main contribution in the flux at 5870 Å is of a 0.1 Gyr stellar population of solar metallicity. For ID 146, the dominant flux contribution at 4200 Å is provided by a stellar population of 10 Gyr of subsolar metallicity. From stellar population synthesis we estimated reddening values of and for ID 120 and ID 146, respectively. According to classical diagnostic diagrams the emission lines present in the spectrum of ID 120 indicate that it is a starburst galaxy.
keywords:
galaxies: clusters: general – galaxies: stellar content – galaxies: intermediate-redshift1 Introduction
Galaxy clusters are one of the fundamental sites to study the formation and evolution of galaxies. Many observational studies in cluster galaxies have revealed that galaxy properties such as colours, morphology and stellar populations vary at different redshifts. Butcher & Oemler (1984) have found in intermediate redshift clusters that the fraction of blue galaxies (Butcher & Oemler, 1984) and galaxies with star formation (Poggianti et al., 1999) is higher than in clusters of the local universe. Luminosity evolution was also observed for galaxies at intermediate redshift with respect to the local galaxies. There was a brightening in blue magnitude in the Faber-Jackson relation (Ziegler & Bender, 1997; Fritz et al., 2005).
Differences between the stellar population of cluster and field galaxies at intermediate and higher redshifts have been revealed. Serote Roos et al. (2005) have found that the field galaxies seem to host less evolved stellar populations than cluster members; and van Dokkum et al. (2001) found that the field early-type galaxies are about 20 % younger than cluster early-type galaxies. Moreover, significant offsets between field and cluster galaxies were derived at z by Treu et al. (2002). However, few observational works on clusters and field galaxies at intermediate redshifts have been published to confirm these results.
In a previous work Rembold & Pastoriza (2006) (hereafter Paper I) presented a study on the kinematic parameters and stellar population properties of galaxies of cluster LCDCS-S001 (). In the field of view of this galaxy cluster several galaxies were observed at intermediate redshifts which are not cluster members. In particular, ID 120 at shows in its spectrum very bright emission lines apparently typical of starburst galaxies. We have studied these galaxies and report in the present paper the more important spectroscopic and photometric results such as redshifts, stellar population, blue luminosity and for ID 120 we discuss the properties of the ionized gas. The paper is structured as follows. In Sect. 2 we describe the observations and data reduction. In Sect. 3 we present the determination of redshifts and velocity dispersions. In Sect. 4 we describe the determination of absolute magnitudes and the relation between luminosity and velocity dispersion. Sec. 5 deals with the stellar population synthesis, describing the measurements of Lick indices, the method used and the results obtained. In Sec. 6 we determine the properties of the nebular gas and the nature of the ionization source. The conclusions are given in Sect. 7. Throughout this paper we adopt a cosmological model with , and .
2 Observations and data reductions
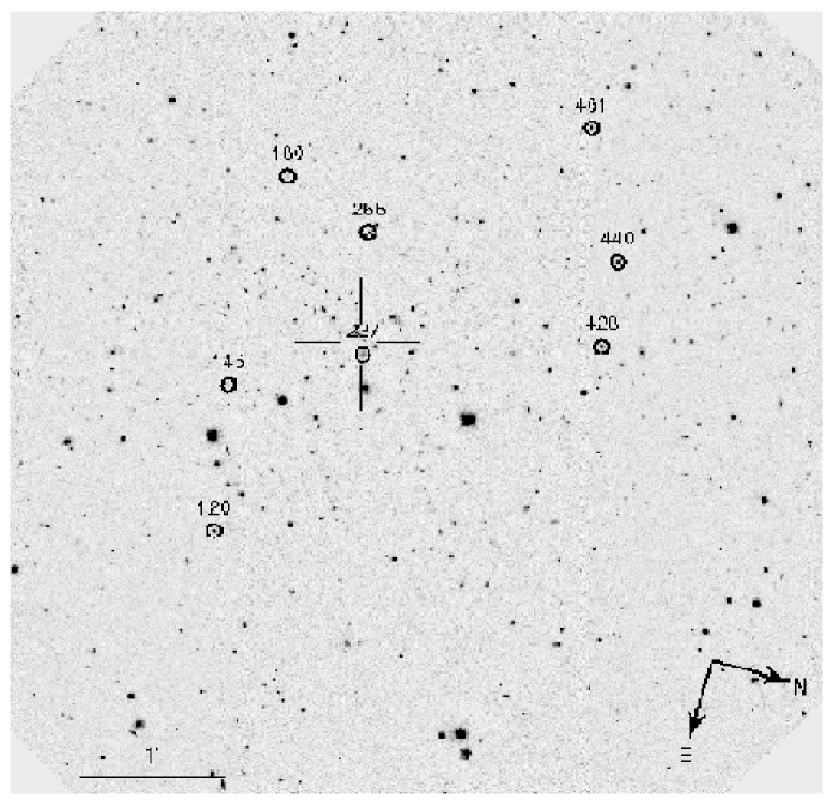
The current paper is based on spectroscopic data obtained on March 2004 with the Gemini Multi-Object Spectrograph (GMOS) of the Gemini South Observatory. The GMOS mask was built using as reference an i’ filter image obtained with GMOS, which covered an area of arcsec2, with a total integration time of 300 seconds. The detector was binned at pixels, giving a spatial scale of 0.146 arcsec pxl-1. The objects included in this study are listed in Table 1. We used a grid of 400 grooves mm-1. The spectra were obtained in the 5 560 to 9 720 Å range with a dispersion of 0.67 Å pxl-1 and a spectral resolution of . Two masks were needed to include all observed objects. The exposure time for each mask was limited to 1200 seconds to minimize the effects of cosmic rays and to obtain a signal-to-noise higher than 3.
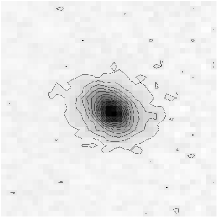
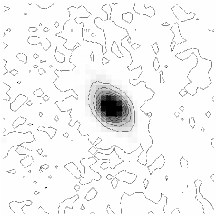
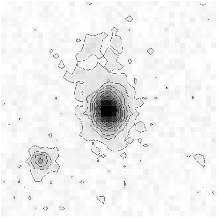
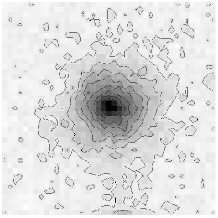
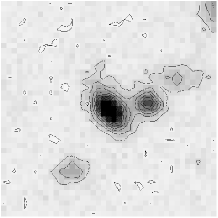
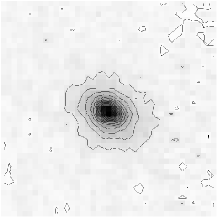
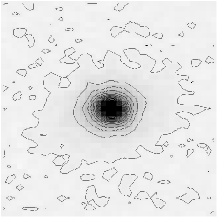
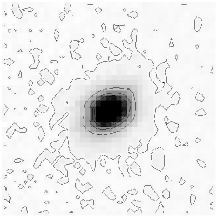
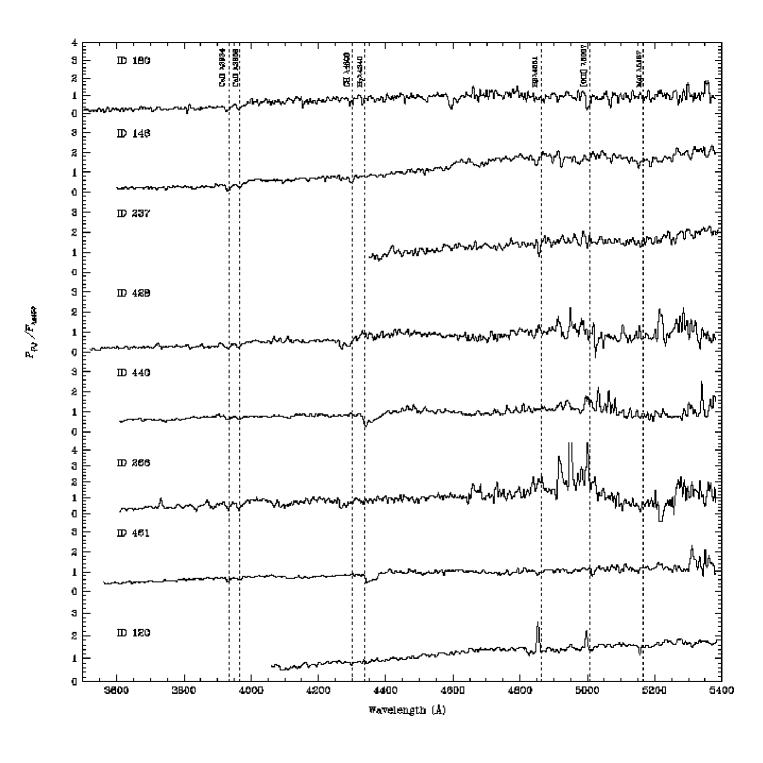
The data reduction followed the standard procedures of bias correction, flat-fielding, cosmic ray cleaning, sky subtraction, wavelength and flux calibrations, and 1D spectra extraction, and was made using mainly the software. The procedures we followed in the data reduction are described in detail in Paper I. Figure 1 shows the full area imaged by GMOS and the analyzed objects, which are numbered and marked with circles. Figure 2 shows the isophotal maps in the band for each galaxy of our sample. In Figure 3 we present one dimensional spectra where the most prominent lines are identified and listed in Table 1.
| ID | (2000) | (2000) | z | (km s | M | MB | MV | Spectral lines | |
|---|---|---|---|---|---|---|---|---|---|
| 120 | 0.2201 | … | 21.42 | -18.75 | … | -18.20 | CH , , [\textO iii] , [\textO iii] , | ||
| \textMg i , NaD ,[\textN ii] , , | |||||||||
| [\textN ii] ,[\textS ii] , [\textS ii] | |||||||||
| 146 | 10 06 21.10 | -12 59 07.7 | 0.3910 | 21719 | 21.50 | -20.11 | -18.64 | … | \textFe i , \textFe i , \textFe i , , |
| \textCa ii ,\textCa ii , , \textCa i , | |||||||||
| CH ,\textFe i , , [\textN i] | |||||||||
| 180 | 10 06 14.90 | -12 59 07.9 | 0.6508 | 27458 | 21.75 | -21.20 | -20.66 | … | \textCa ii , \textCa ii , CH , |
| 237 | 10 06 19.22 | -12 58 17.0 | 0.2607 | … | 20.82 | -19.46 | … | -18.93 | , [\textO iii] |
| 266 | 10 06 15.80 | -12 58 28.8 | 0.7784 | 20023 | 21.89 | -21.54 | -21.29 | … | , , , \textCa ii , |
| \textCa ii | |||||||||
| 428 | 10 06 17.14 | -12 56 41.6 | 0.7784 | 27889 | 21.82 | -22.08 | -22.45 | … | \textCa ii , \textCa ii |
| 440 | 10 06 14.71 | -12 56 44.8 | 0.7464 | 34612 | 20.98 | -22.34 | -22.01 | … | \textCa ii , \textCa ii |
| 461 | 10 06 11.24 | -12 57 10.8 | 0.7465 | … | 20.47 | -22.85 | -22.52 | … | \textCa ii , \textCa ii |
Conventions: , : equatorial coordinates;
| ID 120 ( z= 0.2201 ) | ID 146 ( z= 0.3910 ) | ID 180 ( z= 0.6508 ) | ID 237 ( z= 0.2607 ) |
 |
 |
 |
 |
| ID 266 ( z= 0.7784 ) | ID 428 ( z= 0.7784 ) | ID 440 ( z= 0.7464 ) | ID 461 ( z= 0.7465 ) |
 |
 |
 |
 |
3 Determination of redshifts and velocity dispersions
The spectroscopic redshifts for ID 120, ID 146, ID 180, ID 237, ID 266, and ID 428 were taken from Paper I. In this work we determined the redshift only for the galaxies ID 440 and ID 461. The redshift of these galaxies was calculated by the average recession velocity given by the individual lines and estimated to be around and for ID 440 and ID 461, respectively. The galaxy cluster LCDCS-S001 has a median cluster redshift of 0.709 and an estimated velocity dispersion of (see Paper I), therefore the last galaxies are not cluster members. Note that the galaxies of our sample can be separated into two sets: one (ID 120, ID 146, ID 237) located to the east of the cluster center, in the redshift range ; and the other set of galaxies (ID 266, ID 428, ID 440, ID 461) is to the west of the center and the redshift is in the range . The galaxy ID 180 to the west of the cluster center is at redshift . The error associated with the redshift for each galaxy, estimated from the standard deviation of the individual redshifts, are practically negligible, below 1%.
The velocity dispersions, , of the observed galaxies were determined from the measurements of corrected full-width-at-half-maximum, , assuming Gaussian profiles for the absorption lines. The effects of the instrumental dispersion and resolution on the observed FWHM were estimated from the measurements of the absorption lines \textCa ii and \textCa ii observed in the spectrum of a G star identified in the field. We have found that the velocity dispersions for most of our galaxies (ID 146, ID 180, ID 266, ID 428, ID 440) are in the range . The galaxies ID 120, ID 237 and ID 461 have velocity dispersions of the order of the instrumental resolution and therefore are not estimated. The values of redshift and velocity dispersions are listed in Table 1.
4 Determination of absolute magnitudes
In this paper we have estimated the absolute magnitudes MB and MV for our sample of galaxies using the values of photometric magnitude taken from Paper I and the and magnitudes derived from the observed spectra. In order to calculate these magnitudes we have calibrated the observed spectra using the photometric magnitude. Note that the GMOS filters are defined in the system as
| (1) |
We have transformed the spectra to the restframe system and applied for the fluxes the correction for cosmological dimming. Then, we have calculated the and magnitudes from the spectra by integrating the fluxes through a set of filter response curves using the sbands routine of the onedspec package of the NOAO/IRAF. Finally, we added this magnitude to the distance modulus, calculated as a function of the galaxy redshift z adopting the cosmological model assumed in this paper. The values of MB, MV and also of M (taken from Paper I) are listed in Table 1. We verify that our field galaxies display a correlation between redshift and absolute magnitude in band as well as in the band. This means that high luminosity galaxies are detected at higher redshift, while low luminosity galaxies are detected mainly at lower redshifts. This behavior is a selection effect for samples that are chosen based on magnitudes. The total error associated with the absolute magnitudes was estimated to be in the range of 0.12 to 0.37 mag. This error was estimated considering (a) the uncertainties due to the continuum signal-to-noise ratio in each spectrum and (b) the uncertainties of the magnitude, which are mainly due to errors on the count fluctuations, the assumption of the zero-point and the lack of a color term correction.
5 Faber-Jacskon relation
It is well known that elliptical and lenticular galaxies follow the scaling relation between galaxy luminosity and velocity dispersion (Faber & Jackson, 1976), which is widely used to obtain important information about elliptical galaxies. This is called the Faber-Jackson relation and is valid both for local and intermediate redshift galaxies. We searched in our sample if there are early-type galaxies that follow this relation and present a brightening of blue magnitude with respect to local clusters of galaxies as inferred by Ziegler & Bender (1997) .
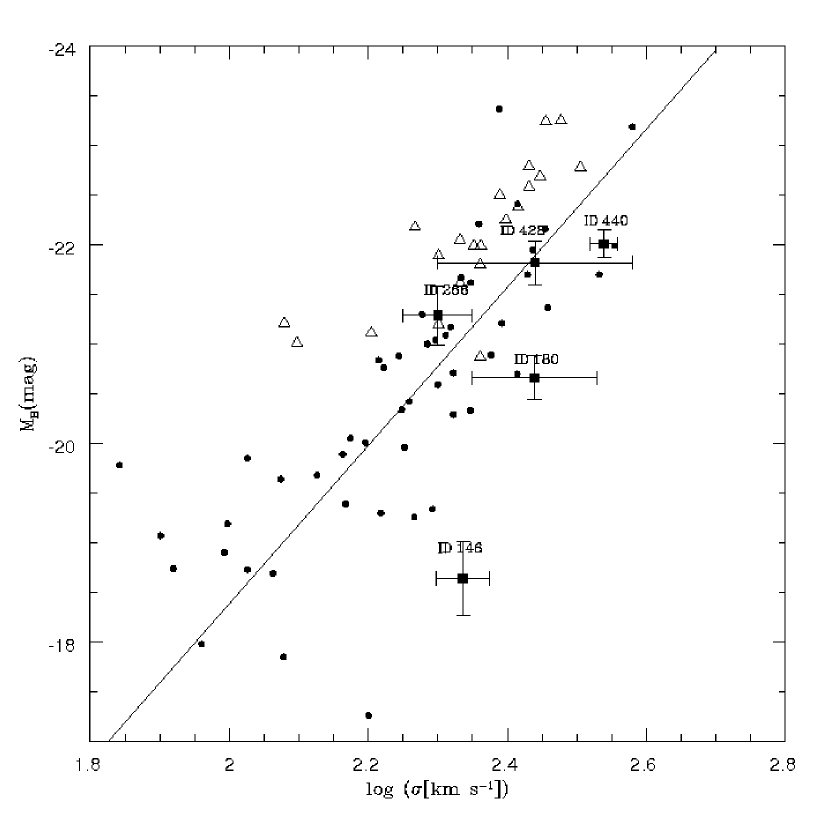
In Figure 4 the MB versus relation for the galaxies ID 146, ID 180, ID 266, ID 428 and ID 440 is plotted and also compared with data of a sample of Coma and Virgo elliptical galaxies (Dressler et al., 1987) and elliptical galaxies of clusters at (Ziegler & Bender, 1997). As can be seen in this Figure, the galaxies ID 180, ID 266, ID 428 and ID 440 follow the Faber-Jackson relation indicating that they are early-type galaxies. The isophote maps of the first three galaxies are typical of ellipticals. In the case of ID 440 the isophotal map shows an extended structure probably due to the presence of a disc, therefore this galaxy may be lenticular. Deep imaging with higher spatial resolution is necessary to confirm the morphology of these galaxies.
The galaxy ID 146 follows the Faber-Jackson relation marginally, that is, a difference of about 2 mag is present between this galaxy and the derived fit by (Ziegler & Bender, 1997) for Coma galaxies. Also, it can be seen in Figure 2 that the more external isophote shows an extended structure. Therefore, this galaxy probably has a morphology intermediate between lenticular and early spiral. The remaining galaxies ID 120, ID 237 and ID 461, have velocity dispersions of the order of the instrumental resolution and due to their isophotal map morphology they might be spiral galaxies.
The most important result obtained in this section is that the early-type field galaxies (ID 146, ID 180, ID 266, ID 428 and ID 440) have velocity dispersions and luminosities comparable to those of members of Coma and Virgo clusters and do not present a brightening of blue magnitude as observed by Ziegler & Bender (1997) for elliptical galaxies at .
6 Stellar population synthesis
We have performed the stellar population synthesis method developed by Bica (1998), in order to describe the age distribution of the stellar population of these galaxies and get some insights about their metallicity. This synthesis method uses the equivalent widths of spectral absorption features and measured continuum fluxes at a given wavelength and compares them to the same quantities measured from a base of simple stellar population elements, which in turn have known ages and metallicities. The algorithm used is based on a upgraded version of Schmitt et al. (1996), which also corrects the effect of the internal extinction that affects the stellar population.
The employed were those defined by the Lick system (Worthey & Ottaviani, 1997; Trager et al., 1998). Previous to the measurements of the and the spectra have been normalized at 5870 Å for ID 120 and at 4200 Å for ID 146 and ID 180. The values for each galaxy are listed in Table 2. The base elements that we have used were taken from the Bruzual & Charlot (2003) evolutionary stellar population models, which are based on a high resolution library of observed stellar spectra. This library allows us to derive a detailed spectral evolution of simple stellar populations across the wavelength range of 3 200 to 9 500 with a wide range of metallicities. We have used the Padova 1994 tracks as recommended by Bruzual & Charlot (2003).
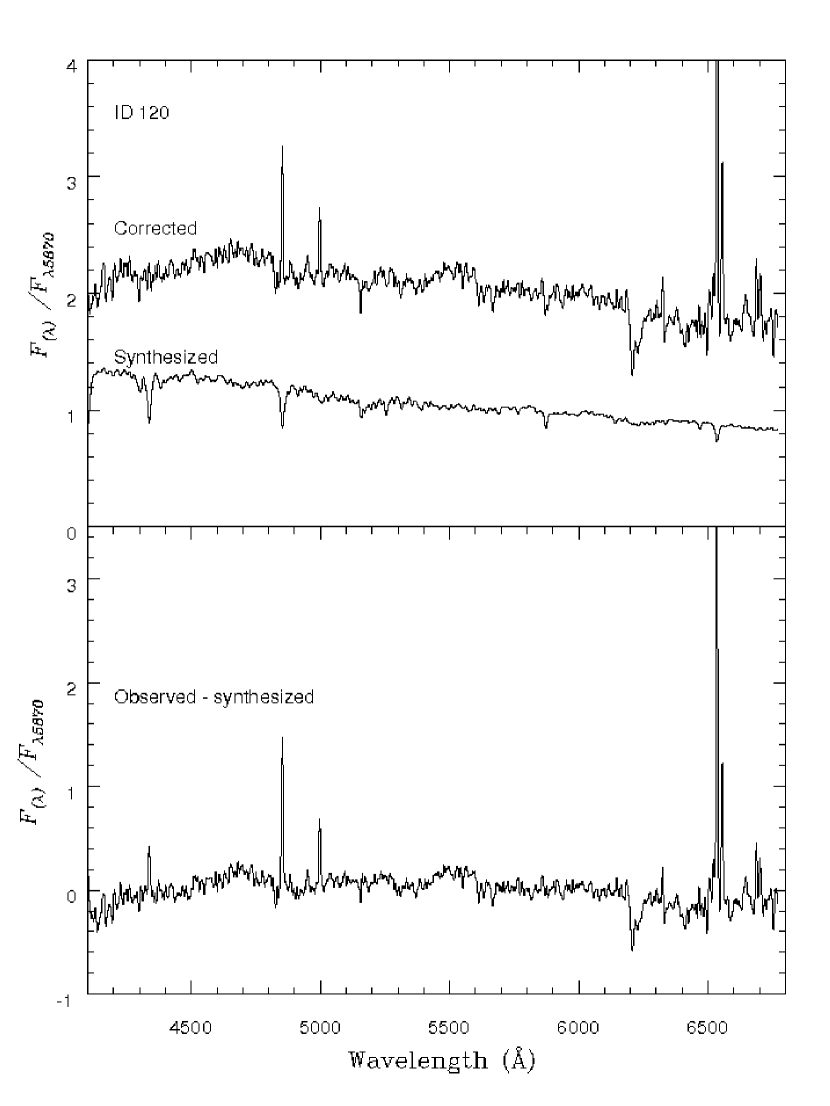
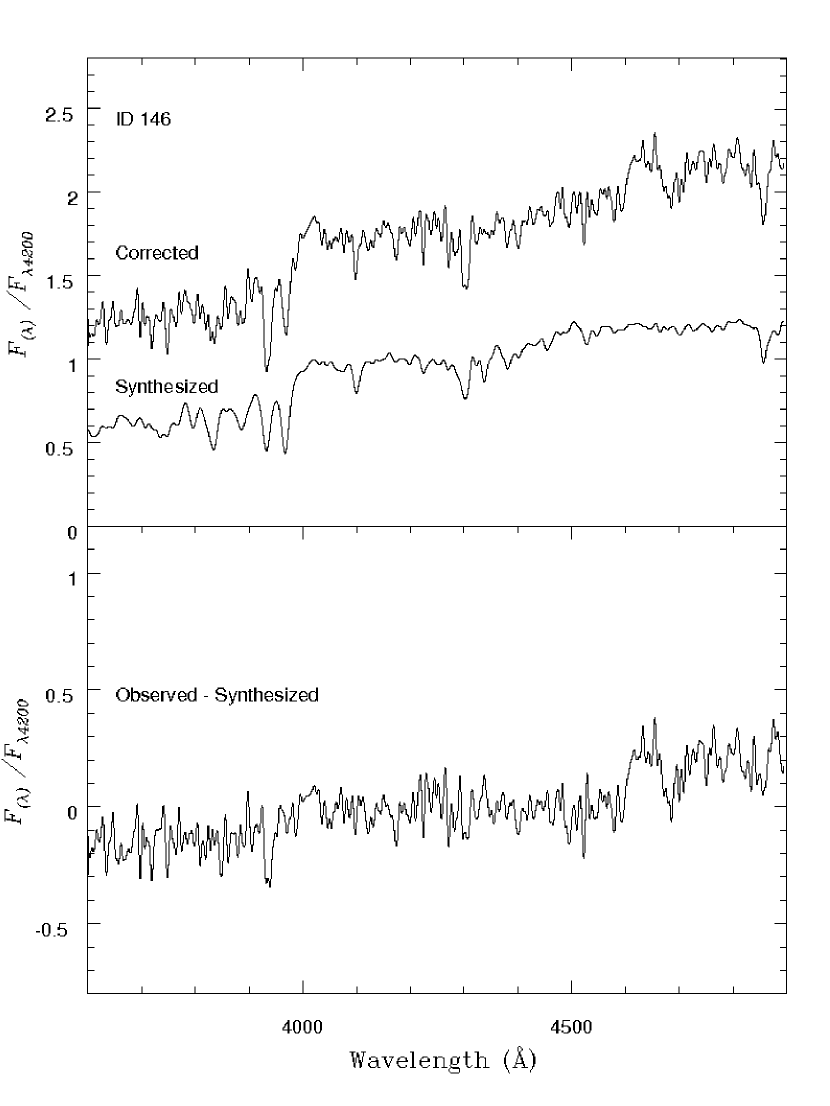
In the present work, we derived the stellar population for ID 120 () and ID 146 (), the only galaxies in our sample with enough measured Lick indices that allow us to perform a reliable stellar population synthesis. Following the cosmological model adopted, the age of the universe at redshift and is around 10 and 9 Gyrs, respectively. Ten and 9 Gyrs were the upper limit ages for the spectral base of ID 120 and ID 146, respectively. The synthetic base consists of a set of 12 spectra with ages of 0.1, 1.0, 5.0, 9.0 and 10.0 Gyrs and metallicities of , (solar) and . Note that we have chosen this range of metallicities because it was only possible to measure a limited number of Lick indices in our spectra. The synthesis results for ID 120 and ID 146 are presented in Table 3 as the percentual contribution of each template to the normalized spectrum, and the values obtained from the synthesis. Figures 5 and 6 show the spectra corrected for reddening and the synthesized population spectra constructed by the sum of the base spectra according to the proportions given by the synthesis. According to the stellar population synthesis, the galaxy ID 120 has an important contribution of young stellar populations (0.1 Gyr), about 47%. Despite this contribution of a younger population, it is still made up of about 32 % of an old stellar population (10 Gyr) and the remaining is of intermediate age stellar population. A very large reddening of was obtained from the synthesis. A solar metallicity is a better fit for this galaxy. In a general way, the estimates of old, intermediate and young stellar populations for ID 120 are in agreement with those derived by Serote Roos et al. (2005) for field galaxies at intermediate redshifts.
For the galaxy ID 146 its spectrum is best fitted by the template set of subsolar metallicity () with a dominant contribution of almost 60 % of an old stellar population (10 Gyr) and a significant contribution of about 19% and 17% from intermediate components of 1 Gyr and 5 Gyr, respectively. Also, a young (0.1 Gyr) stellar population was marginally detected ( 5 %). The synthesis indicates a noticeable reddening in the spectrum, .
Differences between the stellar population of field galaxies and cluster members have been reported by Serote Roos et al. (2005). These authors have performed stellar population synthesis in the cluster members of CL 0048-2942 (), as well as, in the field galaxies ( and ) and have found in a general way, that field galaxies seem to host less evolved stellar populations than cluster members. Unfortunately, since we can only derive the stellar population for two galaxies, ID 120 and ID 146, we cannot compare the stellar populations of field galaxies and cluster LCDCS-S001 members.
| Equivalent width (Å) | ID 120 | ID 146 | ID 180 |
|---|---|---|---|
| H | … | 2.560.13 | … |
| \textCa i 4227 | … | 1.570.14 | … |
| G | 1.324 | 5.641.13 | 6.670.67 |
| … | … | 2.910.87 | |
| … | 4.200.50 | … | |
| \textMg i | 1.70 | … | … |
| NaD | 2.76 | 10.140.61 | … |
| ID 120 | ID 146 | |||
|---|---|---|---|---|
| Age (Gyr) | 5870 flux fraction | Age (Gyr) | 4200 flux fraction | |
| Z=0.02 | (%) | Z=0.004 | (%) | |
| 0.1 | 46.642.91 | 0.1 | 5.214.00 | |
| 1 | 8.515.63 | 1 | 18.894.88 | |
| 5 | 13.569.10 | 5 | 16.743.36 | |
| 10 | 32.296.27 | 9 | 59.162.91 | |
| 0.82 | 0.90 | |||
7 Ionized gas
As discussed earlier, the spectrum of the galaxy ID 120 presents conspicuous emission lines. In this section we investigate the physical properties and the ionization source of the gas in this galaxy.
First, we subtracted the contribution of the stellar population from the spectrum using the results of the stellar population synthesis. Then, we estimated the line intensities using Gaussian line profile fitting procedures, which are listed in Table 4.
In order to identify the main excitation source of the gas in ID 120 we used the standard diagnostic diagrams with emission line ratios of easily observed lines, such as, the classical diagrams log ([\textO iii]) versus log ([\textN ii]) and log ([\textO iii]) versus log ([\textS ii]) (Veilleux & Osterbrock, 1987). They are applied either for nearby galaxies (Pastoriza et al., 1999) and to galaxies at higher redshifts (Maier et al., 2005; Lamareille et al., 2006). In these diagnostic diagrams, the emission line ratios of ID 120 are located \textH ii region zone.
We derived the electron density from the [\textS ii] intensity ratio by solving numerically the equilibrium equations for a -level atom using the routine of the package of assuming an electron temperature of 10 000 K. The energy levels, transition probabilities and collisional strength values for [\textS ii] were taken respectively from Bowen (1960), Keenan et al. (1993) and Ramsbottom et al. (1996). A value of was estimated, which is compatible with the ones derived in the range of by Puech et al. (2006) in 6 galaxies at and are typical values of classical galactic \textH ii regions (Copetti et al., 2000) as well as of giant extragalactic \textH ii regions (Castaneda et al., 1992).
Considering that the emission lines of ID 120 are produced in an \textH ii region we have employed the photoionization code Cloudy/96.03 (Ferland, 2002) to produce a model of \textH ii region that reproduces the observed emission lines intensities. Basically, the input nebular parameters in the models are the metallicity , ionization parameter , upper stellar mass limit , age and electron density . The , and were chosen to be initially 40 M☉, 2 Myr and -2.5, respectively, and were changed interactively until a suitable solution was found, following the same fitting procedures adopted by Dors & Copetti (2006) (see description details in this paper). Besides, we have assumed in our models an electron density of and solar metallicity - since the synthesis results indicate that the spectrum of ID 120 is better fitted with this metallicity.
We found an excellent agreement between the observational data and the model of , = 100 , and age of 5.5 Myr (see Table 4). The oxygen abundance derived is compatible with the solar composition of estimated by Allende Prieto et al. (2001) and with measurements of abundance derived for other star forming galaxies at intermediate redshift (Barrientos et al., 1996; Contini et al., 2002; Lilly et al., 2003; Lamareille et al., 2006; Mouhcine et al., 2006). For example, Mouhcine et al. (2006) derived oxygen abundances for a sample of 40 luminous field galaxies with redshifts in the range of and found that their values are ranging from 8.4 to 9.0, with a median of 8.7. Besides, these studies about metallicity in galaxies at intermediate redshift have confirmed that the relation between luminosity and metallicity found in these galaxies is very similar to the relation obtained for galaxies in the local universe. The values of and M derived for ID 120 are compatible with the values of luminosity and metallicity for galaxies at intermediate redshifts found by these authors.
| Line | Obs. | Mod. |
|---|---|---|
| [\textO iii] | 41.951.97 | 48.00 |
| [\textN ii] | 98.504.24 | 98.00 |
| [\textS ii] | 36.182.02 | 36.00 |
| [\textS ii] | 32.613.61 | 33.00 |
8 Conclusions and final remarks
We present spectroscopic and photometric analysis for eight field galaxies in the direction of the galaxy cluster LCDCS-S001. The photometric and spectroscopic data were obtained with the GMOS instrument in the Gemini South Observatory and consists of an -band image for the cluster field and spectra centered at 7500 Å. The main findings are the following:
-
1.
Redshifts of and were determined for the field galaxies ID 440 and ID 461, respectively. For the other six galaxies we have confirmed the redshift calculated by Rembold & Pastoriza (2006). The redshifts of the field galaxies are in the range of
-
2.
Stellar velocity dispersions were measured for 5 field galaxies and were found to be in the range of .
-
3.
Blue luminosities were calculated for 6 galaxies which are brighter than M.
-
4.
The galaxies ID 180, ID 266, ID 428 and ID 461 follow the Faber-Jackson relation and therefore are early-type. In these galaxies we did not detect a brightening of the luminosity with respect to the local galaxies.
-
5.
Lick indices were measured for ID 120 and ID 146 and used to determine their stellar population properties, by means of spectral synthesis. In a general way, we found that ID 146 has an dominant contribution of an old stellar population ( 10 Gyr) of subsolar metallicity. ID 120 presents a spectrum with both emission and absorption lines, having an important contribution, of about 47 %, of young stellar population and a significant contribution of about 32% of older population ( 10 Gyr). The spectrum of ID 120 is better fitted with solar metallicity. Large reddening values of and were derived for ID 120 and ID 146, respectively.
-
6.
According to the classical diagnostic diagrams the emission lines present in spectrum are produced in an \textH ii region. An electron density of was derived from the [\textS ii] ratio.
-
7.
The values of and M derived for ID 120 are compatible with the values of luminosity and metallicity found by other authors for galaxies at intermediate redshifts.
Acknowledgments We thank the referee, Dr. Florence Durret, for helpful comments and suggestions. This work has been partially supported by the Brazilian institution CNPQ.
References
- Allende Prieto et al. (2001) Allende Prieto, C., Lambert, D. L., & Asplund, M. 2001, ApJ, 556, L63
- Barrientos et al. (1996) Barrientos, L. F., Schade, D., & Lopez-Cruz, O. 1996, ApJ, 460, L89
- Bica (1998) Bica, E. 1988, A & A, 195, 9
- Bowen (1960) Bowen, I. S. 1960, ApJ, 132, 1
- Bruzual & Charlot (2003) Bruzual, G., & Charlot, S. 2003, MNRAS, 344, 1000
- Butcher & Oemler (1984) Butcher, H., & Oemler, A., Jr. 1984, ApJ, 285, 426
- Castaneda et al. (1992) Castaneda, H. O., Vilchez, J. M., & Copetti, M. V. F. 1992, A & A, 260, 370
- Contini et al. (2002) Contini, T., Treyer, M. A., Sullivan, M., & Ellis, R. S. 2002, MNRAS, 330, 75
- Copetti et al. (2000) Copetti, M. V. F., Mallmann, J. A. H., Schmidt, A. A., & Castañeda, H. O. 2000, A & A, 357, 621
- Dors & Copetti (2006) Dors, O. L., Jr., & Copetti, M. V. F. 2006, A&A, 452, 473
- Dressler et al. (1987) Dressler, A., Lynden-Bell, D., Burstein, D., Davies, R. L., Faber,S, M., Terlevich, R. J., Wegner, G., 1987, ApJ, 313, 42
- Faber & Jackson (1976) Faber, S. M., & Jackson, R. E. 1976, ApJ, 204, 668
- Ferland (2002) Ferland, G. J. 2002, Hazy, a brief introduction to Cloudy 96.03, Univ. Kentucky, Dept. Phys., Astron. internal report
- Fritz et al. (2005) Fritz, A., Ziegler, B. L., Bower, R. G., Smail, I., & Davies, R. L. 2005, MNRAS, 358, 233
- Keenan et al. (1993) Keenan, F. P., Hibbert, A., Ojha, P. C., & Conlon, E. S. 1993, Phys. Scr. A., 48, 129
- Kormendy (1977) Kormendy, J. 1977, ApJ, 217, 406
- Lamareille et al. (2006) Lamareille, F., Contini, T., Le Borgne, J.-F., Brinchmann, J., Charlot, S., & Richard, J. 2006a, A & A, 448, 893
- Lamareille et al. (2006) Lamareille, F., Contini, T., Brinchmann, J., Le Borgne, J.-F., Charlot, S., & Richard, J. 2006b, A & A, 448, 907
- Lilly et al. (2003) Lilly, S. J., Carollo, C. M., & Stockton, A. N. 2003, ApJ, 597, 730
- Maier et al. (2005) Maier, C., Lilly, S. J., Carollo, C. M., Stockton, A., & Brodwin, M. 2005, ApJ, 634, 849
- Mouhcine et al. (2006) Mouhcine, M., Bamford, S. P., Aragón-Salamanca, A., Nakamura, O., & Milvang-Jensen, B. 2006, MNRAS, 369, 891
- Nakamura et al. (2006) Nakamura, O., Aragón-Salamanca, A., Milvang-Jensen, B., Arimoto, N., Ikuta, C., & Bamford, S. P. 2006, MNRAS, 366, 144
- Pastoriza et al. (1999) Pastoriza, M. G., Donzelli, C. J., & Bonatto, C. 1999, A& A, 347, 55
- Poggianti et al. (1999) Poggianti, B. M., Smail, I., Dressler, A., Couch, W. J., Barger, A. J., Butcher, H., Ellis, R. S., & Oemler, A. J. 1999, ApJ, 518, 576
- Puech et al. (2006) Puech, M., Flores, H., Hammer, F., & Lehnert, M. D. 2006, A & A, 455, 131
- Ramsbottom et al. (1996) Ramsbottom, C. A., Bell, K. L., & Stafford, R. P. 1996, ADNDT, 63, 57
- Rembold & Pastoriza (2006) Rembold S., & Pastoriza, M. G. 2006, MNRAS, in press
- Schmitt et al. (1996) Schmitt, H. R., Bica, E., & Pastoriza, M. G. 1996, MNRAS, 278, 965
- Serote Roos et al. (2005) Serote Roos, M., Lobo, C., Durret, F., Iovino, A., & Márquez, I. 2005, A& A, 429, 101
- Trager et al. (1998) Trager, S. C., Worthey, G., Faber, S. M., Burstein, D., & Gonzalez, J. J. 1998, ApJS, 116, 1
- Treu et al. (2002) Treu, T., Stiavelli, M., Casertano, S., Møller, P., & Bertin, G. 2002, ApJ, 564, L13
- van Dokkum et al. (2001) van Dokkum, P. G., Franx, M., Kelson, D. D., & Illingworth, G. D. 2001, ApJ, 553, L39
- Veilleux & Osterbrock (1987) Veilleux, S., & Osterbrock, D. E. 1987, ApJS, 63, 295
- Worthey & Ottaviani (1997) Worthey, G., & Ottaviani, D. L. 1997, ApJS, 111, 377
- Ziegler & Bender (1997) Ziegler, B. L., & Bender, R. 1997, MNRAS, 291, 527