Oxygen abundance of open cluster dwarfs
Abstract
We present oxygen abundances of dwarfs in the young open cluster IC 4665 deduced from the O I 7774 triplet lines and of dwarfs in the open cluster Pleiades derived from the [O I] 6300 forbidden line. Stellar parameters and oxygen abundances were derived using the spectroscopic synthesis tool SME (Spectroscopy Made Easy). We find a dramatic increase in the upper boundary of the O I triplet abundances with decreasing temperature in the dwarfs of IC 4665, consistent with the trend found by Schuler et al. in the open clusters Pleiades and M 34, and to a less extent in the cool dwarfs of Hyades (Schuler et al. 2006a) and UMa (King & Schuler 2005). By contrast, oxygen abundances derived from the [O I] 6300 forbidden line for stars in Pleiades and Hyades (Schuler et al. 2006b) are constant within the errors. Possible mechanisms that may lead a varying oxygen triplet line abundance are examined, including systematic errors in the stellar parameter determinations, the NLTE effects, surface activities and granulation. The age-related effects stellar surface activities (especially the chromospheric activities) are suggested by our analysis to blame for the large spreads of oxygen triplet line abundances.
1 Introduction
Oxygen is an abundant element of particular relevance for the Galactic chemical evolution and its formation history. Oxygen in long-lived low-mass stars represents the chemical composition of the gas at the time those stars are formed and carries information of the chemical history of stars in different populations in our Galaxy. It is a bona fide primary element formed exclusively in the interiors of massive stars and then released to the interstellar medium (ISM) via Type II supernova explosions. By analyzing oxygen abundances relative to the iron group elements in the atmosphere of different type stars, one can trace the history of SN II feedback and the occurrence rates of Type II and Type Ia supernova explosions.
Recent reviews on stellar oxygen abundance analyses are given by King (1993), Israelian et al. (1998), Nissen et al. (2002) and Takeda (2003). Oxygen has a limited number of lines in the visual part of stellar spectra. Apart from molecular OH lines in the ultraviolet (UV) and in the infrared (IR), oxygen abundances are traditionally determined from the high-excitation O I 3s 5So – 3p 5P 7771.94, 7774.16, 7775.39 triplet permitted lines or from the much weaker [O I] 2p4 3P – 2p4 1D 6300.30, 6363.78 forbidden lines. Both methods have their advantages and disadvantages. The triplet lines are strong and therefore easy to measure, and are free from blending effects. However, their strengths can be significantly affected by effects such as deviations from the local thermal equilibrium (LTE) (e.g., Kiselman 1993). On the other hand, although the 6300,6363 forbidden lines are believed to be free from the non-LTE (NLTE) effects (e.g., Kiselman 1991; Takeda 2003), they are much weaker than the triplet lines and blended with lines from other species. The stronger component 6300 of the doublet is blended with a Ni I line at 6300.34 Å (Lambert 1978; Johansson et al. 2003), whereas the weaker 6363 line can be contaminated by a weak CN red system line (Lambert 1978). Discrepancies between oxygen abundances deduced from the two indicators for field stars have long been observed and the possible causes have been much discussed. In particular, in metal-poor stars, a distinct trend has been reported in the sense that the permitted lines tend to yield systematically higher oxygen abundances than the forbidden lines (e.g., Cavallo et al. 1997). An inspection of the parameter-dependence of the discordance indicates that the extent of the discrepancy tends to be comparatively lessened for stars of high and/or (Takeda 2003).
Many efforts have been attempted to resolve the discrepancy. King (1993) suggested that the temperature scale for metal-poor dwarfs is probably 150-200 K too low and revised the scale upward to bring the oxygen abundances derived from the two indicators into better agreement. However, the assumptions made by King (1993) in determining the theoretical colors were challenged by Balachandran & Carney (1996). A controversial factor in oxygen abundance determinations has been the role of the NLTE corrections. Kiselman & Nordlund (1995) re-examined the treatment of the NLTE effects in earlier studies and concluded that the cross sections for inelastic collisions with neutral hydrogen may have been overestimated. They argued that while adjusting stellar parameters cannot resolve the oxygen abundance discrepancy, it can be by resorting to more realistic 3D models. NLTE corrections of oxygen abundances deduced from the triplet lines have been performed by many investigators (e.g., Tomkin et al. 1992; Mishenina et al. 2000; Carretta et al. 2000; Nissen et al. 2002; Takeda 2003). It is shown that the formation of the O I triplet is quite simple in the sense that only the transition related quantities are important, but not the details of the atomic model. It is also found that the NLTE effects of those particular lines can be well described by a classic two-level-atom model and that the metallicity cannot be an essential factor (c.f. Takeda 2003 and the references therein).
While the physical cause of the discrepancy between the oxygen abundances derived from the two types of line remains an open question, a modest view is that the abundances from the forbidden lines are probably less problematic given their weak -sensitivity and negligible NLTE effects, and should therefore be more reliable than those derived from the permitted lines. On the other hand, given the weakness of the forbidden lines, the permitted lines remain indispensable, in particular for the analysis of warm stars and for stars of low metallicities.
Members of an open cluster are assumed to form from a chemically homogeneous cloud in a short time scale, such that they should all have the same chemical composition. Stars in a cluster are distinguished only by mass and thus provide good test beds to probe the underlying physical cause of the discrepant oxygen abundances determined from the permitted lines and from the forbidden lines. Schuler et al. (2004) reported their analysis of oxygen abundances for a sample of late F, G and K dwarfs of the open clusters Pleiades (100 Myr) and M 34 (250 Myr). They find a dramatic increase of the O I triplet abundance with decreasing effective temperature in both clusters. Later on, similar but to a less extent trends are found in UMa (King & Schuler 2005) and Hyades (Schuler et al. 2006a; for stars with 6000 K). In Hyades, oxygen triplet abundances of stars with 6000 K increase with increasing temperature due to NLTE effect. The phenomenon were not found in the other open clusters probably because of their limited star samples. In contrast to the trend in oxygen triplet line abundances, [O I] 6300 line abundances of three Pleiades stars (Schuler et al. 2004) and 8 Hyades stars (Schuler et al. 2006b) are nearly constant and yield average values much lower compared to the triplet line results. Schuler et al. (2004, 2006a) suggest that surface inhomogeneities rather than chromospheric activities are possibly the main cause of the anomalous oxygen triplet line abundances. On the other hand, Morel & Micela (2004) compare oxygen triplet line and forbidden line abundances for stars spanning a wide range of activity level and find that the magnitude of the abundance discrepancy increases with increasing level of chromospheric/coronal activities.
Here we present oxygen triplet line abundances for a sample of dwarfs of the open cluster IC 4665 (35 Myr, Mermilliod 1981). In our previous analysis (Shen et al. 2005), we showed that within the measurement uncertainties the iron abundance is uniform, with a standard deviation of 0.04 dex. This upper limit in the dispersion of [Fe/H] among the IC 4665 member stars was used to infer that the total reservoir of heavy elements retained by the nascent disks is limited. Nevertheless, gas giant planets can form through core-accretion in protostellar disks around these stars near snow lines where the surface density of water ice may be significantly enhanced (Ida & Lin 2004, Ciesla & Cuzzi 2006). In this case, the emergence of gas giants may introduce a dispersion in [O/H] among the cluster member stars.
A first step in this difficult task is to calibrate the Oxygen abundance as a function of stellar parameters. In addition to our sample of the IC 4665 member stars, forbidden line oxygen abundances for several Pleiades dwarfs are also obtained. Section 2 describes the observations and procedures of data reduction. Oxygen abundances determined from the two types of line are presented in Section 3. Possible explanations for the abundance determination discrepancy are discussed in Section 4, followed by a brief summary in Section 5.
2 Observations and data reduction
Observations of both clusters were carried out in October 1999 and October 2000 using the HiRes spectrograph (Vogt 1992) mounted on the Keck I 10 m telescope. The spectra were recorded on a Tektronix CCD of pixel size. For stars of IC 4665, the spectra spanned a wavelength range from to 8730 Å, split into 16 orders, with small interorder gaps amongst them. The integration time ranged from 10 minutes to half an hour, yielding signal-to-noise ratios ranging from to 150 per resolution element. For Pleiades stars, the spectra covered from to 6900 Å with signal-to-noise ratios of 200 to 400. The Pleiades spectra have previously been used by Wilden et al. (2002) to study the metallicity dispersion amongst the member stars. A detailed description of those spectra can be found there. All spectra have a resolving power of about 60,000.
All spectra were reduced using iraf in a similar manner as described in Soderblom et al. (1993). The noao.imred.echelle package was used for flat-fielding, scattered light removal, order extraction and wavelength calibration. The latter was achieved using exposures of a Th-Ar lamp.
We did not include all 18 IC 4665 stars which have been analysis in our first paper devoted to IC 4665 (Shen et al. 2005; Paper I thereafter). The three cool stars P 332, P 349 & P 352 are found to have abnormal stronger absorption than that of normal dwarfs at the same temperatures. Given that the membership of the three stars are only based on the color-magnitude diagram, it is likely to us that they are background subgiants but not members in IC 4665. We thus exclude them from our sample so that they would not affect our oxygen abundance analysis results. Further proper motion detection is need to clarify the membership of them. The existence of these subgiants in our sample would not affect our conclusions in Paper I.
By performing on our spectra the cross-correlation analysis with solar spectrum, we found that P 19, our hottest star is a binary. The separation of the two members on the spectrum is 1.5 Å. Based on the relative flux at , we suggest that the companion is a hot A type star. Given that A stars have much weaker flux than the late F stars at the red part of the spectrum and the spectrum line separation of them are large, the existence of a companion would not affect our analysis results either on stellar parameters or on element abundances. P 19 is thus kept in our sample.
3 Abundance determinations
Spectral synthesis analyses were carried out using the software package SME (Spectroscopy Made Easy) developed by Valenti & Piskonov (1996). SME can be used to determine stellar and atomic parameters by matching the synthetic spectrum to the observed one. It consists of a spectral synthesis code written in C++ and a parameter optimization routine written in IDL. It uses Kurucz stellar atmospheric models. The input parameters include , , radial and rotational velocities, micro- and macro-turbulence velocities, element abundances, and a list of spectral line atomic data ( and the van der Waals damping constants). The overall metallicity, quantified by parameter [M/H], is used to interpolate a grid of model atmospheres and to scale the solar abundance pattern (except for helium and the elements with individually solved abundances) when calculating the opacities. [M/H] is an independent model parameter, rather than a quantity constructed from the abundances of individual elements. Effects on stellar atmosphere caused by deviations of individual element abundances from the solar abundance pattern are neglected. This is appropriate as the current work only deals with stars of approximately solar metallicity. We assume the [M/H] of stars in IC 4665 and Pleiades to be zero. SME solves the radiative transfer to generate a synthetic spectrum. A nonlinear least squares algorithm is then used to solve for any subset of the aforementioned input parameters. The radiative transfer routine assumes LTE, no opacity from molecular lines and negligible magnetic field.
A 10 Å wide spectral segment centered at 7774 Å was selected to solve for the O I triple line abundance. Fig. 1 compares the observed (histogram line) and SME synthesized (smooth curve) profiles of the oxygen triplet lines in four stars, spanning a wide range of effective temperatures and rotational velocities. The deduced oxygen abundances are presented in Table 1 [assuming a solar oxygen abundance O = 8.87 on a logarithmic scale where H = 12.00 (Grevesse, Noels & Sauval 1996)]. In Table 1, the stellar parameters , and micro-turbulent velocities are listed in Columns (2)–(4), respectively. Columns (5)–(6) give, respectively, the emission fluxes taken from Martín & Montes (1997) and the logarithmic X-ray luminosities divided by the bolometric luminosity , log , taken from Giampapa, Prosser & Fleming (1998). Column (7) gives the amplitude of modulation in the V-band from Allain et al. (1996). Columns (8)–(9) give, respectively, the oxygen triplet line abundances and their uncertainties for three stars, selected to represent different temperature regimes spanned by our sample stars. Column (10) gives the oxygen triplet abundances deduced from the equivalent width measurements. A detailed description of the procedures used to determine the stellar parameters and element abundances has been presented in our Paper I. Full results, including stellar parameters and abundances of other individual elements are presented there along with a detailed error analysis.
To investigate the discrepancies between the oxygen abundances derived from the permitted triplet lines on the one hand and those deduced from the forbidden lines on the other, the simplest way is to directly compare the two set of abundances. However, our current set of spectra of IC 4665 were hampered by limited wavelength coverage (the stronger component 6300 of the [O i] 6300,6363 fell on the edge of the spectra) and by relatively low S/N ratios, and we were unable to derive oxygen abundances from the weak 6300,6363 forbidden lines. Instead, we have used the [O I] 6300 abundances deduced for dwarfs of the Pleiades. This is reasonable, given that the two clusters have very similar metallicities and ages. The Pleiades spectra of Wilden et al. (2002) did not cover the oxygen triplet lines, yet the much higher S/N ratios of those spectra allowed us to determine oxygen abundances using the [O I] 6300 forbidden line for six of them, i.e. H II 129, 250, 522, 1039, 1298, and 2462. In the current analysis, we have adopted the stellar parameters determined by Wilden et al. (2002).
The [O I] 6300 line is known to be contaminated by a weak Ni I line (Lambert 1978; Johansson et al. 2003). To be consistent with the previous work of Schuler et al. (2004), we modeled the blending Ni I line assuming a (Allende Prieto et al. 2001). Apart from the Ni I line, between the narrow wavelength range of 6300.1–6300.5 Å where the [O i] 6300 line falls, Kurucz lists dozens CN lines on his web site111http://kurucz.harvard.edu/LINELISTS/LINESMOL/. However these weak CN lines are believed to be only important for the continuum opacities and so far no cases of significant contribution of CN lines to the observed [O I] 6300 line strengths have been reported for solar type stars (see, e.g., Allende Prieto et al. 2001; Schuler et al. 2004). We have also considered possible contamination of the [O I] 6300 line by telluric absorption. From the line list of the solar spectrum of Moore et al. (1966), the nearest telluric absorption line to the [O I] line is at 6299.23 Å, in addition to two unidentified absorption lines at 6299.41 and 6299.59 Å. Pleiades has a heliocentric radial velocity of km s-1 (Kharchenko et al., 2005), leading to a blue-shift of km s-1, or Å in wavelength at 6300 Å at the time the spectra were taken, in good agreement with the average value of 0.3 Å determined from nearby strong lines in our spectra. We thus conclude that it is unlikely that our measurements of the [O I] 6300.30 line were affected by the nearby telluric absorption line and the two nearby lines of unknown origin.
The 6300 feature was well fitted using the atomic data for the [O I] 6300 line retrieved from the VALD (Vienna Atomic Line Database; Piskunov et al. 1995; Ryabchikova et al. 1999; Kupka et al. 1999), after taking into account contribution from the blending Ni I line. As such, we have not solved the atomic data for the [O I] 6300 line, but instead adopted those retrieved from the VALD. In order to reduce the systematic errors, we re-measured the Ni abundances in the six stars using Ni I lines in the wavelength segments 5575–5595, 5636–5657, and 6107–6132 Å. Atomic data for Ni lines in those wavelength segments were solved using the National Solar Observatory solar spectrum (Kurucz et al. 1984). The Ni abundances derived by us (H II 129: 6.11; H II 250: 6.11; H II 522: 6.15; H II 1039: 6.13; H II 1298: 6.15; H II 2462: 6.12) agree with those obtained by Wilden el al. (2002) within 0.04 dex. Contributions from the [O I] forbidden line and from the Ni I line to the observed 6300 Å feature were synthesized separately. The resultant synthetic spectra as well as their sum are plotted in Fig. 2 and compared to the observed ones. The oxygen abundances thus derived from the 6300 forbidden line are listed in Table 2.
Stellar elemental abundances are traditionally derived using the equivalent width (EW) method. For comparison, we have also determined the oxygen triplet abundances from the measured EWs of the O I triplet lines. The results are listed in Table 1. The EWs were measured using multiple Gaussian fits. The oxygen abundances were then derived using ABONTEST8, a program developed by P. Magain. ABONTEST8 uses LTE plane-parallel model atmospheres given by Kurucz (1993). We have adopted stellar parameters deduced from SME. Uncertainties of the results were dominated by those in the measured EWs, which were estimated using the equation given by Norris et al. (2001). For cool stars in our sample, the spectra had typical S/N’s between 30–50 and uncertainties in the derived oxygen abundances were estimated to be about 0.15–0.25 dex. For warm stars, the spectra had better S/N’s and the uncertainties are smaller. Compared to SME values, oxygen abundances derived from the EW method are found to be 0.15 dex lower on average, with a standard deviation of 0.11 dex and a maximum difference of 0.4 dex. Larger deviations are obtained for stars with lower temperatures.
We have also measured the EWs of the [O I] 6300 line and calculated oxygen abundances. Contributions from the blending Ni I line to the observed EWs of the [O I] 6300 line were estimated and corrected for using the EWs of the Ni I 6300.34 line measured on SME model spectra. The results are listed in Table 2. Within the uncertainties, they are consistent with the SME values. The mean value of the EW-based abundances is 0.05 dex, only 0.04 dex lower than the average of the SME-based abundances. Note that the 6300 absorption line falls in the extended wings of two nearby strong Si I 6299.60 and Fe I 6301.50 lines. The presence of these strong lines makes the placement of local continuum rather difficult, leading to large uncertainties in EW measurements, in particular for weak lines such as the [O I] 6300 line. By contrast, these strong lines are well modeled in SME and therefore abundances deduced using the SME method are less affected by their presence.
4 Discussion
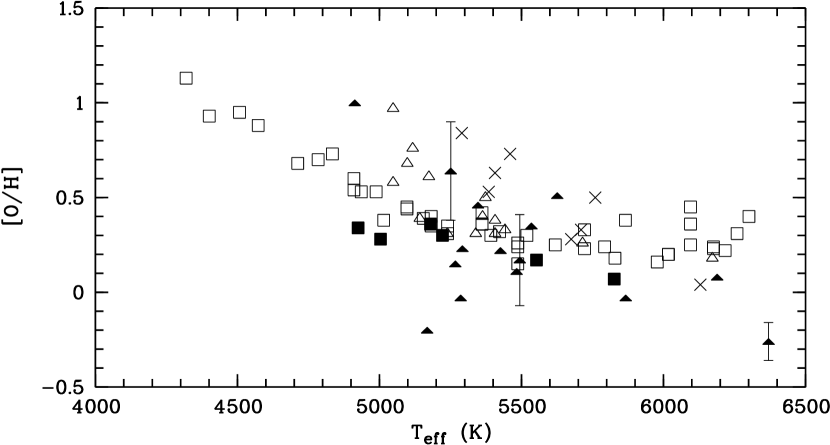
Oxygen abundances relative to the solar value for a sample of 15 IC 4665 stars, derived from the triplet permitted lines, are plotted in Fig. 3 against effective temperature . Typical error bars for three selected stars of representative values of are indicated in the diagram. The upper boundary of the abundance show a clear trend with , increasing dramatically by about 1.3 dex as decreases from to 4900 K. For stars of intermediate ( K), the abundances exhibit a large scatter. A similar trend is also found for EW-based triplet line oxygen abundances, which show variations over a range of 1.0 dex, only slightly smaller than the spread of 1.3 dex for the SME-based values. This demonstrates that the observed scatter is not an artifact caused by our SME analysis method. The upper boundary trend is similar to what found previously for dwarfs in Pleiades and M 34 by Schuler et al. (2004), and to a less extent for the cool dwarfs (6000 K) in Hyades by Schuler et al. (2006a) and UMa by King & Schuler (2005) based on the method of EW analysis. However, no large spread within small intervals has been reported in the other open clusters as in IC 4665.
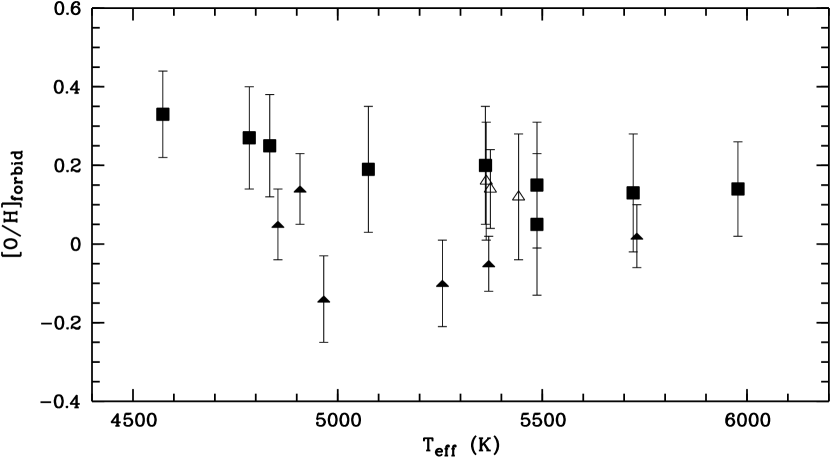
In contrast to the triplet abundances, no such trend is found for oxygen abundances deduced from the 6300 forbidden line. In Fig. 4 we plot the [O I] abundances of six Pleiades stars in our sample against and another three Pleiades stars previously analyzed by Schuler et al. (2004). Also included in the figure are oxygen forbidden line abundances of 8 Hyades stars taken from Schuler et al. (2006b) based on stellar atmosphere models with overshoot. Fig. 4 shows clearly that oxygen abundances of Pleiades stars derived from the [O I] forbidden line have small scatter over the entire range of , from to 5800 K. The three stars of Schuler et al. (2004) yield an average [O I] abundance of 0.14 dex, which is 0.15 dex higher than our mean abundance of 0.01 dex. The measured EWs of the [O I] 6300 line in the sample of Schuler et al. (2004) are generally 1–2 mÅ stronger than ours. However, given the estimated observational error of 3 mÅ from Schuler et al. (2004), the EW differences seem not so significant. I prefer that the abundance difference between the two works are due to the systematic errors. Although the three coolest dwarfs (4573 4834 K) seem to increase with decreasing , [O I] abundances of stars in Hyades do not show spreads within the stated uncertainties. The Hyades [O I] abundances are still almost constant with a mean value of 0.19 dex which is consistent with the metallicity of Hyades ([Fe/H]=0.13; Paulson et al. 2003).
Under the assumption that member stars of a given open cluster all have the same chemical composition, an assumption that is indeed supported by measurements of oxygen abundances using the [O I] forbidden line, it is probably reasonable to assume that the dramatic increase of the oxygen triplet line abundances with decreasing as shown in Fig. 3 is an artifact and therefore the triplet line abundances do not represent the true stellar surface oxygen abundances. Rather, it seems that they must have been affected by some systematic effects which are a strong function of . Possible mechanisms that might be responsible for the abnormal triplet line oxygen abundances include systematic uncertainties in the abundance determinations, NLTE effects, granulation, surface activities (e.g., chromospheric activities, stellar spots). We examine these possibilities one by one in the following subsections.
4.1 Abundance determination uncertainties
In Paper I, we discuss our method of effective temperature determination and compare the results with those deduced from the photometric method using color indices. In our analysis based on SME, we use about one hundred iron lines of different excitation energies when determining the effective temperature and require that they yield self-consistent element abundances. SME however does not directly force a balance in the excitation potential or ionization states. Instead, it uses a Levenberg-Marquardt algorithm to minimize in a synthetic spectral model of the observed spectrum. During this process, each line gives its own independent verdict regarding the free parameters, regardless whether SME is used to solve stellar parameters such as , or element abundances. The standard deviations of the ensemble of hundreds of lines provides estimates of the uncertainties in the derived parameter. On the other hand, as previously found by Valenti & Fischer (2005), this algorithm generally grossly underestimates the true uncertainties. The lack of a trend in [Fe/H] with (see Paper I) gives a post-check that the analysis has been properly carried out, in other words, we have properly determined. The method has the advantage that the results are insensitive to potential uncertainties in the stellar atmospheric models and in the photometric measurements of the color indices. In the spectroscopic method, the effective temperature and element abundances are determined from the same set of observations, thus avoiding any potential uncertainties introduced by combining observations obtained with different instruments and telescopes in order to calibrate the color indices.
In Paper I, we estimate that SME temperatures are accurate to K. The estimate was based on the fact that the differences between temperatures derived from SME and from colors yield a standard deviation of only 141 K and the fact that we believe that spectroscopic temperatures are more accurate than color temperatures. By adding in quadrature the measurement error in a single observation, and the numerical error yielded by the analysis algorithm (the standard deviation of final parameter values about the mean for each observation, due only to differences in initial values), Valenti & Fischer (2005) estimated the uncertainties for temperatures obtained by fitting a single observation of a generic star to be 44 K. Their work was based on an improved version of SME. Given that our spectra generally have lower S/N’s than theirs, it is probably realistic to assume that our estimates of are accurate to approximately 100 K. Values of were calculated using Eq. (16.2) of Gray (1992) and assigned a nominal uncertainty of 0.1 dex. Our estimates of typical uncertainties of 100 K for , 0.1 dex for and 30% for are in line with what assumed by Wilden et al. (2002) who also adopt SME in their analysis.
The effects of uncertainties in individual stellar parameters on the derived element abundances have been analyzed in Paper I. The oxygen triplet permitted lines are sensitive to effective temperature, surface gravity, and microturbulent velocity determinations. In order to obtain an estimate of the relative error of the triplet line oxygen abundance, we recalculated the abundance by varying the effective temperature by amounts of K, by dex and the microturbulent velocity by %. Calculations were carried for three stars (here we changed P 332 in Paper I to P 71 as the former has been excluded from the sample. The calculated uncertainty difference between P 332 and P 71 would not affect our results in Paper I.), selected to represent the full range of effective temperature of stars in the current sample. Uncertainties introduced in the process of line profile fitting were also estimated and incorporated into the final error budget by varying the elemental abundance and then analyzing its effects on the residuals of the fit. The results, tabulated in Table 1, show that even though the total formal errors of oxygen abundances derived from the triplet lines can reach as much as 0.26 dex for stars of effective temperatures lower than 5500 K, they are insufficient to account for the observed systematic variations of the oxygen triplet line abundances of more than 1 dex as shown in Fig. 3.
Valenti & Fischer (2005) have used SME Version 2 to derive stellar parameters and elemental abundances for a sample of over 1000 Galactic field stars, mainly of dwarfs of spectral types F, G and K, using high quality spectra obtained as a by-product of the California & Carnegie Planet Search program. A thorough error analysis was also carried out and some trends of the deduced elemental abundances as a function of were found. They interpreted such trends as spurious and used polynomial fits to remove them. In all cases, the corrections amount to less than 0.2 dex for the temperature range from 4900 to 6400 K. Such trends are not unique to SME but also exist in other methods of abundance analysis, such as those based on EWs (e.g. Schuler et al. 2003). But more importantly, the range of variation of the triplet line oxygen abundances observed in Fig. 3 is so large such that we deem it highly unlikely that the variations are of similar origins of the spurious trends found in Valenti & Fischer (2005).
Uncertainties in the derived [O/H]forbid abundances are dominated by photon shooting errors as a result of the limited S/N ratios of the weak diagnostic line. For oxygen abundances derived from the forbidden line, uncertainties caused by errors in and in are essentially identical for all the sample stars and amount to 0.02 and 0.04 dex, respectively, for stars in our sample. The [O I] line is very weak and therefore not affected by microturbulent velocity determinations. The total errors in the deduced abundances are obtained by adding photon shooting errors and those introduced by uncertainties in and in in quadrature. The results are listed in the last column of Table 2. Fig. 4 shows that the abundances deduced from the [O I] forbidden line have a much smaller scatter compared to those derived from the O I triplet lines. The values vary over a range of 0.28 dex with a standard deviation of 0.1 dex, comparable to the uncertainties of 0.07–0.11 dex for individual measurements. The sample yields an average [O I] abundance of 0.01 dex, i.e. nearly identical to the solar value.
4.2 NLTE effects
The O I triplet lines are known to suffer from the NLTE effects. For a wide range of stellar atmosphere parameters, the NLTE effects will lead to overestimated oxygen abundances (e.g. Gratton et al. 1999; Takeda 2003). The effects are however small, less than 0.1 dex for cool ( K) dwarfs of approximately solar metallicity. For stars of higher temperatures, the NLTE effect are expected to be larger (Takeda 2003). Thus the trend caused by the NLTE effects is exactly opposite to what observed. It seems highly unlikely that the nominal NLTE effects are responsible for the trend observed in Fig. 3.
Observations (e.g., King & Boesgaard 1995) show that for stars with K triplet-based oxygen abundances are enhanced compared to forbidden line-based values, in agreement with the theoretical predictions of Takeda (2003) for main-sequence stars of K. On the other hand, the enhancement is small (about 0.18 dex) and is likely to be lost in the huge variations depicted in Fig. 3 even if it exists in IC 4665. We note that P 19 ( K), the warmest star in our sample, has the lowest oxygen abundance. Its spectrum is of high quality, with a S/N of 150. SME and EW analyses give very similar abundances, [O/H] and dex, respectively. According to the theoretical calculations of Takeda (2003), the EWs of the oxygen triplet lines measured for P 19 implies an NLTE correction of dex. Applying this correction will lead to very low oxygen abundance of 0.5 dex for P 19. Even the existence of a binary companion is not likely to affect its oxygen abundance. It appears to us that P 19 does seem to have an abnormally low oxygen abundance compared to other member stars of the cluster.
In their analysis of the open cluster M 34, Schuler et al. (2003) find that Si abundances derived from lines of high excitation potentials ( eV) increase with decreasing temperature, whereas abundances of Fe, Ti, Cr, Ca, Al and Mg, all derived from lines of relatively low excitation potentials (–4 eV), decrease. They suggest that overexcitation/ionization, caused by deviations from the LTE in cool stars, may be responsible for the observed abundance trends. Similar trends are also observed in our results of abundance analysis for IC 4665 (Paper I) and those for the Pleiades by Wilden et al. (2002), where it is found that as decreases, Si abundance, deduced from lines with 6 eV, increases, whereas Cr abundance, derived from lines of 0–4 eV, decreases. There are however exceptions. For example, in IC 4665, Ti abundance determined from lines of –2 eV increases as decreases. Given the relatively high excitation potential of the oxygen triplet lines, it is difficult to rule out the possibility that the observed strong increase of the oxygen triplet line abundances with decreasing is caused by overexcitation/ionization as proposed by Schuler et al. (2003). Further quantitative investigations of this scenario, i.e. deviations from the LTE can indeed result in overexcitation/ionization in cool stars, and if so, its effects on elemental abundances derived from lines of different excitation potentials, are highly desirable.
4.3 Surface activities
4.3.1 Chromospheric activities
Takeda (1995) suggests that the oxygen triplet line formation could be affected by chromospheric activities. In their analysis of 14 single-lined RS CVn binaries, Morel & Micela (2004) find suspiciously high O I triplet line abundances, by as much as 1.8 dex, in chromospherically active systems. They plot oxygen abundances deduced from the triplet lines and from the forbidden line against chromospheric activity indicators, including strength of the Ca II HK lines and X-ray flux. They find that for both RS CVn binaries and stars of young open clusters, as the level of chromospheric activity increases, the O I triplet line abundance increases, whereas those derived from the forbidden lines remains nearly constant around the solar value. The results of Morel & Micela strongly suggest that the steep rise of the O I triplet line abundance with decreasing is probably caused by chromospheric activities. However, one difficulty of the study was that all stars in their RS CVn binary sample have effective temperatures near or below 5000 K. As a result, Morel & Micela were unable to rule out the possibility that the observed large variations of the oxygen triplet line abundances with was not caused by inadequacy in the Kurucz LTE atmospheric models for late K-type stars. On the other hand, a recent analysis of six K dwarfs and subgiants by Affer et al. (2005) shows that the usage of LTE Kurucz model atmospheres does not lead to large variations of oxygen triplet line abundances in those old K stars which have low surface activities.
From an analysis of more than 200 active stars in open clusters and in the field, Messina et al. (2001) concluded that the strength of activities increases from zero-age, reaching maxima around the age of Pleiades (70 Myr), and then declines. If surface activities account for the observed behavior of the triplet line abundance, then one would expect a correlation between the linear fitting slope of the oxygen triplet line abundances as a function of effective temperature and the age of the open clusters. We calculated the slopes for stars with below 6000 K in each cluster. Stars with 6000 K are excluded because they are believed to be affected by NLTE effect (e.g., Schuler et al. 2006a). From the currently rather restricted amount of data, we find almost identical absolute values of the slopes for the two younger open clusters Pleiades (70 Myr) and M 34 (250 Myr) of () and ( respectively, compared to the much smaller slopes of () and ( for the older clusters UMa (600 Myr) and Hyades (600 Myr). The slope of IC 4665 (35 Myr) is also much small (), comparable to those of UMa and Hyades. The result seems to be consistent with the prediction of Messina et al. (2001). We should notice that the small slope of IC 4665 is due to the large scatter around 5400 K. Comparing the triplet abundances variation of different clusters within the same range in Fig. 3, IC 4665 stars show a much higher oxygen abundance upper boundary than the older clusters UMa and Hyades. Although inconclusive, these results seem to suggest that age-related effects (e.g., surface activities including chromospheric activity, stellar spots and flares) is influencing triplet abundance determinations for young open clusters.
In order to clarify the role of chromospheric activity in the behavior of oxygen triplet abundance in young open clusters, we calculated a factor R based on the emission of chromospheric activity sensitive lines and Ca II IRT 8498,8662. Montes & Martín (1998) provide a set of standard quiet stars observed at high-resolution thus we can use them in the application of the spectral subtraction technique to obtain the active-chromosphere contribution to these activity-sensitive lines. We calculated R from the fluxes (F) of and Ca II IRT 8498,8662 by
The standard quiet stars are chosen from the sample of Montes & Martín (1998) to have similar as the IC 4665 stars. The results are listed in Table 3. Observational errors are also estimated and listed in columns (5)-(7). Column (8) of Table 3 gives the errors of the O I triplet abundance for each star, calculated from a linear fitting equation of and the uncertainties of the three representative stars.
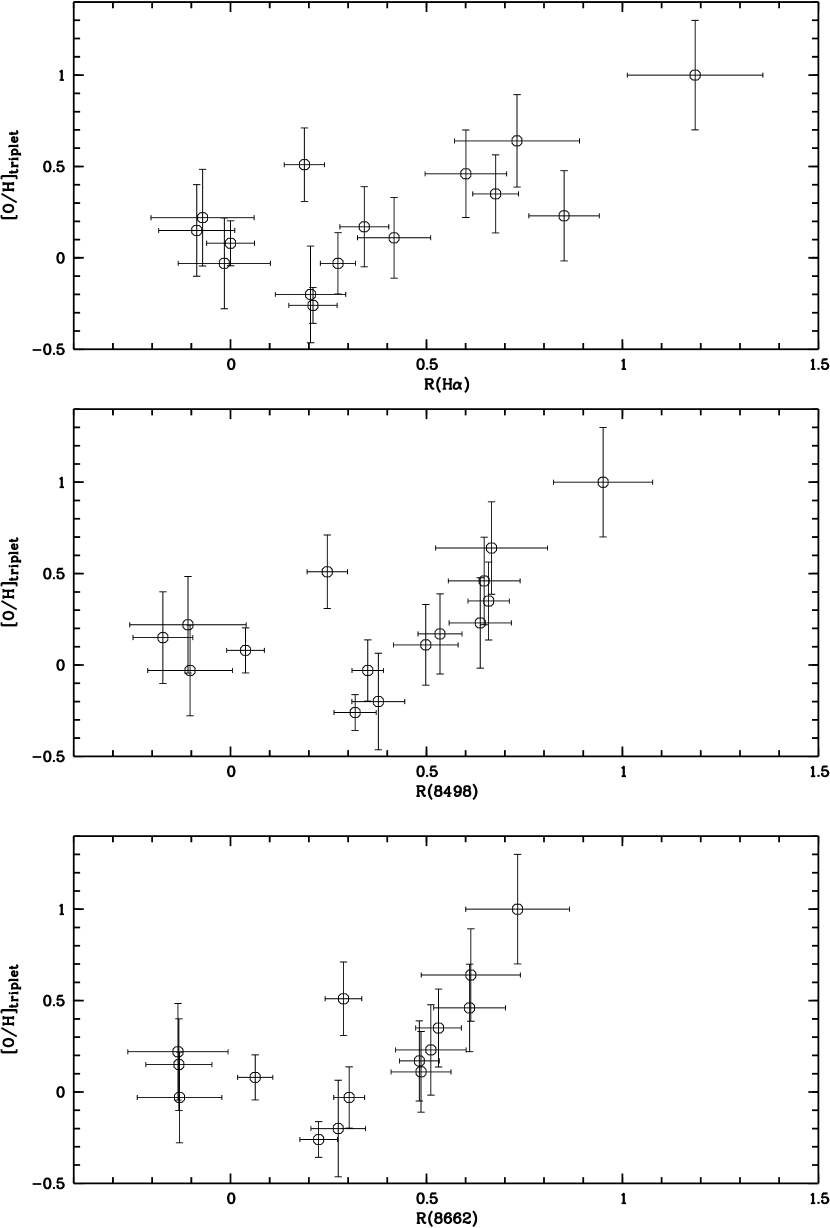
The oxygen triplet abundance is plotted against the three activity indicators R(H), R(8498), and R(8662) in Fig. 5. The linear correlation coefficients of the triplet line abundances with the activity indicators are calculated and listed in Table 4. Given the correlation coefficients of 0.69, 0.55 and 0.57 of the oxygen triplet abundances with the three indicators respectively, only marginal correlations could be suggested for them. However, from Fig. 5, we find that for stars with high R (high activity), there does exist a clear correlation between triplet abundances and the activity indicators, whereas the stars with low R show totally no correlation. Given that the stars which show near-zero or even nagative R meaning that they should have stable chromospheric activity also have oxygen abundances which are consistent with the [O I] abundances within uncertainties, it is likely that the oxygen triplet abundance variation of the four stars with R smaller than 0.1 is just due to errors other than activities. If we excluded these 4 stars whose triplet abundances are not affected by chromospheric activities, the linear correlation coefficients of oxygen triplet abundances with the activity indicators would increase to 0.76, 0.73 and 0.81 for the remaining stars, which are significant at the confidence levels of 99.99%, 99.98% and 99.99%, respectively. These are much convinced values to support that chromospheric activity is responsible for the oxygen triplet abundance behaviors. The only point which prevents the correlation coefficients to increase over 0.90 is P 107, a fast rotator whose emission level may be underestimated.
Besides our work, X-ray luminosities, normalized to unit bolometric luminosity, are available for three of our stars, P 60, P 71 and P 100 (Giampapa, Prosser & Fleming 1998). emission fluxes, derived using the technique of spectral subtraction, are available for seven of them (Martín & Montes 1997). The two chromospheric activity indicators are listed in Table 1. Although the X-ray data are scarce, they do point to a positive correlation with oxygen abundances determined from the triplet lines. The linear correlation coefficient is 0.98 with a statistic significance of 87%. Whereas the emission data show a large scatter without a clear correlation between the oxygen triplet abundances and the emission fluxes (the linear correlation coefficient is 0.34). Among the stars, P 94 has a low oxygen triplet line abundance and a low H emission flux. If we exclude the star with the lowest emission flux (P 107), then the remaining six stars do show a positive correlation with a linear correlation coefficient of 0.78 with a significance of 93%.
In addition to IC 4665, we have also calculated the linear correlation coefficients of oxygen triplet line abundances with different surface activity indicators (H, X-ray, Ca II H+K lines and infrared triplet lines, and the amplitude of modulation in the V-band) for other open clusters. The results are listed in Table. 4. In the table, the last column gives the references for the data used. Values in parentheses are numbers of stars used in the calculations. For Pleiades stars, the oxygen triplet abundances are found to be mildly correlated with the two chromospheric activity indicators, X-ray luminosity and the Ca II infrared triplet (IRT) line strength, but not with H emission. For M 34 stars, the triplet abundances are mildly correlated with the Ca II IRT line strength, but not with H emission. For UMa stars, the oxygen triplet abundances are mildly correlated with the Ca II H+K line strength. For Hyades stars, no correlations are found between oxygen triplet abundances and the X-ray emission or the Ca II H+K line strength. Except for IC 4665 where the oxygen triplet abundances are found to be correlated with the X-ray luminosities in three stars, no obvious correlations are found for other open clusters. The correlations between oxygen abundances in different clusters and different chromospheric activity indicators are thus too ambiguous to draw a firm conclusion. One should remember that in all cases but our work, the stellar spectra and the chromospheric activity indicators were not measured at the same epoch. Therefore, we really do not know the activity levels of the stars at the time the spectra were taken. Simultaneous observations of oxygen triplet lines and chromospheric activity indicators are essential to clarify the situation.
In the previous works, one fact that made the situation further complicated is that both oxygen triplet abundances and chromospheric activity indicators are correlated with . Thus the triplet abundance-activity correlation may be a consequence of the correlations, prohibiting a strong conclusion from being made about a causal relationship between activity indicators and anomalous triplet abundances. However, in our sample of IC 4665, the correlation between oxygen triplet abundance and are not so monotonous (the linear correlation coefficient is 0.53) as there is a large spread around 5400 K. At the same time, the correlation of the abundance and chromospheric activity indicators are much better for stars which show chromospheric activity emissions (the coefficient 0.75). This would be a strong evidence to solve the degeneracy between the triplet abundance/activity correlation and the abundance/ correlation. The results support chromospheric activity as the main reason for the abnormal oxygen triplet abundance observed in young open clusters. Furthermore, theoretical models investigating the possible effects of stellar activities on line formation and element abundance determinations are still needed to totally disentangle the problem.
4.3.2 Stellar spots
Atmospheric perturbations (e.g., stellar spots, flares) have been invoked to explain at least partially the large Li abundance spread in cool members of young open clusters (Barrado y Navascués et al. 2001; Ford et al. 2002; Xiong & Deng 2005). Surface activities such as variations in spot filling factor may affect element abundance determinations in two ways. Firstly, they can cause color anomalies (Stauffer et al. 2003) and thus introduce uncertainties in effective temperature determinations. In SME, effective temperatures are determined directly from the absorption line spectrum, rather than from the stellar energy distribution, i.e. color indices. Thus to the first approximation, color anomalies caused by atmospheric perturbations are irrelevant to our analyses based on the technique of SME. Alternatively, atmospheric perturbations can influence directly the line formation process. Using a simple model consisting of arbitrarily chosen line flux contributions from cool and hot spots, Schuler et al. (2006a) found that stars with spots of different temperatures is capable to reproduce the observed equivalent widths for 3 Hyades stars with different and triplet abundances. However, how such effects can lead to a correlation between oxygen triplet abundances and , as depicted in Fig. 3, is still not clear.
Based on the model of Bouvier et al. (1993), the observed amplitude of modulation in the V-band could be a crude estimation of the area of the spot coverage on the surface. The amplitudes of the V-band variation for 5 of our sample stars given by Allain et al. (1996) are listed in Table 1. The linear correlation coefficient between them and the triplet abundances is 0.46 with a statistic significance of 56%, which leaves the correlation between spots and the triplet abundances still unrecognized. However, we should notice that again the photometric and spectroscopic observations are not carried out at the same time. Simultaneous observations are still needed to draw a clear conclusion.
Various studies have indicate that there are correlations between the activities of different stellar atmosphere layers (e.g. Messina et al. 2003). Therefore even if we obtained the correlation between the oxygen triplet abundances and chromospheric activity levels, we cannot tell if the correlation are due to chromospheric activity or activities of the other layers (such as spots).
4.4 Granulation corrections
Photospheric temperature fluctuation is another controversial factor that may affect spectroscopic abundance determinations. Detailed calculations of granulation abundance corrections have been carried out in recent years. The 3D abundance corrections to be applied to the 1D solutions for individual oxygen lines have been given by several works (e.g., Kiselman & Nordlund 1995; Asplund 2001; Allende Prieto et al. 2001; Asplund & García Pérez 2001; Nissen et al. 2002). Kiselman & Nordlund (1995) report negligible 3D effects for the high-excitation O I triplet lines, which form deep in the photosphere. Similar results are found by Nissen, Primas & Asplund (2001). Nissen et al. (2002) show that 3D correction for the [O I] forbidden line 6300 is negligible in most cases, except in low gravity/metallicity atmospheres where it can increase to about 0.2 dex. Steffen & Holweger (2002) study the problem of LTE line formation in the inhomogeneous solar photosphere based on detailed 2-dimensional radiation hydrodynamics simulations of the convective surface layer of the Sun. By means of a strictly differential 1D/2D comparison of the emergent equivalent widths, they obtain the granulation abundance corrections for individual lines to be applied to the standard abundances determined based on a homogeneous 1D model atmosphere. For the oxygen triplet lines, the correction amounts to about 0.01 dex. By constructing a realistic time-dependent, 3D, hydrodynamic model of the solar atmosphere, Asplund et al. (2004) determine the solar photospheric oxygen abundance from a variety of diagnostic lines, including the [O I] forbidden lines, the O I triplet permitted lines as well as OH vibration-rotation lines and the OH pure rotation lines. In the case of the O I triplet permitted lines, 3D NLTE calculations have been performed, revealing significant departures from the LTE as a result of photon losses in the lines. The NLTE effects due to this process yield corrections that amount to 0.2–0.3 dex. The differences between the 1D and 3D models are however found to be small, less than 0.1 dex. From these detailed calculations, it seems that granulation corrections are probably unlikely to be able to account for the large variations in the oxygen triplet line abundance discuss in the current paper, at least in solar type stars. Calculations of granulation corrections for other types of star have not been reported and are preferred, especially for late type stars.
5 Summary
We have found a dramatic increase in the oxygen triplet abundance upper boundary with decreasing effective temperature in the cool dwarfs of young open cluster IC 4665, similar to what previously observed in Pleiades and M 34 by Schuler et al. (2004), in Hyades by Schuler et al. (2006a) and in UMa by King & Schuler (2005). By contrast, oxygen abundances derived from the [O I] 6300 forbidden line are found to be constant in Pleiades and Hyades. It seems that the [O I] 6300 forbidden line is relatively free from the various processes that may have affected abundances determined from the O I triplet lines and is therefore a better abundance indicator.
At the present moment, the uncertainties in the measured values of [O/H] are too large to place any meaningful planet-formation constraint based on the oxygen abundance of cluster member stars. Under the assumption that oxygen abundance is homogeneous in a given cluster, an assumption that is supported by abundance determinations using the [O I] forbidden line, we have investigated various possible mechanisms that may be responsible for the observed trend and scatter of oxygen triplet line abundances. Although the O I triplet lines are sensitive to stellar parameters, we show that the possible uncertainties in our parameter determinations are unlikely to be sufficient to explain the more than 1 dex variations in oxygen triplet line abundances. The possible effects of canonical NLTE as the dominant cause of the problem is ruled out as they predict a trend of oxygen abundance as varies that is exactly opposite to what observed. Available calculations of granulation corrections show that the effects are generally small, at least for solar type stars, and therefore may contribute little to the observed spreads of oxygen triplet line abundances. The variation of oxygen triplet abundances as a function of effective temperatures are found to be larger in younger open clusters and smaller in older clusters. Age-related effects stellar surface activities are then suggested to blame for the large spreads of oxygen triplet abundances. This assumption are supported by the correlation analysis between the triplet abundance and the simultaneous observation of H and Ca II IRT emissions which, are indicators of stellar chromospheric activity levels. The lack of a monotonous correlation between and the triplet abundance implies that the the triplet abundance/activity correlation is not a consequence of the abundance/ correlations. We could not exclude the possibility that stellar spots play a role in the abnormal behavior of the detected oxygen triplet abundances.
References
- (1) Affer, L., Micela, G., Morel, T., Sanz-Forcada, J. & Favata, F. 2005, A&A, 433, 647
- (2) Allain, S., Bouvier, J., Prosser, C., Marschall, L. A., & Laaksonen, B. D. 1996, A&A, 305, 498
- (3) Allende Prieto, C., Lambert, D. L., & Asplund, M. 2001, ApJ, 556, L63
- (4) Asplund, M. 2001, NewA Rev., 45, 565
- (5) Asplund, M., & García Pérez, A. E. 2001, A&A, 372, 601
- (6) Asplund, M., Grevesse, N., Sauval, A. J., Allende Prieto, C., & Kiselman, D. 2004, A&A, 417, 751
- (7) Balachandran, S. C., & Carney, B. W. 1996, AJ, 111, 946
- (8) Barrado y Navascués, D., García López, R. J., Severino, G., & Gomez, M. T. 2001, A&A, 371, 652
- (9) Bouvier, J., Cabrit, S., Fernandez, M., Martin, E. L., & Matthews, J. M. 1993, A&A, 272, 167
- (10) Carretta, E., Gratton, R. G., & Sneden, C. 2000, A&A, 356, 238
- (11) Cavallo, R. M., Pilachowski, C. A., & Rebolo, R. 1997, PASP, 109, 226
- (12) Ciesla, F. J. & Cuzzi, J. N. 2006, Icarus, 181, 178
- (13) Ford, A., Jeffries, R. D., & Smalley, B. 2002, A&A, 391, 253
- (14) Giampapa, M. S., Prosser, C. F., & Fleming, T. A. 1998, ApJ, 501, 624
- (15) Gratton, R. G., Carretta, E., Eriksson, K., & Gustafsson, B. 1999, A&A, 350, 955
- (16) Gray, D. F., 1992, The observation and analysis of stellar photospheres, P. 356, equation (16.2)
- (17) Grevesse, N., Noels, A., & Sauval, A. J. 1996, Standard Abundances, in Cosmic Abundances, eds S. S. Holt and G. Sonneborn, ASP Conference Series 99, 117-126
- (18) Ida, S. & Lin, D. N. C. 2004, ApJ, 604, 388
- (19) Israelian, G., García López, R. J., & Rebolo, R. 1998, ApJ, 507, 805
- (20) Johansson, S., Litzén, U., Lundberg, H., & Zhang, Z. 2003, ApJ, 584, L107
- (21) Kharchenko, N. V., Piskunov, A. E., Rser, S., Schilbach, E., Scholz, R.-D., 2005, A&A, 438, 1163
- (22) King, J. R. 1993, AJ, 106, 1206
- (23) King, J. R. & Boesgaard, A. M. 1995, AJ, 109, 383
- (24) King, J. R. & Schuler, S. C. 2005, PASP, 117, 911
- (25) Kiselman, D. 1991, A&A, 245, L9
- (26) Kiselman, D. 1993, A&A, 275, 269
- (27) Kiselman, D., & Nordlund, Å. 1995, A&A, 302, 578
- (28) Kupka, F., Piskunov, N. E., Ryabchikova, T. A., Stempels, H. C., & Weiss, W. W. 1999, A&AS, 138, 119 (VALD-2)
- (29) Kurucz, R. L., Furenlid, I., Brault, J., & Testerman, L. 1984, National Solar Observatory Atlas No. 1: Solar Flux Atlas from 296 to 1300 nm (Sunspot: Natl. Solar Obs.)
- (30) Kurucz R., 1993, Atlas Stellar Atmosphere Program and 2 km/s Grid CDROM vol 13, Smithsonian Astrophysical Observatory, Cambridge
- (31) Lambert, D. L. 1978, MNRAS, 182, 249
- (32) Martín, E. L., & Montes, D. 1997, A&A, 318, 805
- (33) Mermilliod, J. C. 1981, A&AS, 44, 467
- (34) Messina, S., Rodon, M. & Guinan, E. F. 2001, A&A, 366, 215
- (35) Messina, S., Pizzolato, N., Guinan, E. F., & Rodon, M. 2003, A&A, 410, 671
- (36) Mishenina, T. V., Korotin, S. A., Klochkova, V. G., & Panchuk, V. E. 2000, A&A, 353, 978
- (37) Montes, D. & Martín, E. L. 1998, A&AS, 128, 485
- (38) Moore, E., Minnaert, M. G. J., Houtgast, J. 1966, The Solar Spectrum 2935 Å to 8770 Å, National Bureau of Standards Monograph 61
- (39) Morel, T., & Micela, G. 2004, A&A, 423, 677
- (40) Nissen, P. E., Primas, F., & Asplund, M. 2001, NewA Rev., 45, 545
- (41) Nissen, P. E., Primas, F., Asplund, M., & Lambert, D. L. 2002, A&A, 390, 235
- (42) Norris, J. E., Ryan, S. G., & Beers, T. C. 2001, ApJ, 561, 1034
- (43) Paulson, D. B., Saar, S. H., Cochran, W. D. & Hatzes, A. P. 2002, AJ, 124, 572
- (44) Paulson, D. B., Sneden, C., & Cochran, W. D. 2003, AJ, 125, 318
- (45) Piskunov, N. E., Kupka, F., Ryabchikova, T. A., Weiss, W. W., & Jeffery, C. S. 1995, A&AS, 112, 525 (VALD-1)
- (46) Prosser, C. F. 1993, AJ, 105, 1441
- (47) Ryabchikova T. A. Piskunov N. E., Stempels H. C., Kupka F., & Weiss W. W. 1999, Physica Scripta T83, 162-173 (VALD-2)
- (48) Schuler, S. C., King, J. R., Fischer, D. A., Soderblom, D. R., & Jones, B. F. 2003, AJ, 125, 2085
- (49) Schuler, S. C., King, J. R., Hobbs, L.M., & Pinsonneault, M. H. 2004, ApJ, 602, L117
- (50) Schuler, S. C., King, J. R., Terndrup, D. M., et al. 2006a, ApJ, 636, 432
- (51) Schuler, S. C., Hatzes, A. P., King, J. R., et al. 2006b, AJ, 131, 1057
- (52) Shen Z.-X., Jones, B. F., Lin, D. N. C., Liu, X.-W., Li, S.-L. 2005, ApJ, 635, 608 (Paper I)
- (53) Soderblom, D. R., Stauffer, J. R., Hudon, J. D., & Jones, B. F. 1993, ApJS, 85, 315
- (54) Soderblom, D. R., Jones, B. F. & Fischer, D. 2001, ApJ, 563, 334
- (55) Stauffer, J. R., Jones, B. F., Backman, D., Hartmann, L. W., Barrado y Navascués, D., Pinsonneault, M. H., Terndrup, D. M., & Muench, A. A. 2003, AJ, 126, 833
- (56) Steffen, M., & Holweger, H. 2002, A&A, 387,258
- (57) Takeda, Y. 1995, PASJ, 47, 463
- (58) Takeda, Y. 2003, A&A, 402, 343
- (59) Tomkin, J., Lemke, M., Lambert, D. L., & Sneden, C. 1992, AJ, 104, 1568
- (60) Valenti, J. A., & Piskunov, N. 1996, A&AS, 118, 595
- (61) Valenti, J. A., & Fischer, D. A. 2005, ApJS, 159, 141
- (62) Vogt, S. S. 1992, in ESO Workshop on High Resolution Spectroscopy with the VLT, ed. M. H. Ulrich (Garching: ESO), P. 223
- (63) Wilden, B. S., Jones, B. F., Lin, D. N. C., & Soderblom, D. R. 2002, AJ, 124, 2799
- (64) Xiong, D.-R., & Deng, L. 2005, ApJ, 622, 620
| Star | (SME) | log | A(V)c | [O/H]SME | ErrorSME | [O/H]EW | |||
|---|---|---|---|---|---|---|---|---|---|
| (K) | (cm s-2) | (km s-1) | ()b | (mag) | |||||
| P 19 | 6370 | 4.44 | 0.26 | * | * | 0.26 | 0.10 | 0.31 | |
| P 147 | 6189 | 4.49 | 1.02 | * | * | 0.08 | * | 0.00 | |
| P 39 | 5867 | 4.50 | 1.25 | * | * | 0.04 | 0.03 | * | 0.09 |
| P 107 | 5626 | 4.56 | 0.68 | 5.5 | * | 0.51 | * | 0.45 | |
| P 150 | 5535 | 4.57 | 1.62 | 6.6 | * | 0.06 | 0.35 | * | 0.15 |
| P 151 | 5494 | 4.58 | 1.46 | * | * | 0.17 | 0.24 | 0.07 | |
| P 60 | 5483 | 4.58 | 1.27 | * | 3.44 | 0.11 | * | 0.01 | |
| P 75 | 5347 | 4.47 | 1.60 | 6.5 | * | 0.05 | 0.46 | * | 0.19 |
| P 165 | 5292 | 4.59 | 1.56 | 6.6 | * | 0.23 | * | 0.19 | |
| P 267 | 5286 | 4.65 | 0.43 | * | * | 0.03 | * | 0.24 | |
| P 64 | 5267 | 4.62 | 0.95 | * | * | 0.15 | * | 0.03 | |
| P 71 | 5251 | 4.60 | 1.55 | 6.5 | 3.11 | 0.04 | 0.64 | 0.26 | 0.33 |
| P 199 | 5168 | 4.64 | 0.57 | * | * | 0.22 | * | —d | |
| P 94 | 5168 | 4.64 | 0.87 | 6.0 | * | 0.20 | * | 0.33 | |
| P 100 | 4913 | 4.65 | 1.46 | 6.7 | 3.00 | 0.10 | 1.00 | * | 0.60 |
-
a From Martín & Montes (1997); in units of erg cm-2 s-1 Å-1.
-
b From Giampapa, Prosser & Fleming (1998);
-
c From Allain et al. (1996)
-
d Very low S/N ( 30). No reliable EW measurements could be given for the shallow oxygen triplet lines.
| Star | (K) | [O/H]SME | ErrorSME | [O/H]EW | ErrorEW |
|---|---|---|---|---|---|
| H II 250 | 5731 | 0.02 | 0.08 | 0.03 | 0.14 |
| H II 129 | 5369 | 0.05 | 0.07 | 0.02 | 0.14 |
| H II 2462 | 5256 | 0.10 | 0.11 | 0.14 | 0.17 |
| H II 522 | 4966 | 0.14 | 0.11 | 0.17 | 0.18 |
| H II 1039 | 4908 | 0.14 | 0.09 | 0.07 | 0.14 |
| H II 1298 | 4854 | 0.05 | 0.09 | 0.03 | 0.15 |
| Star | R(H) | R(8498) | R(8662) | Err(H) | Err(8498) | Err(8662) | Err(O) |
|---|---|---|---|---|---|---|---|
| P19 | 0.210 | 0.318 | 0.225 | 0.062 | 0.054 | 0.048 | 0.098 |
| P147 | 0.000 | 0.038 | 0.063 | 0.061 | 0.048 | 0.045 | 0.123 |
| P39 | 0.274 | 0.350 | 0.303 | 0.045 | 0.040 | 0.039 | 0.168 |
| P107 | 0.189 | 0.247 | 0.288 | 0.052 | 0.052 | 0.047 | 0.201 |
| P150 | 0.676 | 0.659 | 0.531 | 0.058 | 0.053 | 0.058 | 0.214 |
| P151 | 0.341 | 0.535 | 0.482 | 0.062 | 0.056 | 0.051 | 0.219 |
| P60 | 0.417 | 0.498 | 0.486 | 0.094 | 0.082 | 0.076 | 0.221 |
| P75 | 0.601 | 0.647 | 0.610 | 0.104 | 0.092 | 0.092 | 0.240 |
| P165 | 0.851 | 0.637 | 0.511 | 0.090 | 0.079 | 0.090 | 0.247 |
| P267 | 0.016 | 0.103 | 0.130 | 0.118 | 0.108 | 0.108 | 0.248 |
| P64 | 0.086 | 0.173 | 0.132 | 0.097 | 0.076 | 0.084 | 0.251 |
| P71 | 0.731 | 0.666 | 0.613 | 0.160 | 0.143 | 0.127 | 0.253 |
| P199 | 0.071 | 0.109 | 0.134 | 0.132 | 0.149 | 0.128 | 0.264 |
| P94 | 0.204 | 0.377 | 0.275 | 0.090 | 0.067 | 0.070 | 0.264 |
| P100 | 1.186 | 0.951 | 0.733 | 0.173 | 0.127 | 0.132 | 0.300 |
| Cluster | H | X-ray | Ca II H+K | Ca II IRT | A(V) | Refa |
|---|---|---|---|---|---|---|
| IC 4665 | 0.34 (7)b | 0.98 (3) | * | * | 0.46 (5) | 1, 2, 11 |
| 0.69 (15) | 0.55/0.57c(15) | * | 3 | |||
| Pleiades | 0.04 (15) | 0.72 (11) | * | 0.64 (15) | * | 4, 5, 6 |
| M 34 | 0.15 (8) | * | * | 0.71 (7) | * | 4, 7 |
| UMa | * | * | 0.77 (6) | * | * | 8 |
| Hyades | * | 0.16 (28) | 0.21 (40) | * | * | 6, 9, 10 |
-
a (1) Martín & Montes (1997); (2) Giampapa, Prosser & Fleming (1998); (3) This work; (4) Schuler et al. (2004); (5) Soderblom et al. (1993); (6) Morel & Micela (2004); (7) Soderblom et al. (2001); (8) King & Schuler (2005), and references therein; (9) Schuler et al. (2006a); (10) Paulson et al. (2002); (11) Allain et al. (1996)
-
b Values in parentheses are numbers of stars analyzed.
-
c For 8498 and 8662 respectively.