Infrared Extinction Toward Nearby Star-Forming Regions
Abstract
We present an independent estimate of the interstellar extinction law for the Spitzer IRAC bands as well as a first attempt at extending the law to the 24µm MIPS band. The source data for these measurements are observations of five nearby star-forming regions: the Orion A cloud, NGC 2068/71, NGC 2024/23, Serpens and Ophiuchus. Color excess ratios were measured for stars without infrared excess dust emission from circumstellar disks/envelopes. For four of these five regions, the extinction laws are similar at all wavelengths and differ systematically from a previous determination of the extinction law, which was dominated by the diffuse ISM, derived for the IRAC bands. This difference could be due to the difference in the dust properties of the dense molecular clouds observed here and those of the diffuse ISM. The extinction law at longer wavelengths toward the Ophiuchus region lies between that to the other four regions studied here and that for the ISM. In addition, we extended our extinction law determination to for Serpens and NGC using Spitzer MIPS data. We compare these results against several ISO extinction law determinations, although in each case there are assumptions which make absolute comparison uncertain. However, our work confirms a relatively flatter extinction curve from 4 - 8m than the previously assumed standard, as noted by all of these recent studies. The extinction law at is consistent with previous measurements and models, although there are relatively large uncertainties.
1 Introduction
With the launch of the Spitzer Space Telescope, identification of embedded young stellar objects (YSOs) from their infrared excess emission at mid-infrared wavelengths ( using IRAC, the Infrared Array Camera, and at 24m, using MIPS, the Multiband Imaging Photometer) has been facilitated by Spitzer’s unprecedented sensitivity. These wavelengths are sensitive to the emission from disk and envelope material surrounding YSOs, making it easier to differentiate young stellar objects from foreground or background stars where the emission is primarily photospheric. Allen et al. (2004) and Megeath et al. (2004) develop a classification scheme to differentiate young stellar objects based on their IRAC colors, and Muzerolle et al. (2004) present a scheme utilizing 24m data in combination with IRAC data. Gutermuth (2005) has recently presented a robust classification scheme for YSOs which utilizes de-reddened mid-IR fluxes of the cluster members in combination with ground-based photometry. These classification schemes are briefly compared in the recent review article by Allen et al. (2007a). Lada et al. (2006) also employ de-reddened IRAC observations to identify YSOs in IC348, using an alternate classification scheme. Since these schemes involve de-reddening, it is critical to provide an accurate extinction law at IRAC and MIPS wavelengths that is appropriate for young clusters embedded in nascent molecular cloud material.
Examining the extinction to background stars beyond these embedded young clusters probes the column density of dust in the molecular cloud. The availability of 2MASS has allowed for construction of large scale extincton maps in the near-infrared which trace a substantial range in column densities (Lada et al., 2007; Lombardi et al., 2006). With an appropriate extinction law, this technique could be extended to longer wavelengths where the extinction is lower and higher column densities can be probed.
Throughout much of the IRAC range of interest (0.7 - 5m), Draine (1989) fit data existing at that time to a power-law , with = 1.75, and extrapolated the power law to meet the beginning of a silicate contribution at 7 m in his Fig. 1; other early papers have found ranging from 1.61 (Rieke & Lebofsky, 1985) to 1.80 (Martin & Whittet, 1990; Whittet et al., 1993). Dust models (Weingartner & Draine, 2001) employing size distributions of various grain components with known optical properties have been constructed to match observed extinction laws. Measurements of the extinction law from to have been reported by many investigators using a variety of techniques (from both ground-based and space observations) along a number of lines of sight, and these were thought to be “universal”, i.e. generally in agreement with each other (Draine, 1989; Cardelli et al., 1989), although recently some authors have questioned this universality (Gomez & Kenyon, 2001; Racca et al., 2002). Longward of the extinction is less certain (see the range in above), and the most robust estimates are generally obtained with instruments on spaceborne telescopes. Pre- studies have relied primarily on measurements of hydrogen recombination or hydrogen rotational and ro-vibrational lines (Lutz et al., 1996; Lutz, 1999; Rosenthal, Bertoldi & Drapatz, 2000; Bertoldi et al., 1999) to estimate the extinction law for . For example, Lutz (1999) used hydrogen recombination line emission toward the galactic center to probe the extinction from and found that the extinction law / is flatter from than the power laws noted above, and approximately smaller than the value of the standard curve at 7m. Lutz (1999) notes that the lack of a deep minimum near 7m is in conflict with predictions assuming the standard mixture of silicate and graphite grains (Draine, 1989). Bertoldi et al. (1999) and Rosenthal, Bertoldi & Drapatz (2000) observed rotational and ro-vibrational lines toward OMC-1 and assumed a power law ( extending from 2.4 to ), and fit two silicate features to the extinction law beyond . The latter authors also determined extinctions from hydrogen recombination lines, and obtained smaller values of the relative extinction by this method than with lines. In that case / was also relatively flatter from 3m - 7m, and from 1.5 - 2 times smaller than the comparison curve (in this case the IR extinction law from Cohen (1993) with modifications to the 10m silicate feature strength: the Cohen law is very similar otherwise to the one adopted by Draine (1989)). A study using ISOGAL, DENIS and 2MASS data of intermediate AGB and RGB stars in the inner galactic plane by Jiang et al. (2006) determined values for / and that are more comparable to those of Lutz (1999) than to earlier ‘standard’ interstellar extinction curves in the solar neighborhood (Draine, 1989).
Using observations of stars they identified as reddened clump giant stars in the galactic plane obtained as part of the Spitzer GLIMPSE survey, Indebetouw et al. (2005) directly measured the extinction law for the Spitzer IRAC bands at 3.6, 4.5, 5.8, and 8.0m. They observed the massive star-forming region RCW 49 at a distance exceeding 2 kpc, as well as two off-field regions very close to the galactic plane, and supplemented the Spitzer data with 2MASS observations of the same fields. For the off-field regions, their method determines the diffuse interstellar medium extinction, assuming that the red clump giants are uniformly distributed along the line of sight. Reddened red clump giant stars were selected from their position in the vs. color-magnitude diagram, and a reddening band was identified which was then used to determine assuming a narrow distribution of intrinsic colors and luminosities of the clump giants. was then determined from vs. color-color diagrams for these objects. The extinction curve for all three of these regions was nearly identical and also appeared to have a shallower slope for than the standard law. R. Indebetouw kindly provided the data for these three regions so that we could process them using the same methods that we used to process our data, hence making possible a direct comparison of the extinction laws toward the young clusters studied here, and that along the lines-of-sight probed by Indebetouw et al. (2005).
Here we determine the extinction law from toward five young, nearby ( 1 kpc) cluster regions, including the Orion A cloud, NGC 2068/71, NGC 2024/23, Ophiuchus and Serpens. We further determine the extinction at for two of the regions, NGC 2068/71 and Serpens. In all cases we measure extinctions in relatively broad wavebands as determined by fixed, cold filters. By examining those stars without disk/envelope infrared excess emission in the cloud direction, we evaluate the selective extinction at mid-infrared wavelengths: the extinction derives primarily from their host molecular clouds, although extinction from the diffuse interstellar medium is also a factor. We compare our determination against prior determinations in the literature including the “standard extinction law” such as that compiled by Draine (1989). It is important when comparing these determinations to keep in mind that spectroscopic measurements may differ from our broad-band measurements at these wavelengths.
Our separate extinction law study at the wavelengths of the IRAC bands is motivated by a discrepancy between slopes of the bands of reddened sources in the vs. color-color diagrams for our clusters, and slopes found using the GLIMPSE data. Reddened non-excess sources form a band on the vs. color-color diagrams extending from the intrinsic colors of the stars parallel to the reddening vector whose slope is the color-excess ratio . These color excess ratios, derived in Section 2 and given in Table 2 for our data, and for the GLIMPSE data provided by Indebetouw, illustrate at a glance the discrepancy between selective extinction slopes toward our sources and theirs. Huard et al. (2007) also found a slope discrepancy between the selective extinction law toward isolated dense molecular cores observed in the Spitzer Cores to Disks (c2d) Legacy program (Evans et al., 2003), and toward those regions examined by Indebetouw et al. (2005).
For these young clusters, and for the regions examined by Indebetouw et al. (2005), we utilize in our analysis those stars without a mid-infrared excess in the IRAC color-color diagrams (Allen et al., 2004), namely class III cluster objects, and field stars. Background dwarfs and red giants, including the red clump giants, are the primary probes of the extinction that originate in the clusters’ nascent molecular clouds. Using complementary 2MASS ground-based and data as well as data on these objects, we measure the color excess ratios from vs. color-color diagrams, and from these ultimately derive for an assumed value of . The same method allows extension to 24m for the Serpens and NGC clusters, although these results are more uncertain because of the comparative paucity of detected sources.
In Section 2 the observations and data reduction will be discussed, and Section 3 will describe source selection and the derivation of the reddening law from these data. Section 4 will report the results and discuss the differences between the extinction law derived here for our data and for the data used in the study by Indebetouw et al. (2005), as well as the extinction law derived using different methods and extinction probes by Indebetouw et al. (2005), with further reference to other determinations (Lutz, 1999; Jiang et al., 2006; Rosenthal, Bertoldi & Drapatz, 2000; Huard et al., 2007). We have not determined the total to selective extinction in this study, so shall concentrate on relative extinctions, assuming a value for in order to make comparisons with other work. Because a non-universal extinction law may lead to variations in this assumed value, we consider how this assumption affects our results.
2 Observations and Analysis
Observations of several young star-forming clusters were obtained with the IRAC camera (Fazio et al., 2004) aboard Spitzer as part of several surveys concentrating on star-formation within kpc of the Sun, including the “Young Cluster Survey” (PID 6), the “Orion Survey” (PID 43) from G. Fazio’s guaranteed observation time, as well as the “Cores to Disks Legacy Program” (PID 174 and 177). The IRAC camera takes simultaneous images in four channels whose isophotal wavelengths are , , and respectively (Fazio et al., 2004). Some of the regions observed cover several square degrees so that multiple AORs with the IRAC camera were required. NGC and NGC were imaged as part of the same region, while NGC and NGC were also observed together. Observations of the Orion A cloud included coverage of OMC 2/3, ONC and L1641. High dynamic range mode (Fazio et al., 2004) was used, resulting in a frame with a second exposure time and a frame with a second exposure time at each position. The maps for each of NGC 2024/23, NGC 2068/71 and Orion A were repeated twice. The maps of Serpens and Ophiuchus were repeated four times, with small offsets. The additional dithers provide both additional sensitivity to faint sources and greater ability to remove cosmic rays from the final mosaics. We have not corrected for the position dependent gain variation for point sources111See http://ssc.spitzer.caltech.edu/irac/locationcolor/, which would result in an additional 5% uncertainty.
For the Orion fields individual frames were mosaiced using a custom IDL program and from these mosaics, source selection and point source photometry were completed using Gutermuth’s PhotVis v (Gutermuth et al., 2004). The photometry used an aperture of and a sky annulus with inner and outer radii of and . Details on the data reduction and source selection in Serpens and Ophiuchus are described in Winston et al. (2007) and Allen et al. (2007b). Reach et al. (2005) discusses the calibration of the IRAC instrument. The calibration of the Spitzer telescope was refined during the course of this work, and the resulting zero points are listed in Table 1. However, changes in the zero point do not change the results in this paper and are taken into account in our fitting technique. From the 2MASS point source database we obtained corresponding and band magnitudes for each star. For the NGC , NGC and Serpens regions, we required magnitude uncertainty in all seven bands for sources used to calculate the extinction law. For the Orion A cloud and Ophiuchus a detection in J band was not required, thereby increasing the number of highly reddened sources and providing a better determination of the extinction law. For the remaining 6 bands, a magnitude uncertainty of was imposed. If we do not require a J band detection for NGC , NGC or Serpens, our derived values for the slope of the extinction vector are within of the values derived with the seven-band data.
Requiring sources to have this magnitude uncertainty reduced the spread of the sources on each color-color diagram, and minimized the uncertainty in the fit (see Section 3). Those sources for which only upper limits to 2MASS magnitudes were available were not included in our analysis. Most of the sources had much smaller magnitude uncertainties. The median magnitude uncertainties for NGC 2024/23 sources are for , and channels 1 through 4 of IRAC respectively. Similar median magnitude uncertainties were obtained for the other regions studied here. Loosening the requirement on the maximum uncertainty will include more sources with lower fluxes. It is possible that these sources have higher extinction and could provide a more accurate measure of the reddening law. However, increasing the uncertainty limit leads to the inclusion of more outliers that skew the slope and are difficult to remove with a simple color cut. A small number of fits did not have any outliers and for these fits including the sources with higher uncertainty does not change our results by more than the measured uncertainty in the color excess ratios.
MIPS 24 m images were available for several of the regions studied. Not all regions were suitable - there were insufficient non-excess sources in some regions to reliably derive an extinction law. We report on NGC 2068/71 and Serpens observations with the Multiband Imaging Photometer for Spitzer (MIPS, Rieke et al., 2004). We summarize the MIPS observations, with more detailed descriptions of the data reduction and photometric measurements for Serpens and NGC 2068/71 in Winston et al. (2007) and Muzerolle et al. (2007) respectively. The measurements were obtained in scan mode with half-array cross-section offsets. All three MIPS bands are observed simultaneously in this mode; the total effective exposure time per point is about 80 seconds at 24 microns. Photometry was determined using a PSF fitting program in IDL.
3 Background Source Selection and Determination of Extinction Law
Background dwarfs and giants (including red clump giants and RGB stars) as well as embedded pre-main sequence stars can be used to measure the extinction due to the molecular cloud dust associated with the star-forming region as well as diffuse line-of-sight extinction. As mentioned above, the sources used to measure the extinction were chosen from those without infrared excesses from disk or envelope emission in the vs. color-color diagram toward each cluster region. Eliminating infrared excess sources from consideration removes any ambiguities between stars with red colors caused by extinction vs. stars with circumstellar dust or envelope emission, including both pre-main sequence stars and AGB stars. A non-excess source was defined as having colors and . This region of consideration was chosen so that it did not overlap with the expected position of pre-main sequence stars with disks according to Allen et al. (2004) and included the expected spread in colors due to interstellar dust reddening, which is larger at the shorter wavelengths. This definition of non-excess sources is consistent with the theoretical models of Whitney et al. (2003), and the observations of Megeath et al. (2004) and Gutermuth et al. (2004). An upper limit on the color is used to eliminate unresolved outflow sources misidentified as stars. Outflows have emission features in the 4.5 m band, leading to colors which could be confused with those from reddened non-excess stars.
We extend our selection criteria to attempt to further remove foreground stars, and stars whose colors place them outside the reddening band. We remove foreground giants by excluding any star brighter than a K2III giant with (López-Corredoira et al., 2002) at the distance of each cluster. We also exclude stars with , which are mostly foreground dwarfs (see discussion below). Stars with do not fit into the reddening band and are removed as well as stars that appear to have an excess in the vs diagram (e.g. for Serpens). We have not attempted to use only clump red giants, as was done by Indebetouw et al. (2005), because of the difficulty in distinguishing these stars from highly reddened dwarfs and pre-main sequence stars without disks. Our reddest stars will be dominated by red giants and embedded pre-main sequence stars because of the large intrinsic luminosity needed to detect these stars at such high extinction although at lower extinction we may have a mix of reddened dwarfs as well as giants and pre-main sequence stars. For Orion A, a number of galaxies contaminated the field and their removal from consideration is discussed in section 3.1.
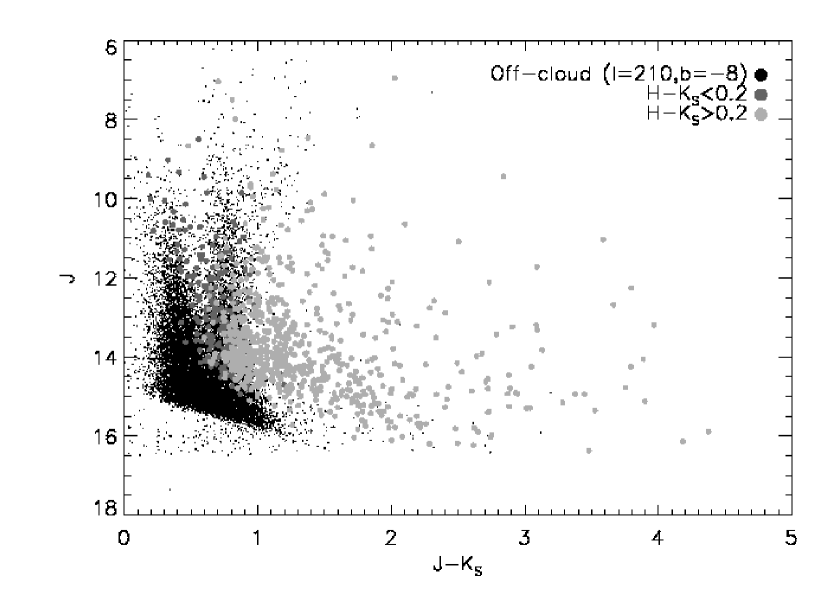
López-Corredoira et al. (2002) point out that stars lying to bluer colors than the red clump giant distribution in a or vs. color-magnitude diagram for a given line of sight are primarily dwarfs, while stars lying to redder colors are predominantly M giants and AGB stars. The red clump giant distribution is almost vertical around a median = 0.75 0.2 for off-cloud lines of sight at galactic latitudes with absolute value 6o. For fields probing greater extinction from either molecular clouds or along lines of sight closer to the galactic plane, the red clump giant distribution shifts to redder , fainter magnitudes and the distribution is broader. All of our clusters have galactic latitudes exceeding 6o, with the exception of Serpens, at =5.4o. To illustrate the above points for one of our clusters, we show a vs. diagram for NGC 2068/71 (a region of high extinction) as well as an off-cloud region overplotted (Fig. 1). The off-cloud field is centered at l=210o, b=-8o, a region that was chosen because it did not show any significant CO emission indicative of a dense molecular cloud (Wilson et al., 2005). In that diagram, the sources coincident with the cluster utilized in measuring the color-excess ratios are plotted with blue symbols, and red symbols illustrate cluster sources rejected by the cutoff. Off-cluster sources are plotted with black symbols. In the black double-peaked distribution, dwarfs at various distances along the line of sight occupy the bluer peak, and the red clump sources the redder, with median color = 0.75, as noted above. The effect of the molecular cloud’s reddening can be seen by noting that most red clump extinction probes to NGC 2068/71 form a clump centered at =1.05 at =14.5. The off-cloud giants have nearly constant color, indicating little extinction from the diffuse ISM. For this reason we expect the contribution of the diffuse ISM to our measured extinction law for the Orion fields to be small, although this may not be equally valid for Serpens and Ophiuchus. Many sources redder than the red clump giants are sampled, and in particular, for the cluster region (red and blue points) in Figure 1 there is no distinct red clump giant locus. In the cluster region, the highly variable extinction makes it impossible to isolate red clump giants, reddened dwarfs and embedded pre-main sequence stars. We are likely dominated by red clump giants, and perhaps pre-main sequence stars, in the densest parts of the cluster, because they are bright enough to be observed at large reddening. However, we do not attempt to use only red clump giants.
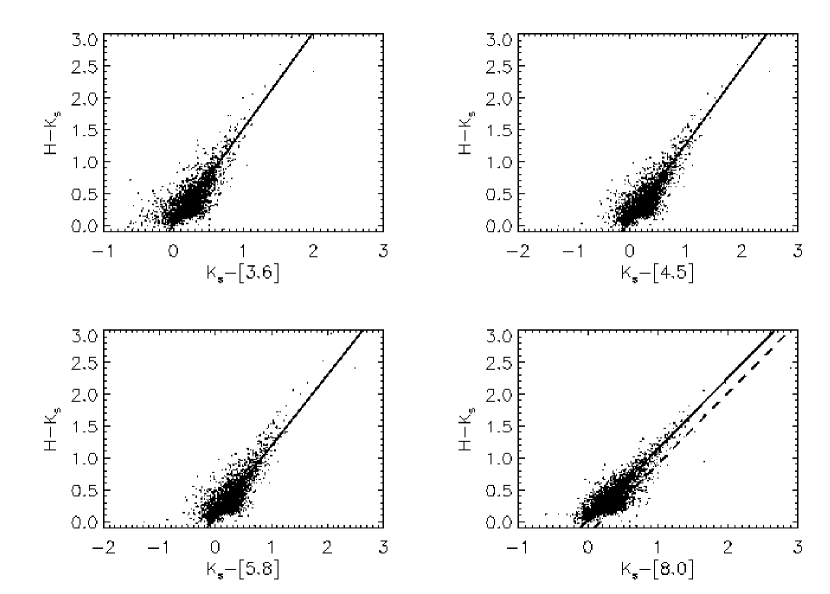
We now move to discussion of reddening law determination. A straight line was fit to background sources in the ‘reddening’ band on an vs. color-color diagram. After all of the restrictions described above were imposed, there were 415, 670, 1830 and 1225 background sources for NGC , NGC , Orion A and Serpens respectively. Ophiuchus had 120 background sources and the implications of this small sample size are discussed further in section 4. The slope of the line fit to the ‘reddening’ band gives the color-excess ratio which is then used to determine the relative extinction law , where we assume = (the value derived by Indebetouw et al. (2005)). The effect of a different choice of is discussed in section 4.1.3.
The line fit to the reddening band data in each of the vs. color-color diagrams minimized the chi-squared, weighted by the uncertainty in each color.
| (1) |
where and are the y-intercept and slope, respectively, of the best fit line and and are the uncertainties in the x and y-values respectively. The algorithm amoeba in IDL was used to minimize the chi-squared. Determining the best fit-line to the reddening band data using equation 1 not only accounts for the magnitude uncertainties, but also provides a method for estimating the uncertainty in the slope, which leads directly to , the quantity of interest.
Press et al. (1992) presented a detailed analysis of the adopted fitting technique as well as the characterization of its uncertainty, which we summarize here for the convenience of the reader. At the best-fit points the is a minimum, but if the values of and are perturbed away from the best-fit values increases. A constant value of gives a confidence region within parameter space, which depending on the size of , could enclose a , , etc. confidence interval. The uncertainty in and is then the projection of this confidence region onto the and axis. Finding where has a specific value is determined analytically with a Taylor expansion when is linear in , but must be determined numerically here because is non-linear in . This determination is performed by varying , minimizing at each step, until equals the desired value. There are two values of , one greater and one less than the best-fit value, for which equals the desired value. The distances of these two new values of from the best fit slope are combined to determine the uncertainty in the slope.
For the majority of our analysis was chosen to be 1, which corresponds to a confidence level (Press et al., 1992). Increasing the confidence level to requires , which results in an increased uncertainty in the slope. Both a and confidence interval were determined and are included in Table 2. The uncertainties are times bigger for the larger confidence interval than for the smaller confidence interval, but lead to at the most a uncertainty in the fit.
The process that was used to derive the extinction law for the IRAC bands can be applied to the channel of MIPS. There were only sufficient numbers of non-excess sources with corresponding detections in 2MASS, IRAC and MIPS in the Serpens and NGC 2068/71 regions. The non-excess sources were defined as having , and , with the last color cut used to remove sources that had an excess only at 24µm. For both NGC and Serpens fewer than 50 sources were used for the final fit, making sure to exclude outliers and sources with , so we are working with quite small numbers of sources. For this reason, we view these results with extreme caution.
3.1 Orion A
While the process for deriving the extinction law from Serpens, Ophiuchus, NGC 2068/71 and NGC 2024/23 data was straightforward, the number and variety of sources toward Orion A required more careful attention. The Orion A cloud covers square degrees, a much larger area than the other four regions observed, increasing the number of sources used when determining the reddening law but also increasing the number of outliers. These outliers are most obvious on the vs. color-color diagram on which there is a ‘branch’ with which could skew the fit.
This ‘branch’ is not as dominant in any of the other vs. color-color-diagrams and has nearly constant color as well as . The objects in this branch are too blue in color to be infrared excess sources but they are too red in color to be main-sequence stars, red giants, or Class III sources. The most likely explanation is that these sources are galaxies. Their blue colors in the near infrared likely derive from main-sequence stars dominating the light at short wavelengths. Polycyclic Aromatic Hydrocarbon (PAH) emission from the dust within the galaxies is the likely cause of the red color, since strong PAH feature emission falls within the band of IRAC. Interpreting these sources as galaxies is consistent with their fairly uniform spread in position throughout the Orion A cloud. They are also not present in the areas with the highest concentration of young stellar objects because these areas have a large density of nebulosity which decreases the sensitivity for detection of background objects, and a high column density of dust obscuring faint background sources. It is also possible that foreground sources contaminated by extended PAH emission are contaminants: however, this does not explain the lack of outliers in the regions of largest PAH emission near the young stars. Regardless of the physical nature of these outliers, we remove them from our fitting procedure. A first attempt at removing these outliers was performed by changing the selection criteria for non-excess sources. This did not effectively remove the outliers without also removing a signifcant number of sources in the reddening band which are needed to accurately measure the extinction law. Removing these outliers, without removing a substantial number of sources in the reddening band, was completed by first fitting a line in the vs. color-color diagram to all of the non-excess sources, including the outliers, and then using the slope of this fit to define a boundary line (), below which were assumed outliers and above which were the sources used for a more accurate measure of the extinction. The y-intercept of this line was chosen so that a majority of the outliers was removed without removing a significant portion of the reddening band. The initial fit in the vs. color-color diagram had a slope of and the final fit had a slope of with decreasing from for the initial fit to for the final fit. While this is a small correction, the final fit is a more accurate measurement of the extinction law at .
4 Results
4.1 The Extinction Law from 3-8m
4.1.1 IRAC-Derived Color Excess Ratios
The slopes of the linear fits to the vs. color-color diagrams for our five clusters are listed in Table 2 and plotted in Figures 2, 3, 4, 5, and 6. It is apparent that our derived slopes (color excess ratios) are reasonably consistent from region to region, but in a few instances, are more than 1- different from each other at the longer wavelengths. In particular, the selective color excess ratio toward the Ophiuchus cloud is lower than toward the other four clouds at 8.0. Since Ophiuchus has the smallest number of non-excess sources (120 vs. 400 for the other four regions)we assess the possibility that the difference is due to the small number of non-excess sources. We randomly select 120 non-excess sources from the Orion A field and measure the color-excess ratios in the four IRAC bands for the subsample, repeating this process for 1000 subsamples. We can estimate how likely it is to measure the Ophiuchus color-excess ratios based on the distribution of color-excess ratios in each of the four bands for the subsamples. For the 5.8 and 8µm bands the average color-excess ratio for the subsamples is 1.115 and 1.122, with a standard deviation of 0.06 for both bands. The Ophiuchus color-excess ratios are approximately 2 from these mean color-excess ratios at both 5.8 and 8µm, only a marginally significant deviation. The fraction of subsamples with color-excess ratios at or below the Ophiuchus values are 3% and 1% for the 5.8 and 8µm bands respectively. Thus sample size is unlikely to be the cause of the lower selective color excess ratio at 8.0 for Ophiuchus.
The color excess ratios for the off-cloud line-of-sight GLIMPSE data were derived using the same source selection criteria and methods as used for the five star-forming regions discussed here. In contrast to the general agreement among the clusters, the slopes from the GLIMPSE data listed in Table 2 are generally different from the cluster slopes. For completeness, we also quote the color excess ratios from Indebetouw et al. (2005) for the off-cloud line of sight. Since they directly measured , we form from those ratios in Table 2. Those values differ at 3.6 and 4.5 m from values determined by our analysis.
The question remains whether the larger sample size employed by Indebetouw et al. (2005) in determining the extinction law is the cause of the discrepancy, as was suspected for Ophiuchus. Their method uses red clump giant stars selected by their colors and only requires a detection in the three bands () that are used when measuring the color-excess ratios. This means that more sources are available for determining the color-excess ratios. To avoid this, and any other possible biases due to differing methodologies, we have reanalyzed the Indebetouw et al. (2005) data using the same methods that were applied to our five clusters as noted above. The off-cloud line-of-sight was studied in detail because it had the largest number of background sources and its extinction law was representative of the other two lines of sight. There were 1590 background sources that met our criteria, comparable to the number of background sources used for four of our five clusters. Indebetouw et al. (2005) find 3560 red clump giants along this same line of sight when requiring a detection in J and band. This includes stars that have an infrared excess due to circumstellar dust and stars that are not detected by IRAC. The actual number of sources used by Indebetouw et al. (2005) when measuring the color-excess ratios was smaller () after requiring an IRAC detection and removing stars with an infrared excess. We examine the effect of differing sample sizes by considering the Orion A field and varying the limit on the magnitude uncertainty. When limiting the magnitude uncertainty to 0.1, there were 1825 background sources, while changing the limit from 0.05 to 0.25 results in sample sizes ranging from 1265 to 2360. The color-excess ratios for the extreme cases differ from the case where the magnitude uncertainty is less than 0.1, and from each other, by less than the measured uncertainty in the color-excess ratios. As a result we do not expect differing sample sizes to provide a source of systematic error when comparing our results to those of Indebetouw et al. (2005).
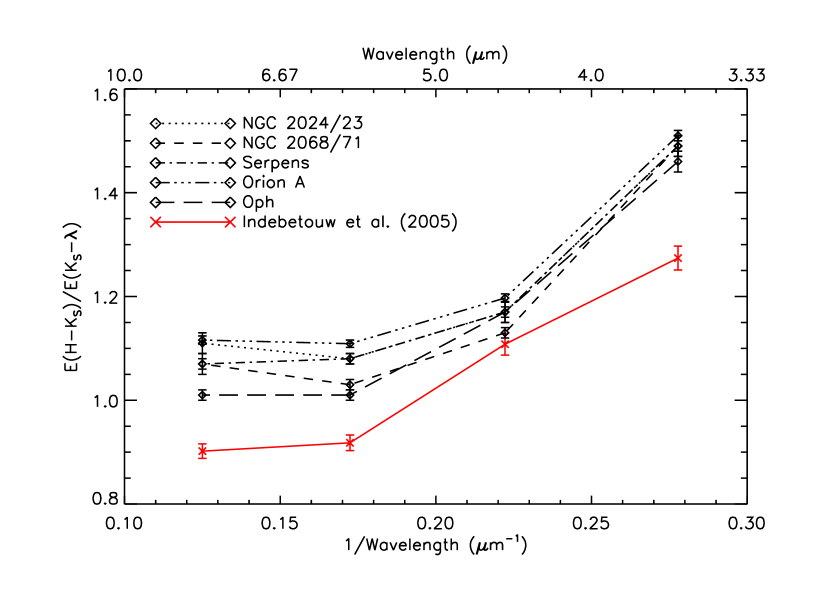
Figure 7 gives the color excess ratio versus for the five regions observed here as well as for the GLIMPSE off-cloud line-of-sight data analysed by us, showing the systematic separation between the color excess ratios derived for the GLIMPSE line of sight, and for the five young clusters. Our values are consistently 1-, or more, higher than those rederived from Indebetouw et al. (2005) data with the exception of the band.
The IRAC non-excess stars used when measuring the color-excess ratios can include class III pre-main sequence stars, main sequence stars and red giants (clump giants, and RGB stars), all of which have different intrinsic colors. Our constraint to exclude unreddened stars and bright probes should minimize contribution from foreground objects. The proximity of Serpens and Ophiuchus reduces the number of foreground contaminants which must be removed. Indebetouw et al. (2005) restrict themselves to red clump giant stars and find they are well-separated from main sequence stars on a vs. color-magnitude diagram for the regions they studied.
We examine the dependence on extinction probe by calculating residuals which are defined as the difference between for a given and the predicted using the Indebetouw et al. (2005) determination of . Figure 8, where the residuals are plotted versus color, shows the deviation of our extinction law determination for NGC , using non-excess stars, from that of Indebetouw et al. (2005) using red clump giants. As noted in 3, the parameterization used by Indebetouw et al. (2005) to pick out red clump giants will not apply to our cluster lines of sight. As can be seen in Figure 1 our extinction probes in NGC exhibit varying levels of extinction. If using only red clump giant probes produced a systematically different extinction law than we measured, we would expect a locus of sources to follow the Indebetouw et al. (2005) law at all four bands. No such locus is observed in Figure 8, suggesting that extinction probes are not the main cause of the systematic difference. Sources with , which are mostly red giants, show a substantial deviation from the Indebetouw et al. (2005) extinction law. Since both methods referred measurements to the -band rather than to the -band, a correction for different photometric systems is not necessary.
Rederived GLIMPSE color excess ratios are systematically separated from the color excess ratios for the five young clusters observed here. While there are differences in the results derived from the GLIMPSE data using the different methodologies, especially at 3.6 and 4.5µm, there is still a significant separation between our color excess ratios and those from Indebetouw et al. (2005). This suggests that the separation is not primarily caused by the differing methods and/or extinction probes. The systematic separation may instead be due to differences in the extinction from dust in the molecular clouds and the diffuse interstellar medium. This possibility will be further discussed in 4.1.4
4.1.2 IRAC-derived Extinction Law
We derive the extinction law for the five clusters studied here as well as for the selected GLIMPSE data, using the color excess ratios determined above. is related to the color excess ratios, and the assumed value of by:
| (2) |
Since we have used precisely the same methods to establish the extinction law for both data sets, we have removed uncertainties in the comparison that are method-dependent. In both cases we assume = 1.55: values for are listed in Table 3. In addition, we also give the extinction law for the off-cloud line of sight as derived by Indebetouw et al. (2005).
Different choices for will affect our derived values of . For NGC , for example, if () was chosen then would be for the four IRAC bands. If instead of 1.73 (=1.99) from Nishiyama et al. (2006) was chosen then would be for the four IRAC bands. The difference in these two determinations of the relative extinction law is larger than the statistical uncertainties in derived from the uncertainties in the selective color excess ratios, which are . The uncertainties reported in Table 3 include the uncertainties in the measured color excess ratios but do not include the uncertainty in .
The values of for each of the five regions observed here, subject to the assumption of , are plotted in Figure 9. The rederived extinction law for the off-cloud line of sight from Indebetouw et al. (2005) is also plotted in Figure 9. Extinction law measurements by Lutz (1999), included as squares in Figure 9, are more consistent with Indebetouw et al. (2005), although some of their measurments overlap with our results. The measurement at from Jiang et al. (2006) is marked with a circle in Figure 9, and the spread in their results for many different sight lines encompass both our results and the results from Indebetouw et al. (2005). Our extinction law deviates from a power law, as is also seen in these previous studies.
4.1.3 Comparison with ISO-Derived Extinction Laws from
Lutz (1999) compared the observed to expected fluxes for 15 hydrogen recombination lines toward the galactic center from ISO data and from this determined the extinction ratios at the wavelengths of the emission lines. Theoretical estimates of the expected fluxes assumed Te = 7000K, ne=3000 cm-3, case B recombination (which they verify from their observations) and refer directly to the calculations by Storey & Hummer (1995). The recombination line results also depend on the assumed helium abundance, [HeII]/[HeIII], and the assumption that line emissions emanate from the same volume. A crucial part of their analysis is the scaling of their relative extinction law: they deduce / (Br at 2.626m is the shortest-wave emission line they observe) and use a scaling law to refer to -band. We will use a law which corresponds to our assumed = 1.55, allowing for a more direct comparison with our values of (see discussion below). Numerical data on / were provided courtesy of D. Lutz: here we deduce from these data /, and using a factor of /=1.38 (assuming the power law index =1.65), deduce / for their data. Since we use 2MASS data, we have taken the wavelength for -band to be 2.16m. Power law indices of 1.61 and 1.8 lead to at most a 2% error in the extinction ratio. This is considerably more certain than variations in , which can be as much as 30% (Glass, 1999), so we choose not to compute for our data.
Jiang et al. (2006) combined ISO observations at 7 and 15 of the inner galactic plane with 2MASS and DENIS near-infrared observation to determine the mid-infrared extinction law and its variation along different sightlines. They assumed a constant value of , and for early AGB and RGB-tip stars and measured the color excess of these stars along various sightlines. Assuming from Rieke & Lebofsky (1985) they find and (marked as circles in figure 9). Although Rieke & Lebofsky (1985) did not measure the extinction law with the 2MASS photometric system, Indebetouw et al. (2005) found in the 2MASS photometric system to be similar to the value of measured by Rieke & Lebofsky (1985). The results from Jiang et al. (2006) do not change significantly when using from Indebetouw et al. (2005) as opposed to from Rieke & Lebofsky (1985). At 7 they find the extinction law measurements have a Gaussian distribution whose one sigma size encompasses the measurements presented here, as well as those of Indebetouw et al. (2005) and Lutz (1999). There is more uncertainty at but there also appears to be evidence for a Gaussian distribution of extinction values, .
We chose from Indebetouw et al. (2005) to provide a direct comparison of all the mid-infrared selective extinction law measurements discussed here. The extinction law measurements by Jiang et al. (2006) use a similar normalization to our assumed , and the measurements of Lutz (1999) were normalized using a power law form that is consistent with . Different assumptions of the near-infrared extinction law will affect our derived as discussed earlier, but we choose a single consistent normalization to better compare the various determinations of the mid-infrared extinction law.
4.1.4 Molecular Cloud vs. Diffuse Interstellar Extinction.
A plausible explanation for the separation between our extinction law and the extinction law of Indebetouw et al. (2005) is a variation in the extinction law between that through the diffuse ISM and through molecular clouds. Variation in dust optical properties between molecular cloud dust and that in the ISM has been invoked by Huard et al. (2007), who, from observations of cloud cores obtained as part of the c2d Spitzer Legacy program, have also found extinction law slopes (color excess ratios) which deviate from those of Indebetouw et al. (2005).
The cold ISM includes diffuse interstellar clouds ( 0.1), poorly shielded regions of molecular clouds ( 3), and dense molecular cloud cores ( 3). Whittet et al. (2001) and references therein, have explored grain growth in dense clouds, and have reported differing extinction laws for the diffuse ISM and dense clouds. For reference, =3 is shown as a vertical dashed line in Figure 8: most of the deviation of our results from the Indebetouw et al. (2005) extinction law occurs at higher extinctions. Changes in the extinction law originating in these regions are likely due to grain growth, either by coagulation of small grains or the growth of icy mantles, both of which will affect the continuum level of extinction. Small grains are thought to coagulate to form larger grains (e.g. Oph, Whittet et al. (2001)): grain emissivity is dependent on the optical constituent properties, and for the same constituents is proportional to a power(powers) of a/ where a is the grain size. Grain growth will not only remove small grains as potential absorbers, but also as emitters. The lack of emission from small grains has been observed along lines of sight with high column densities (Stepnik et al., 2003; del Burgo et al., 2003; Cambresy et al., 2005) suggesting grain growth leading to porous grains with enhanced emissivity within these clouds. Pendleton et al. (2006) have found a decrease in the depth of the 9.7 m silicate feature with increasing , indicating silicate grain growth. 3 is the approximate extinction threshold for the detection of ice mantles, and in the Taurus Dark Cloud, icy mantle growth is implicated (Whittet et al., 2001). Dust in molecular cloud cores is protected both from the UV interstellar radiation field and from cosmic ray processing; those dust grains may therefore have larger mantles consisting of water and organic ices (Gibb et al., 2004). Absorption features between 3 and 8µm due to ices are often seen along lines of sight intersecting dense molecular clouds (Knez et al., 2005; Gibb et al., 2004) while they are not seen in the diffuse ISM (Whittet et al., 1997). On the other hand, grain processing and fragmentation because of radiative shock propagation, and turbulence, may also be involved in grain evolution in both molecular clouds and in the diffuse ISM.
Our extinction law for the young clusters studied here derives mainly from dust associated with their molecular clouds, while that of Indebetouw et al. (2005) derives primarily from diffuse interstellar dust, especially for the off-cloud line of sight. There is a greater contribution from diffuse interstellar dust for the closest clusters in our sample, Ophiuchus and Serpens, partially because they are in the inner galaxy, and partially because the extinction probes (not excluded by the brightness cutoff) lie well behind the cluster, so that their light passes through more of the ISM before reaching the cluster. The extinction curve toward Ophiuchus has been termed anomalous: measurements of the UV/optical extinction curve and linear polarization (Green et al., 1992; Kim & Martin, 1996) toward Ophiuchus indicate a depletion of small grains and the presence of large grains within the molecular cloud. Studies of other dark clouds have produced similarly anomalous extinction as compared with the ISM: we are unaware of any comprehensive study comparing optical/UV extinction in the dark clouds studied here. Teixeira & Emerson (1999) observe H2O and CO ices in the Taurus and Ophiuchus dark clouds, and concur with previous studies that different physical conditions obtain in those two clouds. Although column densities of the H2O ices and the visual extinction are correlated in each case, the regression line is different. There are several Ophiuchus sources which follow the Taurus regression line rather than that for Ophiuchus, suggesting physical properties of the grains can also vary within the cloud. Schnee et al. (2005) and Dupac et al. (2003) measure the emissivity spectral index () in the far-infrared and find variations between Orion, Ophiuchus and Serpens. This indicates that the grain properties differ between these three clouds, but the anticorrelation between spectral index and temperature within a cloud suggests that there can be significant variations in grain properties along different lines of sight through a single cloud. Consequently, we cannot determine here the extent to which the molecular cloud mid-IR extinction toward Ophiuchus is anomalous compared with other clouds in our sample.
In contrast to our clusters, all within 500 pc of the Sun, the lines of sight for the ISO measurement may include a larger contribution from a mixture of extinction from the diffuse ISM and molecular clouds. The Lutz (1999) extinction law to the galactic center ionized gas is dominated by dust in the diffuse ISM along the line of sight, although some of the extinction is due to molecular cloud material (Lutz et al., 1996; Whittet et al., 1997). Broad ice absorption features at 3 and 6µm are seen toward Sgr A* and are attributed to foreground molecular cloud material (Chiar et al., 2000). The Jiang et al. (2006) extinction law is for a mix of diffuse ISM and dense molecular cloud dust. Given the uncertainties in the derived laws of Jiang et al. (2006) and Lutz (1999), we cannot distinguish whether any agreement, or lack of agreement with either our law or that of Indebetouw et al. (2005) depends on whether the material causing extinction is part of the diffuse ISM or a dense cloud.
The differing dust properties between diffuse ISM and dense molecular clouds could lead to differences in the extinction law. We directly measure , which relates and the assumed value of . A variation in the near-infrared extinction law, the mid-infrared extinction law, or both, could lead to the observed systematic separation in the selective color excess ratios between our observations through molecular clouds and Indebetouw et al. (2005)’s observations through the diffuse ISM. If a larger value of was more appropriate for the extinction law toward molecular clouds, then would be smaller and the mid-infrared portion of the extinction law deduced by Indebetouw et al. (2005) and us could be made to agree. Values of between 1.6 and 1.65, depending on the region, would bring our mid-infrared extinction law into agreement with the average extinction law reported by Indebetouw et al. (2005), assuming still applied to the Indebetouw et al. (2005) extinction law. It may also be the case that the near-infrared extinction law does not appreciably vary between the diffuse ISM and molecular clouds and there is instead a variation in the mid-infrared extinction law. We now examine the near- and mid-infrared data separately in order to attempt to break this degeneracy.
The possibility of variations in is suggested by recent observations. Although Cardelli et al. (1989) and Martin & Whittet (1990) found the near-infrared extinction law to be universal, more recent studies have produced mixed results. One of the difficulties in evaluating the variation in the near-infrared extinction law along different lines of sight is that different photometric systems (e.g. vs. ) can have a substantial effect on the measured extinction law (Kenyon, Lada & Barsony, 1998). Kenyon, Lada & Barsony (1998) and Gomez & Kenyon (2001) observed the nearby star-forming regions Oph and Cha I, respectively, and determined the near-infrared reddening law using the same technique, but with different photometric systems, and find a substantial difference in the reddening law between these two lines of sight. Naoi et al. (2006) reobserved Oph and Cha I with one photometric system and used the same technique, the same off-cloud regions, and the same limiting magnitudes as the previous studies by Kenyon, Lada & Barsony (1998) and Gomez & Kenyon (2001) but found no variation in the near-infrared reddening law between these two molecular clouds. Nishiyama et al. (2006) measured the extinction law toward the galactic center using the same photometric system as Naoi et al. (2006) and their results are consistent with the reddening law being universal between the Galactic Center and the Oph and Cha I star-forming regions. Evidence for a variation in the near-infrared reddening law comes from Racca et al. (2002) who observed the Coalsack Globule 2 using the same photometric system as Gomez & Kenyon (2001), and used the same technique to determine the reddening law, but found a significant difference between the reddening laws along these two lines of sight.
To isolate the influence of the near-infrared extinction law on our measured color-excess ratios we have measured in a manner similar to the previous color-excess ratios. Since we did not require a J band detection for the Orion A and Ophiuchus regions, we excluded these regions. NGC 2024/23, NGC 2068/71 and Serpens have color excess ratios of and . The l= off-cloud region has a color excess ratio of . No significant difference exists in the near infrared color excess ratios among these lines of sight within uncertainties, indicating that there is no significant variation in the near-infrared extinction law through these three molecular clouds and through the interstellar medium.
We examine the mid-infrared portion of the extinction law by forming color-excess ratios that include only IRAC bands from the already measured color excess ratios. From the definition of the color excess ratio
| (3) |
we form the following quantity:
| (4) |
By choosing and we have a measure of the IRAC-only color-excess ratio. By combining color-excess ratios rather than using the extinction law measurements, , we reduce the uncertainty in the IRAC-only color-excess ratio. The results are listed in Table 4 for all five young clusters as well as for the = off-cloud line of sight. While the uncertainties are large, there is clear evidence for a separation between the extinction law measured toward the molecular clouds and the extinction law for only the diffuse ISM. The tabulated values of this ratio demonstrate that the variations between our color-excess ratios and those of Indebetouw et al. (2005) cannot be explained solely by a change in the value of , and that the form of the interstellar extinction law must differ between the diffuse ISM, Ophiuchus, and the remaining four molecular clouds. It is also apparent that the Ophiuchus cloud reddening law differs from the reddening law for the other four young clusters.
4.2 The Extinction Law beyond
Extending our analysis out to 24µm we measure and , and , assuming , for Serpens and NGC 2068/71 respectively. The large uncertainty for both regions’ color excess ratios reflects the small number of sources used in the fitting procedure. Figure 10 shows the fit to the reddening bands at 24, similar to Figures 2 - 6. Figure 9 illustrates that our 24 determinations are in reasonable accord with those of Lutz (1999) shown as squares in Figure 9, given the large uncertainties, as well as with the measurement at 15 by Jiang et al. (2006), , shown as a circle in Figure 9. Huard et al. (2007) also measured the extinction law at and found it to be consistent with our results.
Rosenthal, Bertoldi & Drapatz (2000) measured the extinction law from toward OMC-1 using the relative intensities of rotation and ro-vibration lines. They fit a functional form assuming a power law for and included the silicate features at and , as well as a water ice feature at . The strength of the silicate feature was determined from a fit to their observations, while the relative strength of the and silicate feature was taken to be , an average of previous results from Draine & Lee (1984), Pegourie & Papoular (1985) and Volk & Kwok (1988). The shape of the 9.7µm feature was chosen to match the Trapezium emissivity profile, which is more appropriate for extinction due to dense molecular clouds rather than the narrower Cephei profile (Bowey et al., 1998). While the assumption of a power law from is clearly not valid, the extinction law from , as measured here and by Lutz (1999) and Jiang et al. (2006), is very well fit by a law dominated by silicate emission with the adopted strengths of the two silicate features given by Rosenthal, Bertoldi & Drapatz (2000), as can be seen in Figure 9. The silicate feature has been found to vary along different lines of sight (Bowey et al., 1998), particularly on the long-wavelength side of the feature, although there is insufficient data here to draw any conclusions about the universality of the extinction law from .
5 Conclusion
We measured the extinction law from toward five nearby star-forming regions and found it to be relatively internally consistent among different cluster-forming molecular clouds although there is evidence that the Ophiuchus extinction law deviates from the other four regions at 5.8 and 8µm. The extinction laws we present here differ systematically from the extinction at IRAC wavelengths derived by Indebetouw et al. (2005), as seen in both the color excess ratios and the relative extinction ratios. To exclude any possibility that this difference could be due to the differing methodologies used to derive the extinction law, we have also analysed data provided by R. Indebetouw using our methods, and continue to find systematic variation. The result could reflect a physical difference in the extinction law between the diffuse ISM and molecular clouds, or the differing extinction probes utilized in the two studies. Our study of the probes leads us to believe that the major cause of the discrepancy is variation in the diffuse ISM vs. molecular cloud extinction laws. The observed difference in the extinction law towards Ophiuchus could be caused by diffuse ISM behind the molecular cloud that the extinction probes must pass through or differing dust properties between the Ophiuchus cloud and the other four clouds studied.
The extinction law derived by Lutz (1999) agrees more closely with the re-derived Indebetouw et al. (2005) extinction law at wavelengths m. At 3m m, the opposite is true. At the relative extinction measured by Jiang et al. (2006) agrees with the cluster results. The extension of our extinction law to was also determined from analysis of Spitzer images of Serpens and NGC 2068/71, but further observations at this wavelength are required to provide statistically significant conclusions. However, our results at , along with the results of Lutz (1999) and Jiang et al. (2006), match well the functional form of Rosenthal, Bertoldi & Drapatz (2000) which includes extinction dominated by silicate features at 9.7 and 18. Future measurements of the extinction law for will help to better constrain this fit, as well as to examine any variation among different lines of sight.
References
- Allen et al. (2004) Allen, L.E., et al. 2004, ApJS, 154, 363
- Allen et al. (2007a) Allen, L.E., et al. 2007a in Protostars and Planets V, ed B. Reipurth, D. Jewitt, & K. Keil (Tucson: Univ. Arizona Press), 361
- Allen et al. (2007b) Allen, L.E., et al. 2007b in prep
- Bertoldi et al. (1999) Bertoldi, F., Timmermann, R., Rosenthal, D., Dropatz, S. & Wright, C.M. 1999, A&A, 346, 267
- Bessell & Brett (1988) Bessel, M.S. & Brett, J.M. 1988, PASP, 100, 1134
- Bowey et al. (1998) Bowey, J.E., Adamson, A.T. & Whittet, D.C.B. 1998, MNRAS, 298, 131
- Cambresy et al. (2005) Cambresy, L., Jarrett, T.H., & Beichman, C.A. 2005, A&A, 435, 131
- Cardelli et al. (1989) Cardelli, J.A., Clayton, G.C. & Mathis, J.S. 1989, ApJ345, 245
- Chiar et al. (2000) Chiar, J.E., Tielens, A.G.G.M., Whitter, D.C.B., Shuttle, W.A., Boogert, A.C.A., Lutz, D., van Dishoeck, E.F. & Bernsteain, M.P. 2000, ApJS, 154, 363
- Cohen (1993) Cohen, M. 1993, AJ105, 1860
- del Burgo et al. (2003) del Burgo, C., Laurejis, R.J., Ábrahám, P. & Kiss, Cs. 2003, MNRAS, 346, 403
- Draine (1989) Draine, B.T. 1989 Proc. 22nd Eslab Symposium on Infrared Spectroscopy, ESA SP-290, 93.
- Draine & Lee (1984) Draine, B.T. & Lee H. 1984, ApJ, 285, 89
- Dupac et al. (2003) Dupac, X., et al., 2003, A&A, 404, L11
- Evans et al. (2003) Evans, N.J., II, et al. 2003, PASP, 115, 965
- Fazio et al. (2004) Fazio, G.G., et al. 2004, ApJS, 154, 10
- Gibb et al. (2004) Gibb, E.L., Whittet, D.C.B., Boogert, A.C.A. & Tielens, A.G.G.M. 2004, ApJS, 151, 35
- Giles (1977) Giles, K. 1977, MNRAS, 180, 57P
- Glass (1999) Glass, I. 1999, Handbook of Infrared Astronomy (Cambridge University Press)
- Gomez & Kenyon (2001) Gomez, M. & Kenyon, S. 2001, AJ, 121, 974
- Green et al. (1992) Green, J.C., Snow, T.P., Cook, T.A, Cash, W.C. & Poplawski, O. 1992, ApJ, 395, 289
- Gutermuth (2005) Gutermuth, R.A. 2005, PhD thesis.
- Gutermuth et al. (2004) Gutermuth, R.A., et al. 2004 ApJ, 154, 374
- Huard et al. (2007) Huard, T., et al. 2007 in prep
- Indebetouw et al. (2005) Indebetouw, R., et al. 2005, ApJ, 619,931
- Jiang et al. (2006) Jiang, B.W., Gao, J., Omont, A., Schuller, F. & Simon, G. 2006, A&A, 446, 551
- Kenyon, Lada & Barsony (1998) Kenyon, S., Lada, E. & Barsony, M., 1998, AJ, 115, 252
- Kim & Martin (1996) Kim, S.-H. & Martin, P.G. 1996, ApJ, 462, 296
- Knez et al. (2005) Knez, C., et al. 2005, ApJ, 635, 145
- Lada et al. (2006) Lada, C.J., et al. 2006, AJ, 131, 1574
- Lada et al. (2007) Lada, C.J., Alves, J.F. & Lombardi, M. 2007, in Protostars and Planets V, ed. B Reipurth, D. Jewitt, & K. Keil (Tucson: Univ. Arizona Press), 3
- Lombardi et al. (2006) Lombardi, M., Alves, J.F. & Lada, C.J. 2006, A&A, 454, 781
- López-Corredoira et al. (2002) López-Corredoira, M. Cabrera-Lavers, A., Garzón, F. & Hammersley, P.L. 2002, A&A, 394, 883
- Lutz et al. (1996) Lutz, D., et al. 1996, A&A, 315, L269
- Lutz (1999) Lutz, D. 1999, in The Universe as Seen by ISO, ed. P. Cox & M.F.Kessler (ESA SP-427;Noordwijk:ESA), 623
- Martin & Whittet (1990) Martin, P.G. & Whittet, D.C.B. 1990, ApJ, 357, 113
- Megeath et al. (2004) Megeath, S. T., Gutermuth, R. A., Allen, L.E., Pipher, J. L., Myers, P. C. & Fazio, G. G., 2004, ApJS, 154, 367
- Muzerolle et al. (2004) Muzerolle, J., et al. 2004, ApJS, 154, 379
- Muzerolle et al. (2007) Muzerolle, J., et al. 2007 in prep
- Nishiyama et al. (2006) Nishiyama, S., et al. 2006, ApJ, 638, 839
- Naoi et al. (2006) Naoi, T., et al. 2006, ApJ, 640, 373
- Pegourie & Papoular (1985) Pegourie, B. & Papoular, R. 1985, A&A, 142, 451
- Pendleton et al. (2006) Pendleton, Y., et al. 2006, BAAS, 208.4915
- Press et al. (1992) Press, W.H., Teukolsky, S.A., Vetterling, W.T. & Flannery, B.P. 1992 “Numerical Recipes in C: The Art of Scientific Computing”, (Cambridge:Cambridge University Press)
- Racca et al. (2002) Racca, G., Gomez, M. & Kenyon, S., 2002 AJ, 124, 2178
- Reach et al. (2005) Reach, W.T., et al. 2005, PASP, 117, 978.
- Rieke et al. (2004) Rieke, G.H., et al. 2004, ApJS, 154, 25
- Rieke & Lebofsky (1985) Rieke, G.H. & Lebofsky, M.J. 1985, ApJ,288, 618
- Rosenthal, Bertoldi & Drapatz (2000) Rosenthal, D., Bertoldi, F. & Drapatz, S. 2000, A&A, 356, 705
- Schnee et al. (2005) Schnee, S.L., Ridge, N.A., Goodman, A.A. & Li, J.G. 2005, ApJ, 634, 442
- Stepnik et al. (2003) Stepnik, B., et al. 2003, A&A, 398, 551
- Storey & Hummer (1995) Storey, J. & Hummer, D. 1995, MNRAS272, 21
- Teixeira & Emerson (1999) Teixeira, T. C. & Emerson, J.P. 1999, A&A351, 292
- Volk & Kwok (1988) Volk, K. & Kwok, S. 1988,ApJ, 331, 435
- Weingartner & Draine (2001) Weingartner, J.C. & Draine, B.T. 2001, ApJ, 548, 296
- Wilson et al. (2005) Wilson, B.A., Dame, T.M., Masheder, M.R.W. & Thaddeus, P. 2005, A&A, 430, 523
- Winston et al. (2007) Winston, E., et al. 2007 in prep
- Whittet et al. (1993) Whittet, D.C.B., Martin, P.G., Fitzpatrix, E.L., Massa, D. 1993, ApJ, 408, 573
- Whittet et al. (1997) Whittet, D.C.B., et al. 1997, ApJ, 490, 729
- Whittet et al. (2001) Whittet, D.C.B., Gerakines, P.A., Hough, J.H. & Shenoy, S.S. 2001, ApJ, 547, 872
- Whitney et al. (2003) Whitney, B., Wood, K., Bjorkman, J.E. & Cohen, M. 2003, ApJ, 598, 1079
| Region | GTO Program IDs | Pipeline Version | Magnitude Zero Pointsaafootnotemark: | Frame TimebbHDR mode includes the time spent on both the long and short exposure. The effective exposure time after mosaicing the multiple maps of each region (two for NGC 2024/23, NGC2068/71 and Orion A, four for Serpens and Ophiuchus) will be longer than this frame time. |
|---|---|---|---|---|
| NGC | 43 | S9.5.0 | 21.93,21.26,19.08,19.44 | 12 |
| NGC | 43 | S9.5.0 | 21.93,21.26,19.08,19.44 | 12 |
| Orion A | 43 | S9.5.0 | 21.93,21.26,19.08,19.44 | 12 |
| Serpens | 6,174,177 | S11.4 | 21.99,21.26,19.07,19.44 | 12 |
| Ophiuchus | 6,174,177 | S11.4 | 21.99,21.26,19.07,19.44 | 12 |
For an exposure time of 10.4 seconds and object, inner and outer sky apertures of 2,2 and 6 pixels respectively.
| Region | ||||
|---|---|---|---|---|
| NGC | ||||
| NGC | ||||
| Serpens | ||||
| Orion A | ||||
| Ophiuchus | ||||
| Inddata | ||||
| Indpaper |
Note. — Values “Ind05 paper” are derived from color excess rations from Indebetouw et al. (2005) with their uncertainties propogated, and “Ind05 data” are derived from the data R. Indebetouw kindly provided. Both are for the off-cloud line of sight data. Ind05 data were analyzed in the same way that our data were analyzed, in order to enable direct comparison with our results. Our uncertainties are for a confidence level with uncertainties for a confidence interval in parenthesis.
| Region | ||||
|---|---|---|---|---|
| NGC | ||||
| NGC | ||||
| Serpens | ||||
| Orion A | ||||
| Ophiuchus | ||||
| Ind data | ||||
| Ind paper |
Note. — Quoted values taken from Indebetouw et al. (2005) (”Ind05 paper”) are for the off-cloud line of sight. The values of were derived from the measured selective color excess ratios for the five young clusters and the rederived color excess ratios for the line of sight assuming (Indebetouw et al., 2005). Uncertainties on derived here do not include the uncertainty in . Uncertainties on taken from Indebetouw et al. (2005) (labeled Ind05 paper) do include the uncertainty in .
| Region | |
|---|---|
| NGC | |
| NGC | |
| Serpens | |
| Orion A | |
| Ophiuchus | |
| Ind data |
Note. — Color Excess ratio derived using . See text for more details on this calculation.