Optical studies of the ultraluminous X-ray source NGC1313 X-2
Abstract
NGC1313 X-2 was among the first ultraluminous X-ray sources discovered, and has been a frequent target of X-ray and optical observations. Using the HST/ACS multi-band observations, this source is identified with a unique counterpart within an error circle of . The counterpart is a blue star on the edge of a young cluster of years amid a dominant old stellar population. Its spectral energy distribution is consistent with that for a Z=0.004 star with 8.5 about years old, or for an O7 V star at solar metallicity. The counterpart exhibited significant variability of mag between two F555W observations separated by three months, reminiscent of the ellipsoidal variability due to the orbital motion of this ULX binary.
1 INTRODUCTION
A class of luminous X-ray point sources, usually called ultraluminous X-ray sources (ULXs), has been established as non-nuclear sources with X-ray luminosities in the range 1039-1041 erg/sec. ULXs were discovered in nearby galaxies first by EINSTEIN (e.g., Fabbiano et al. 1989), ROSAT (e.g., Colbert & Mushotzky 1999), ASCA (e.g., Makishima et al. 2000) and now the Chandra and XMM X-ray observatories (e.g., Kilgard et al. 2002; Swartz et al. 2004). ULXs have stirred great excitement in the high energy community because some may be intermediate mass black holes (IMBHs) of 102-105 (Miller & Colbert 2004). This is because their luminosities exceed the Eddington limits for 10 black holes, and IMBHs are required if the sources are emitting isotropically at their sub-Eddington levels. Alternatively, ULXs could be stellar mass black holes with beaming effects, either mild geometric beaming (King et al. 2001) or relativistic beaming (Koerding et al. 2001), or with a radiation pressure dominated magnetized accretion disk where the photon-bubble instability operates and the radiation can exceed the Eddington limit by a factor of 10-100 (Begelman 2002).
NGC1313 X-2, located about 6′ south of the nucleus of NGC1313 at a distance of 3.7 Mpc (Tully 1988), was among the first ULXs discovered by EINSTEIN (Fabbiano & Trinchieri 1987). It has been a frequent target of ROSAT, ASCA, Chandra and XMM-Newton observations, and has shown clear variability of up to a factor of 2 on a timescale of months (c.f. Zampieri et al. 2004 and reference therein; Feng & Kaaret 2006). The ULX has a maximum X-ray luminosity of erg/sec in 0.3-10 keV, and has switched between high flux state with hard spectrum and low flux state with soft spectrum, unlike normal Galactic black hole X-ray binaries (Feng & Kaaret 2006). Miller et al. (2003) discovered, along with a power-law component, a cool accretion disk component of eV in its X-ray spectrum, suggesting an IMBH of . This IMBH interpretation, however, is not unquestionable and the spectrum can also be fitted by a stellar mass black hole with, e.g., a hot accretion disk (keV) plus a power-law component (Stobbart et al. 2006).
NGC1313 X-2 has been studied extensively in the optical to understand its companion and environments. A deep image reveals the ULX as located in an elongated supershell, which showed strong [S II] and [O I] lines with a FWHM of 80 km s-1 (Pakull & Mirioni 2002). Zampieri et al. (2004) identified the ULX with a point-like counterpart on an R image taken with the ESO 3.6m telescope. Their subsequent efforts (Mucciarelli et al. 2005) resolved the counterpart into two sources C1 and C2, with C1 claimed as a B0-O9 main sequence star of and C2 as a G supergiant of . Ramsey et al. (2006) studied HST ACS/WFC images and identified the ULX with C1, which they claimed an early B giant. Pakull et al. (2006) studied ESO/VLT and SUBARU observations, and found the counterpart less than 8 in an environment of 40-70 Myrs old. They detected the He II emission line in two blue spectra of the counterpart taken 3 weeks apart, with a line shift of 300 km/s. The He II line indicates the high ionization state for He, probably due to photoionization by the strong X-ray emission, or photoioniztion by Wolf-Rayet stars or shocks (e.g., Pakull & Mirioni 2002).
In this paper we report our studies of NGC1313 X-2 with the HST ACS observations. In section 2, we describe the observations utilized and the analysis procedures to identify the counterpart and to compute the photometry. The ULX is identified with a unique counterpart within an error circle of . Its spectral energy distribution is consistent with that for an O7 V star, and it showed variability above between two F555W observations. The counterpart has an age of years, and is located next to a loose cluster of blue stars. We discuss the implications of these results in Section 3.
2 DATA ANALYSIS AND RESULTS
NGC1313 X-2 was observed with HST ACS in four filters F330W, F435W, F555W and F814W on 2003-11-22, and in filter F555W on 2004-02-22 for program GO-9796. All observations (Table 1) were downloaded from the HST archive, and calibrated on the fly with the best calibration files.
2.1 Astrometry
The drizzled ACS/WFC images were used to identify the ULX. These images were generated by co-adding multiple exposures with the same filter and pointing with the DRIZZLE package (Fruchter & Hook 2002), which was able to reject most cosmic rays plaguing single exposures. The geometric distortion of the camera was corrected to better than 0.01 pixels (ACS handbook). The X-ray positions were taken from a 15 ksec Chandra ACIS-I observation (ID 3550), which was downloaded from the Chandra Data Archive and processed with CIAO 3.3.0. WAVDETECT (Freeman et al. 2002) was run to detect point sources, and two other X-ray sources (X3 and X4) were detected within of the ULX (Table 2).
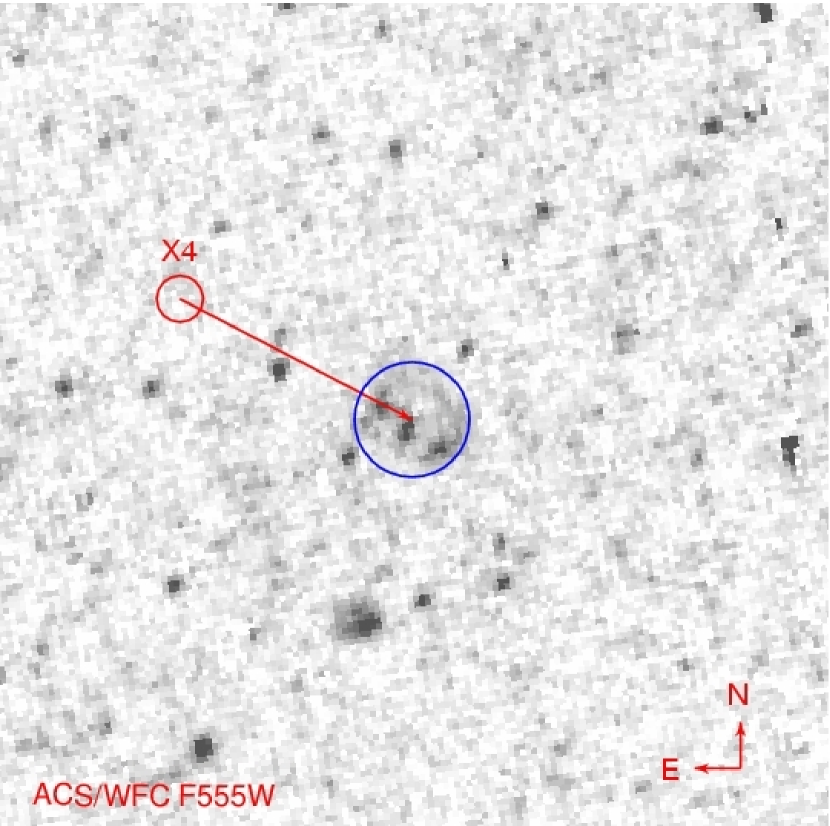
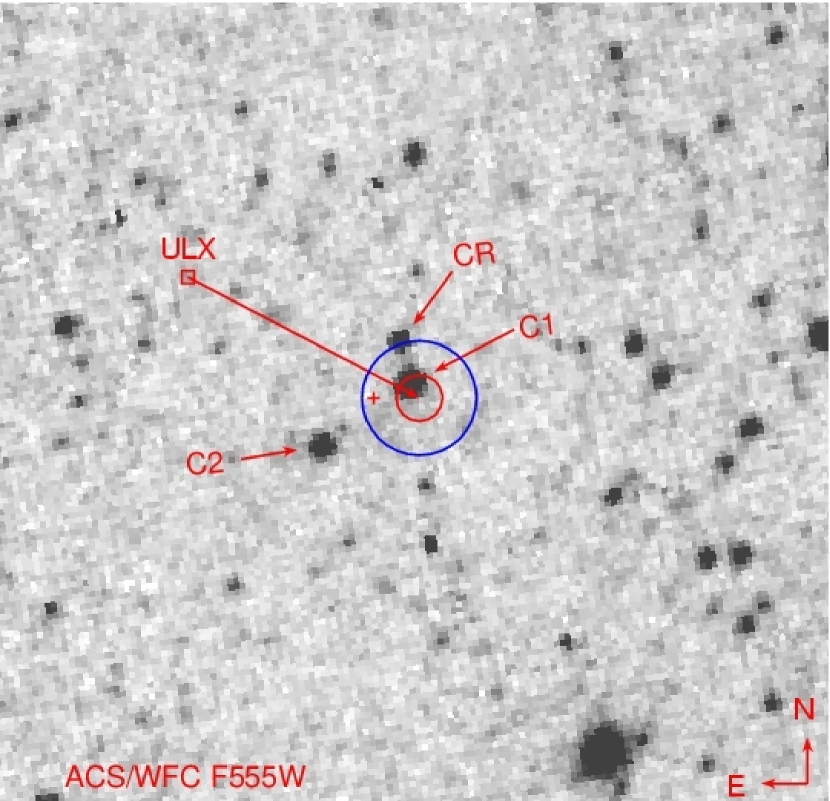
The direct registration of Chandra images on HST images yields a nominal error circle of , as a quadrature sum of the absolute position uncertainties from Chandra images (, Aldcroft et al. 2000) and HST images (, HST data handbook). Luckily, the ULX position on WFC images can be greatly improved with the help of X4, which was identified with the nucleus of a background galaxy with a size of as in Figure 1a. The correctional shift between the Chandra and HST positions of X4 was applied to the Chandra position of the ULX to obtain its HST position (Table 2). The positional error from this procedure included the ACIS plate scale variation ( for the separation between X4 and the ULX), the centroiding errors for X-ray sources ( for X4 and for the ULX; Table 2). These amounted to an error circle of around the ULX as shown in Figure 1b. Within this error circle was only one point-like object, which was the counterpart candidate C1 in Mucciarelli et al. (2005), and another candidate C2 was unambiguously excluded. While the highly absorbed X-ray spectrum and highly variable light curve of X4 were consistent with its identification as the nucleus of the background galaxy, it nevertheless could be any source in the dusty spiral arms. In this situation, the positional error had contribution from the size of the background galaxy, and could be as large as .
X3 had a very soft spectrum and was identified with a foreground star that was highly saturated on the WFC images. The optical position of X3 could be estimated roughly as the crossing of the two spikes as listed in Table 2. Despite the uncertainty () of this optical position, the ULX position obtained through X3 was consistent with that obtained through X4, as shown on Figure 1b. Note that the HST coordinates were offset relative to the Chandra coordinates. Such an offset was larger than the nominal error of , but was not uncommon, and was real given the successful identifications of both X4 and X3. In fact, in the study of another ULX in M81, the HST and Chandra positions for a conspicuous source, SN1993J, were offset by (Liu et al. 2002).
2.2 Photometry
Photometry for the ULX counterpart and nearby objects was computed on the drizzled images with the IRAF/DAOPHOT package. The drizzled images, originally given in unit of , were first converted to per pixel by multiplying the total exposure times (Table 1). An aperture of 3 pixels was used to extract the flux in the task PHOT, and the aperture corrections as taken from Sirianni et al. (2005) were applied to obtain the magnitudes for an “infinite” aperture. A fitting radius of 3 pixels was adopted to fit PSFs to objects. We computed the magnitudes both in the VEGAmag and the STmag systems, with the zeropoints taken from Sirianni et al. (2005). The photometry results from DAOPHOT were compared to those obtained with the HSTPHOT package (Dolphin 2000), which were consistent with each other to better than 0.1 mag.
Variability of the counterpart was studied with the two F555W observations in 2003 and in 2004, which were separated by three months. The sources from the two observations were cross identified, which led to 399 bright sources within of the counterpart. As shown in Figure 2, most sources did not exhibit significant variability between the two observations, confirming the stability of our photometry procedures. For 318 (i.e., 80%) of these objects, the variations were less than 2, with . Twelve sources exhibited variability above the significance level, and the counterpart was one of them with , an amplitude of 15% at a significance of .
The multi-band observations in 2003 were used to study the spectral energy distribution of the ULX counterpart. The flux densities at the central wavelengths for F330W, F435W, F555W and F814W were calculated from the STmag in these bands, and plotted in Figure 3 with corrections for different extinction values based on the extinction law prescribed by Cardelli, Clayton & Mathis (1989). The observations were compared to the absolute magnitudes and colors for blue stars of O5V, O7V, O9V and B1III spectral types as taken from Schmidt-Kaler (1982). If the counterpart is only corrected for the Galactic extinction of 0.11 mag toward NGC1313 (Schelegel et al. 1998), its F435W and F555W magnitudes are roughly consistent with those for an O9V star, but its spectral slope is shallower and its F814W magnitude is much brighter. If the counterpart is corrected for an extinction of E(B-V) = 0.33 mag, its overall spectral shape matches perfectly that for an O7V star ( mag, , ). The spectral shape will be over corrected if we apply E(B-V) = 0.44 mag, i.e., cm-2 as inferred from the power-law fit to the X-ray spectrum (Miller et al. 2003). The B1 III star has B and V magnitudes consistent with the counterpart, but its U magnitude is lower than the observation as shown in Figure 3. Note the properties for the MK spectral types are typical for stars with solar metallicity in our Solar neighborhood, therefore different from low metallicity stellar models.
2.3 Color-Magnitude Diagrams
The color-magnitude diagrams for the ULX and nearby bright stars were constructed to estimate their ages. Following the advice of Sirianni et al. (2005) against transforming ACS VEGAmag to standard magnitudes, we constructed the diagrams with VEGAmag and compared to isochrones computed in the HST ACS/WFC VEGAmag system111 http://pleiadi.pd.astro.it/isoc_photsys.02/isoc_acs_wfc/index.html for the Padova stellar models (Girardi et al. 2002). Studies of the interstellar medium of NGC1313 indicate a rather low metallicity of about 0.1-0.2 (Ryder 1993), thus isochrones for Z=0.004 were used to overlay on the diagrams in Figure 4. The magnitudes and colors in these diagrams were corrected for the Galactic extinction of E(B-V)=0.11 mag toward NGC1313.
Two stellar populations were clearly seen from the color-magnitude diagrams, a young population with ages less than a few years and an old population with ages years. The ULX counterpart belongs to the young stellar population. By comparing its position on the diagrams with those of the stellar models, we found that the counterpart has an age of years from its F435W and F555W magnitudes after corrections for E(B-V)=0.11 mag, but has an age of years from its F555W and F814W magnitudes. The two ages have smaller discrepancies for larger extinction corrections, and converge for E(B-V) = 0.33 mag, for which the counterpart has an age of years, an initial/current mass of , and a radius of . If this extinction is applied to all stars, the young population has ages of years, and the old population has ages of years.
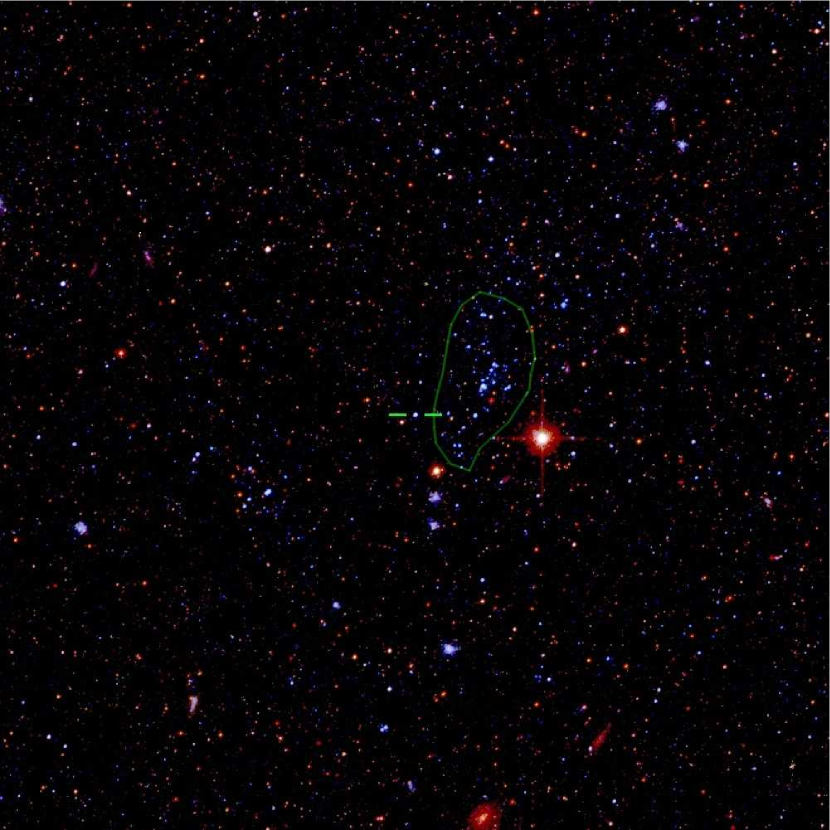
The two stellar populations are obvious on the accompanying true-color image centered at the ULX counterpart (Figure 7). The image was constructed from the F435W, F555W, and F814W observations in 2003, and the bright cosmic rays not removed by the DRIZZLE package were manually removed. The field was dominated by old red faint stars, with scattered young blue stars. A few tens of bright blue stars were loosely clustered within an irregular region of (i.e., ) as outlined on the image. The counterpart is the marked bright blue star located to the east-south edge of this loose cluster. The cluster region is much larger than for typical Galactic open clusters (), and the member stars may be the products of one star formation episode that are not bounded gravitationally. We note that this loose cluster consists of only blue stars, and no red supergiants. For the adopted stellar models with , only stars less massive than can evolve to red supergiants in years or longer. The absence of red supergiants indicates the open cluster is younger than years, regardless of the extinction correction. This is consistent with the results from comparison with isochrones.
3 DISCUSSION
Different efforts to identify the counterpart for NGC1313 X-2 have now converged upon the same blue star. By registering X-2 onto an ESO 3.6m R image with respect to SN1978K at away, Zampieri et al. (2004) identified a point-like object within the error circle, which was later resolved into two stars, C1 and C2, on ESO VLT images (Mucciarelli et al. 2005). Ramsey et al. (2006) used stars in the USNO B1.0 catalog to determine astrometric solutions for the HST ACS/WFC images to an rms accuracy of , and identified C1 as the counterpart. In this paper, we registered X-2 onto the HST ACS/WFC images with respect to two nearby X-ray sources that were both identified optically, and confirmed C1 as the counterpart within an error circle of . The chance for this blue star to be a bright interloper is negligible () given the small size of the error circle and the local stellar surface density. Furthermore, the blue star exhibited significant variability between two F555W observations, as expected if this blue star is the secondary of the X-ray binary. We conclude that the blue star C1 is the true counterpart for NGC1313 X-2.
Ramsey et al. (2006) studied the counterpart with the transformed B and V magnitudes and claimed it a 7-9 early B giant. They studied the nearby stars without any extinction correction and concluded that the stellar population was at least years old without any O stars. In this work, two more bands, F330W and F814W, were included in the spectral energy distribution of the counterpart, and it was found that an early B giant such as B1III does not match the overall spectral shape of the counterpart. The counterpart is brighter and hotter than a B1III giant, and should have a spectral form of in the observed optical bands, i.e., the Jeans tail for a blackbody spectrum. To correct the observed spectral shape to , an extinction value of E(B-V) = 0.33 mag is required. This value is, reasonably, lower than the value derived from X-ray absorption (0.44 mag); it is higher than the Galactic value (0.11 mag), suggestive of additional extinction in NGC1313 and the very vicinity of NGC1313 X-2. With this extinction correction, the counterpart has magnitudes and colors for a star with an age of years, a current mass of , and a radius of . Incidentally, the corrected magnitudes and colors are also consistent with those for an O7V star with , a mass of 30 , and a radius of 9 . This identification of the ULX as an O7V star joins previous ULX identifications as massive OB stars (e.g., Liu et al. 2002; Liu et al. 2004; Kaaret et al. 2004) to corroborate the ULX scenario in which the massive secondary is overflowing its Roche Lobe to supply the high accretion rate required for the high X-ray luminosity (king et al. 2001).
Pakull et al. (2006) speculated that the optical light from the X-ray illuminated the accretion disk dominated that from the secondary which they claimed a B giant. They argued that the X-ray illuminated accretion disk can reach mag for a stellar mass black hole with and hours based on the van Paradijs & McClintock diagram (1994) derived for Galactic low mass X-ray binaries, if the relation still holds for erg/s. For an X-ray illuminated accretion disk, the temperature depends on the radius roughly as (e.g., Frank, King & Raine 2002; Raymond 1993), and decreases to about 4000 K at . The resulted spectral energy distribution takes a form of in the observed bands, redder than the O star spectrum () by a color difference mag222For the O star spectrum, ; for the accretion disk spectrum, . Thus mag for nm and nm.. The presence of significant accretion disk light would modify the classification of the secondary and its estimated properties. In Section 2, we corrected the observed spectral energy distribution to that for an O7V star ( mag) by an extinction of E(B-V) = 0.33 mag, an extra E(B-V)=0.22 mag in addition to the Galactic E(B-V)=0.11 mag. Alternatively, the observed spectral energy may be interpreted as 12% from the secondary () plus 88% from the accretion disk () corrected only by the Galactic extinction E(B-V)=0.11 mag, or 56% from the secondary plus 44% from the accretion disk corrected by an extinction of E(B-V)=0.22 mag. In the first alternative, the secondary would have mag, similar to a B1V star ( mag) or slightly later. In the latter, the secondary would have mag, similar to a B1III giant ( mag).
We suggest the accretion disk light does not dominate the secondary light. The first of the above alternatives is not reasonable because there must be some extinction intrinsic to NGC1313. The second alternative is not true either, or else the composite spectrum would show a drop in F330W due to the cool B1III giant, which we did not observe. In fact, the same relation predicts a mag for the accretion disk around an IMBH of and a period of hours as shown later, 10% of the total observed light. Copperwheat et al (2006) carried out detailed simulations for seven ULX systems, and found that the light from the disk, depending on factors such as the disk size and the inclination angle, is generally much less than that from the secondary. Similarly, we expect that the optical light from the accretion disk is insignificant as compared to the massive secondary star. Nonetheless, the relative fraction of the optical light from the accretion disk can be measured with multiple simultaneous optical and X-ray observations. Assume the total optical light , with constant in all observations, and in linear proportion to the X-ray luminosity . In principle we can solve or best fit for and the linear factor if we have multiple (2+) observations in which the X-ray luminosities vary significantly.
3.1 The association with a young cluster
We emphasize that there is a young stellar population of years in additional to the apparent old population around NGC1313 X-2. Red stars from the old population are dominant in this sky region, while blue stars are rarer. Careful inspection of the accompanying true-color image shows that these blue stars are loosely clustered in a region that is not gravitationally bounded. The member stars may have been generated from the same star formation episode that is still active. Given the low surface density of this young cluster, it is easily missed, leading to claims that the whole stellar population is old. This is particularly true for short exposures and low resolution images, and may lead to an underestimate of the ULXs that are identified with young massive stars.
There are implications on the formation of NGC1313 X-2 given its location nearby, but not in the center of, a young cluster that is not gravitationally bounded. If NGC1313 X-2 has radiated below its Eddington luminosity, its peak luminosity of erg/sec will suggest a black hole of . Such an IMBH cannot be formed from massive stars with large mass loss due to stellar winds incurred by metal lines, but can be formed through mergers in dense clusters. One scenario is the merging of stellar mass black holes in the dense core of globular clusters (Miller et al. 2002). The chance for thus formed IMBHs below 300 to be kicked out of the cluster centers is not negligible, but the time scale is much longer than years to form a 200 IMBH (Gultekin et al. 2004). Another scenario is the merging of massive stars in super star cluster of (e.g., Portegies Zwart & McMillan 2002). Frequent stellar captures and mergers lead to super stars of that subsequently form IMBHs via direct collapses or supernova explosions in a few million years. The resulted IMBHs, however, tend to sit in the centers of super clusters, inconsistent with X-2’s location outside a young cluster.
Another formation scenario for NGC1313 X-2 is the merging of proto stars in proto clusters as suggested by Soria (2005). Stellar captures and mergers are enhanced by proto stellar disks/envelops and low stellar velocities, and super stars of can form in less than a million years in small proto clusters of . Subsequent explosions of these super stars will unbound the proto clusters, and form IMBHs of a few hundred in weakly bounded or unbounded clusters, usually off-center as found for NGC1313 X-2. This formation mechanism works best in low Z environments and in colliding or tidally interacting systems as exemplified by the Antennae (Fabbiano et al. 2002), Cartwheel (Gao et al. 2003), NGC7714/7715 (Smith et al. 2004) and M99 (Soria et al. 2005). NGC1313 X-2 is, incidentally, in an environment of low metallicity () in the southern satellite regions of NGC1313, which could be a tidally disrupted companion galaxy (Sandage & Brucato 1979) or the result of collision of huge HI clouds with the disk of NGC1313 (Marcelin & Gondoin 1983).
3.2 Optical variations
The counterpart exhibited variability of mag (3.3) between two ACS/WFC F555W observations separated by three months. Most probably, this variability reflects the orbital motion of an inclined binary system for NGC1313 X-2. Indeed, the variability is about the level of ellipsoidal variability expected for a high-mass secondary that approximately fills its Roche lobe. For example, the amplitude is mag for an O5V secondary, a 10 black hole, erg/s, and (Copperwheat et al. 2005).
It is unlikely that this variability is caused by the intrinsic variability of a pulsating star as the secondary. The observed variability and the blue color may be possible for a Cephei star that varies by 0.01 - 0.3 mag with periods of 0.1 - 0.6 days, or a Wolf-Rayet star or a Luminous Blue Variable (LBV) which exhibit day-to-day microvariations of 0.1-0.2 mag and “normal” variations of 1-2 mag on timescales longer than months. However, the secondary cannot be a Wolf-Rayet star because no prominent emission lines for Wolf-Rayet star were shown in VLT observations (Pakull et al. 2006). The secondary cannot be a Cephei star or a LBV because the observed luminosity () is high for a typical Cephei star (), but low for a typical LBV ().
On the other hand, the optical variability might have sizable contribution from the accretion disk in presence of substantial X-ray variability (e.g., flares). Fortunately, the change of the optical spectra will enable us to quantify this contribution, because the spectrum of an O type secondary is bluer than the accretion disk by a color difference of mag. For example, if the accretion disk light increases from 5% to 20% of the secondary light, the spectrum will get redder by 0.04 mag. Such a color difference can be detected by HST observations with 1% photometric accuracy.
A well designed photometric monitoring program can sample the ellipsoidal light curve and obtain the orbital period. The period of NGC1313 X-2 can be calculated as a function of the black hole mass () for the known secondary mass () and size (). The Roche lobe size of the secondary is solely determined by the orbital separation and the mass ratio as . If the secondary is filling its Roche lobe, i.e., , we can compute the orbital separation as , and subsequently calculate the period as . The predicted periods for different primary masses are shown in Figure 5, in which values as tabulated in Kopal (1959) are used. The analytic approximations to these tabulated values by Paczynski (1971) and by Eggleton (1983) were also tried, which gave periods different from Kopal of less than 5% as shown in Figure 5.
The predicted periods are largely determined by the secondary properties. Adopting Paczynski’s approximation for , , the period can be expressed as hr independent of the primary mass, in which is the mean density of the secondary in unit of g cm-3 (Frank, King & Raine 2002). For massive black holes (), the period is hours for a secondary of an O7V star (), hours for a B0III giant (), and hours for a B0I supergiant (). Thus, the observed period can be used to test possible classifications of the secondary. On the other hand, if the secondary mass and size can be determined by other means, the observed period can be used to constrain the black hole mass. In the case of NGC1313 X-2, the secondary mass and size are determined to be 8.5 and 7 by comparing to stellar models. We expect a period of hours for massive black holes, and shorter periods for primaries less massive than , i.e., a stellar mass black hole for this ULX (Figure 5).
The orbital velocities around the mass center for the Roche lobe filling system NGC1313 X-2 are shown in Figure 6 for different primary masses. For the secondary of 8.5 and 7 , the velocity increases from a few tens to a few thousands km/sec for black hole masses from a few to a few thousand . For an IMBH of a few hundred , the velocity change is about km/sec, easily detectable with low spectral resolutions of a few Å at optical wavelengths. The orbital velocity for the black hole (i.e., the accretion disk) decreases from to a few km/sec for increasing black hole masses. Note the radial velocity is smaller than the orbital velocity by for an inclination angle .
Pakull et al. (2006) detected broad He II emission lines with FWHMs of km/s in two ESO VLT spectra of NGC1313 X-2, which they attributed to the X-ray illuminated accretion disk. The He II line appeared to have moved by 300 km/sec, and may indicate the system has a stellar mass black hole since the orbital velocity change is very small for very massive black holes (Figure 6). However, the He II line from an X-ray illuminated accretion disk is usually broader, e.g., about km/s for an inclination angle of (Raymond 1993). The emission line will be narrower for smaller inclination angles (i.e, face-on), but the full amplitude radial velocity change will be reduced to much lower than 300 km/s. We suggest that the He II line comes from the X-ray photoionized nebula/secondary instead of the accretion disk. The line shift may be caused by noise given the low spectral resolution and low signal-to-noise ratios of the observations. Further observations that sample different orbital phases, with higher spectral resolution and higher signal-to-noise ratio, will help to interpret the He II line and place tight constraints on the black hole mass.
References
- (1) Begelman, M.C., 2002, ApJL, 568, L97
- (2) Cardelli, J., Clayton, G., and Mathis, J., 1989, ApJ, 345, 245
- (3) Colbert, E. J. M. and Mushotzky, R. F. 1999, ApJ, 519, 89
- (4) Copperwheat, C., Cropper, M., et al. 2006, submitted
- (5) Dolphin, A.E., 2000, PASP, 112, 1383
- (6) Eggleton, P., 1983, ApJ, 268, 368
- (7) Fabbiano, G. and Trinchieri, G., 1987, ApJ, 315, 46
- (8) Fabbiano, G. 1989, ARA&A, 27, 87
- (9) Freeman, P., Kashyap, V., Rosner, R., and Lamb, D., 2002, ApJSS, 138, 185
- (10) Feng, H. and Kaaret, P., 2006, astro-ph/0608066
- (11) Frank, J., King, A., and Raine, D., 2002, Accretion Power in Astrophysics, p54
- (12) Fruchter, A. and Hook, R., 2002, PASP, 114, 144
- (13) Gao, Y., Wang, Q., et al., 2003, ApJL, 596, 171
- (14) Girardi, L., Bertelli, G., Bressan, A., et al. 2002, A&A, 391, 195.
- (15) Gultekin, K., Miller, M.C., and Hamilton, D., 2004, ApJ, 616, 221
- (16) Kaaret, P., Ward, M., and Zezas, A., 2004, MNRAS, 351, L83
- (17) Kilgard, R., Kaaret, P., Krauss, M., et al. 2002, ApJ, 573, 138
- (18) King, A. R., Davies, M. B., et al., 2001, ApJ, 552, L109
- (19) Koerding, E., Falcke, H., Markoff, S., 2002, A&A, 382, L13
- (20) Kopal, Z., Close Binary Systems, 1959, p136
- (21) Liu, Ji-Feng, Bregmman, J.N., and Seitzer, P. 2002, ApJL, 580, L31
- (22) Liu, Ji-Feng, Bregman, J. N., et al., 2004, ApJ, 602, 249
- (23) Makishima, K., Kubota, A., Muzuno, T., et al. 2000, ApJ, 535, 632
- (24) Marcelin, M., and Gondoin, P., 1983, A&AS, 51, 353
- (25) Miller, J., Fabbiano, G., et al., 2003, ApJ, 585, 37
- (26) Miller, M. C. & Colbert, E., 2004, Int.J.Mod.Phys., D13, 1-64
- (27) Miller, M. C. & Hamilton, D., 2002, MNRAS, 330, 232
- (28) Mucciarelli, P.,Zampieri, L., et al. 2005, ApJ, 633, L101
- (29) Paczynski, B., 1971, ARA&A, 9, 183
- (30) Pakull, M.W. and Mirioni, L., 2002, astro-ph/0202488
- (31) Pakull, M.W., Grise, F., and Motch, C., 2006, astro-ph/0603771
- (32) Ramsey, C., Williams, R., et al. 2006, ApJ, 641, 241
- (33) Raymond, J., 1993, ApJ, 412, 267
- (34) Ryder, S.D. 1993, PhD thesis, Australian National University
- (35) Sandage, A., and Brucato, R., 1979, AJ, 84, 472
- (36) Sirianni, M., Jee, M., et al., 2005, PASP, 117, 1049
- (37) Schmidt-Kaler, Th., 1982, Landolt-Bornstein: Numerical Data and Functional Relationships in Science and Technology, VI/2b, P.15
- (38) Schlegel, D.J., Finkbeiner, D.P., and Davis, M., 1998, ApJ, 500, 525
- (39) Smith, B., Struck, C., and Nowak, M., 2005, AJ, 129, 1350
- (40) Soria, R. 2005, astro-ph/0509573
- (41) Soria, R. and Wong, D., 2006, MNRAS, in press (astro-ph/0608648)
- (42) Stobbart, A., Roberts, T., Wilms, J., 2006, MNRAS, 368, 397
- (43) Swartz, D., Ghosh, K., Tennant, A., and Wu, K., 2004, ApJS, 154, 519
- (44) Tully R.B, 1988, Nearby Galaxies Catalogue
- (45) van Paradijs, J., and McClintock, J., 1994, A&A, 290, 133
- (46) Zampieri, L., Mucciarelli, P., et al. 2004, ApJ, 603, 523
- (47) Zezas, A., Fabbiano, G., et al., 2002, ApJ, 577, 710
| ID | Filter | ExpT | DATE | ACor | ZVEGA | ZST | VEGAmag |
|---|---|---|---|---|---|---|---|
| j8ola2010 | HRC/F330W | 2760 | 2003-11-22 | 0.420 | 22.904 | 23.026 | 22.0370.021 |
| j8ol02040 | WFC/F435W | 2520 | 2003-11-22 | 0.277 | 25.779 | 25.157 | 23.4700.017 |
| j8ol02030 | WFC/F555W | 1160 | 2003-11-22 | 0.249 | 25.724 | 25.672 | 23.6250.026 |
| j8ol02010 | WFC/F814W | 1160 | 2003-11-22 | 0.292 | 25.501 | 26.776 | 23.6400.043 |
| j8ol06010 | WFC/F555W | 2240 | 2004-02-22 | 0.249 | 25.724 | 25.672 | 23.4720.021 |
Note. — The columns are (1) exposure ID, (2) filter, (3) total exposure in seconds, (4) observation date, (5) aperture correction in magnitude, (6) zeropoint for VEGAmag, (7) zeropoint for STmag, and (8) VEGAmag for the counterpart.
| ACIS-I | ACS/WFC | ||||
|---|---|---|---|---|---|
| Object | R.A. | Decl. | error | R.A. | Decl. |
| X4 | 03:18:25.250 | -66:36:36.04 | 03:18:24.911 | -66:36:37.09 | |
| ULXa | 03:18:22.238 | -66:36:03.49 | 03:18:21.900 | -66:36:04.54 | |
| X3 | 03:18:29.287 | -66:35:36.53 | 03:18:29.015 | -66:35:37.57 | |
| ULXb | 03:18:21.967 | -66:36:04.54 | |||
Note. — (a) This ULX position on ACS/WFC images is derived relative to the X4 position on ACS/WFC images. (b) This ULX position on ACS/WFC images is derived relative to the X3 position on ACS/WFC images.