Connecting the primordial and Galactic deuterium abundances
Abstract
The deuterium abundances inferred from observations of the interstellar medium within 1 – 2 kpc of the Sun range over a factor of three and the corresponding oxygen abundances show an even larger dispersion. While the lower D (and O) abundances likely result from depletion onto dust, the higher D abundances are consistent with the BBN-predicted primordial D abundance and chemical evolution models of the Galaxy with infall of primordial or nearly primordial material. The large ranges in deuterium and oxygen abundances suggest that the effects of depletion and/or infall have not been homogenized in the local interstellar medium.
keywords:
Galaxy: evolution – ISM: abundances.1 Introduction
Of the light nuclides produced in astrophysically interesting abundances (D, 3He, 4He, 7Li) during Big Bang Nucleosynthesis (BBN), deuterium is the baryometer of choice for several reasons. For example, the BBN-predicted primordial deuterium abundance is sensitive to the baryon (nucleon) density [(D/H) where ] and the post-BBN evolution of D is simple and monotonic: as gas cycles through stars, deuterium is only destroyed (Epstein, Lattimer & Schramm 1976; Prodanović & Fields 2003). A consequence of this simple evolution is that the post-BBN deuterium abundance is a probe of the fraction of the interstellar gas which has never been cycled through stars (Steigman & Tosi 1992, 1995). Models of the chemical evolution of the Galaxy, constrained by observations of the stellar and gas phase metal abundances, follow the history of the gas. As a bonus they predict the time-evolution of the deuterium abundance. Until relatively recently observations of deuterium in the Universe were limited to the interstellar medium (ISM) of the Galaxy, so that determinations of primordial deuterium required the input of chemical evolution models and, hence, were model-dependent (Steigman & Tosi 1992, 1995; Vangioni-Flam, Olive & Prantzos 1994; Prantzos 1996; Tosi 1996; Scully et al. 1997; Tosi et al. 1998). This changed with the advent of large, ground-based telescopes and with the Hubble Space Telescope (HST), which have enabled determinations of the D abundance along the lines-of-sight (LOS) to a few (at present, six) high-redshift, low-metallicity QSO Absorption Line Systems (QSOALS; Kirkman et al. 2003; O’Meara et al. 2006). At the same time observations of the angular distribution of the temperature fluctuations in the Cosmic Background Radiation (CBR), in combination with new data on the large-scale structure of the Universe (see, e.g., Spergel et al. 2006; Tegmark et al. 2006), have constrained the baryon abundance to , , leading to a BBN-predicted primordial D abundance accurate to 5 – 6 %, . Starting with this primordial abundance, what do Galactic chemical evolution (GCE) models predict for the current local ISM deuterium abundance and how well do these predictions compare to observations?
This paper is organized as follows. In Section 2 the predicted and observed abundances of D and O in the local ISM are reviewed and compared, accounting for depletion onto dust grains as well as localized infall of metal-poor, D-enhanced gas. The implications of ISM inhomogeneities are further discussed in Section 3. Finally, in Section 4 we draw our conclusions.
2 Comparing ISM Predicted And Observed Abundances
As gas cycles through stars, D is destroyed and the abundances of the “metals”, in particular oxygen, increase (from zero primordially). In addition to star formation, gas flows play a fundamental rôle in determining the chemical composition of gas and stars in galaxies. In particular, infall of primordial, or nearly primordial, gas plays a crucial rôle in the chemical evolution of our own Galaxy, enhancing the ISM D abundance, restoring it closer to its primordial value (see, e.g., Tosi 1988a, b). As a result the ISM deuterium abundance is not expected to depart from its primordial value until the ISM metallicity increases to solar (Romano et al. 2006). Underlying GCE models is the “conventional wisdom” that the local ISM is chemically homogeneous (i.e. the timescale for mixing in the local ISM is much shorter than stellar/chemical evolution timescales). Consequently, GCE models predict mean abundances for deuterium and the metals, e.g. oxygen, in the vicinity of the Sun at the present time. The data obtained from the Far Ultraviolet Satellite Explorer (FUSE; Oliveira et al. 2006; Oliveira & Hébrard 2006), however, reveal a factor three range for the D abundance and an even larger range for the O abundance, clearly in conflict with this simplifying assumption. The gas phase abundances of D and O are currently not distributed homogeneously in the local ISM.
2.1 Predicted ISM abundances
The GCE model-predicted ISM abundance of D is related to the primordial D abundance through the “astration” factor, . Many GCE models are found in the literature which address D evolution in the Milky Way. Generally, they adopt different prescriptions for the star formation rate, infall and outflow rates, initial mass function (IMF) and stellar lifetimes (see, e.g., Vangioni-Flam et al. 1994; Prantzos 1996; Tosi 1996; Scully et al. 1997; Tosi et al. 1998). Successful models which account for a wealth of observational data always find “low” values for , in the range . Recent models (Romano et al. 2006) in which the prescriptions of the stellar IMF and stellar lifetimes (Scalo 1986; Kroupa, Tout & Gilmore 1993; Maeder & Meynet 1989; Schaller et al. 1992) are allowed to change, predict that the astration factor and the current ISM oxygen abundances lie in the ranges, and , where (O/H). For a BBN-predicted primordial D abundance of , the GCE-predicted ISM D abundance is expected to lie in the range, .
There are at least two physical effects capable of accounting for the observed variations in D and O abundances along different LOS within kpc of the Sun. For an explanation of the variable deuterium abundances Linsky et al. (2006) embrace the suggestion of Draine (2004), based on earlier work of Jura (1982), that deuterium may be preferentially depleted (compared to hydrogen) onto dust grains. While Linsky et al. do not address the variation in oxygen abundances, depletion might provide a viable explanation for the dispersion among the observed oxygen abundances as well.
Another possibility is recent infall to the disk of the Galaxy of unprocessed (D-rich, O-poor) material which has been incompletely mixed in the ISM (see also Geiss, Gloeckler & Charbonnel 2002). In this case there would be an anti-correlation between the D and O abundances observed along such contaminated LOS. For example, if and are the “true” ISM abundances and and the abundances observed along a specific LOS, then incompletely mixed infall predicts
| (1) |
For example, if the Scalo (1986) IMF along with the stellar lifetimes of Schaller et al. (1992) are adopted, then according to Romano et al. (2006), and , so that
| (2) |
is predicted.
Since FUSE is often unable to provide sufficiently accurate H column densities, to interpret these data people usually rely on H column density determinations from other telescopes/observers. As a result, it is possible that some of the dispersion among the observed D and O abundances may be due to systematic errors in the associated H column densities (Timmes et al. 1997; Hébrard & Moos 2003; Steigman 2003). However, the ratio of D to O is unaffected by such errors. For 10(D/O) = , eq. 2 predicts
| (3) |
Of course, it may well be the case that both mechanisms (depletion and infall) are at work in the ISM. If so, the anticorrelations described by equations provide an upper envelope to the observations in the and D/O – planes (see Figs. 3 and 4). Infall of (nearly) primordial gas is often invoked to account for abundance variations in the ISM (e.g. Cartledge et al. 2004; Knauth, Meyer & Lauroesch 2006, and references therein). The required infall episodes should have occurred recently enough to avoid complete mixing of the ISM. The exact timescale on which clouds of partially ionized gas falling into the magnetized ISM will be thoroughly homogenized is not clear. At the same time it is clear that if depletion is the correct explanation for the observed variations in D and O abundances, then local depletions have not been homogenized either. Therefore, although it will be seen below that recent inhomogeneous infall on small (pc-sized) scales is not required to achieve concordance between the observed ISM abundances and GCE models, neither should it be rejected out of hand as contributing to the observed dispersion among the gas phase D and O abundances.
2.2 Observed – gas phase – ISM abundances
The abundance of deuterium in the relatively local ISM (within kpc of the Sun) has been explored for some 30 years beginning with observations by the Copernicus satellite and continuing with a series of space-based UV detectors (e.g. IUE, GHRS and STIS on the HST) up to the current IMAPS instrument on the FUSE satellite. The most recent and comprehensive abundance analyses are based on the data acquired by FUSE (Oliveira et al. 2006; Linsky et al. 2006; Oliveira & Hébrard 2006). These data are adopted in our analysis here, together with the abundances in the warm neutral medium of the lower Galactic halo recently determined by Savage et al. (2007).
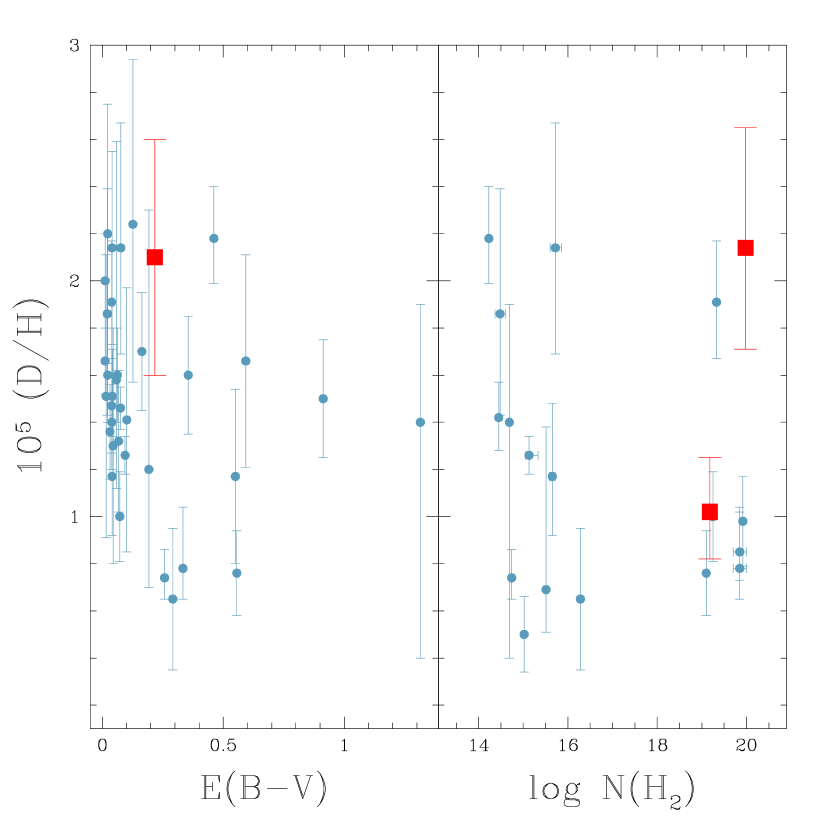
Linsky et al. (2006) suggest that local variations in the observed gas-phase D/H ratios can be explained by spatial variations in the depletion of deuterium onto dust grains. While this hypothesis of localized depletion provides a reasonable explanation for the observed variations in the D and O abundances, there is little direct evidence in support of it. For example, although the FUSE observations cover a range of four orders of magnitude in H column density [ logN(H ) 21.2], both the lowest and the highest deuterium abundances are found for 19.2 logN(H ) 21.0 (see Oliveira et al. 2006, their fig. 17, upper panel, and Oliveira & Hébrard 2006). Of course, since the LOS explored by FUSE range in distance (to the background star) from tens of parsecs to kpc, high H column density is not equivalent to high gas density. With few exceptions the FUSE data do not permit a direct determination of the local gas density. A surrogate for the gas density, (H )N(H )/, where is the distance to the background illuminating star, ranges over nearly three orders of magnitude, from cm-3 to cm-3. While this estimate doesn’t preclude much higher local densities, the largest of these is smaller than the densities associated with molecular clouds where depletion is expected to be efficient. Furthermore, here too, the evidence in support of D-depletion is ambiguous in that although some of the lowest (depleted?) D abundances are found at the highest values of (H ), so too are the majority of the highest (undepleted?) D abundances (see Oliveira et al. 2006, their fig. 19, upper panel). Alternatively, if dust depletion is, indeed, the culprit it might be anticipated that the deuterium and oxygen abundances should be anticorrelated with the LOS reddening, as measured by E(BV) or, with the molecular hydrogen fraction. We explored these possibilities (see Fig. 1 for deuterium) using estimates of E(BV) from Schlegel, Finkbeiner & Davis (1998) and H2 data from Hoopes et al. (2003), Linsky et al. (2006), Oliveira & Hébrard (2006). We find that although there is a tendency for the lowest (highest) deuterium abundances to correspond to the highest (lowest) E(BV) values and H2 fractions, many of the least reddened LOS, as well as those with the smallest H2 fractions, where depletion may be less likely, also have low D abundances. Furthermore, two out of eight LOS with the highest H2 fractions (HD 41161 and PG 0038+199) have some of the highest D abundances observed. Similar trends are found for the oxygen abundances [low O/H at low E(BV), low H2 fraction].
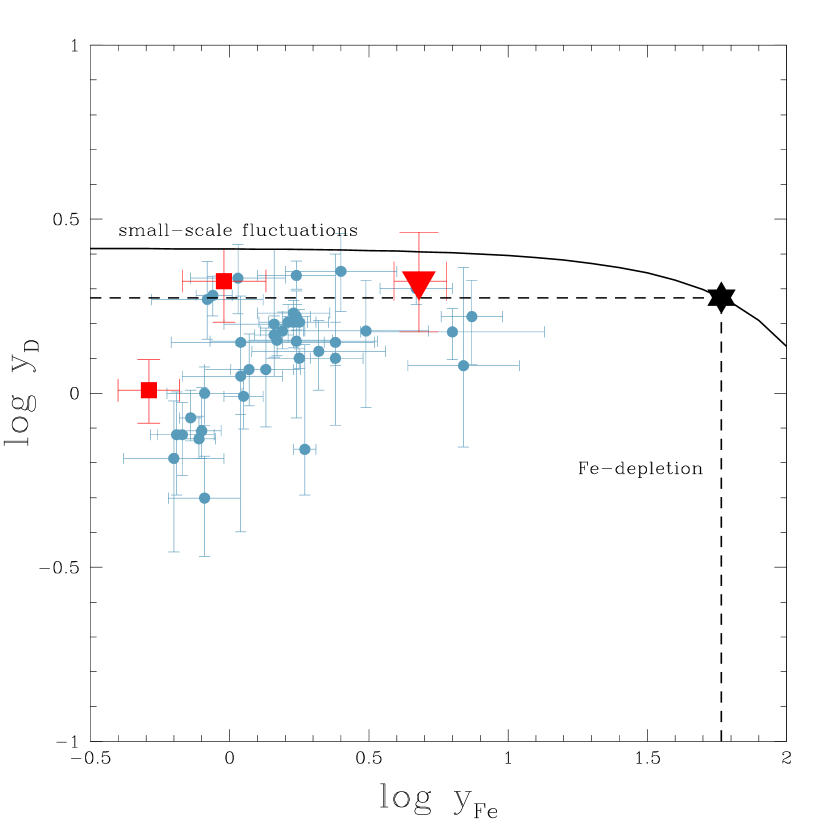
Perhaps the strongest evidence in support of D depletion comes from the correlation between D and Ti abundances (Prochaska, Tripp & Houk 2005; but see also Hébrard et al. 2005). The FUSE data (Oliveira et al. 2006; Linsky et al. 2006; Oliveira & Hébrard 2006) reveal a similar trend between D and Fe. These data, plotted in Fig. 2, show that the lowest D abundances are, indeed, correlated with the lowest Fe abundances [log , where (Fe/H)]. However, these data also suggest that deuterium may be undepleted along several of the LOS for which log . This calls into question the Linsky et al. (2006) assumption that a lower limit to the “true” ISM D abundance is provided by the maximum of .
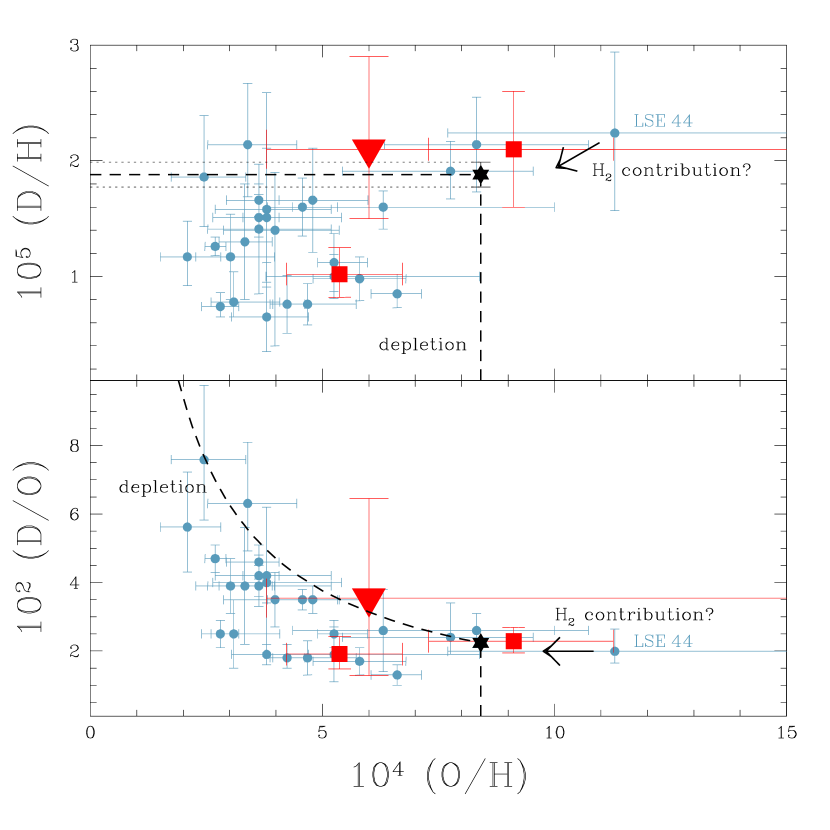
If dust depletion is the dominant mechanism responsible for the observed dispersion among the gas-phase abundances of deuterium and oxygen, the D and O abundances should be correlated (as D appears to be with Ti and Fe). Incompletely mixed infall of unprocessed material would give rise to an anticorrelation between the D and O abundances. To explore these trends in the FUSE data we concentrate on those LOS with data (mostly from Oliveira et al. 2006) for both the D and O abundances. The D/H and D/O ratios versus O/H are plotted in Figs. 3 and 4. If depletion dominates, none of the observed abundances should exceed the GCE-predicted values. For the fiducial model we adopted the Scalo (1986) IMF along with the Schaller et al. (1992) stellar lifetimes, so that and , leading to . The upper panel of Fig. 3 shows D/H versus O/H along with the upper bounds to their GCE-predicted ISM abundances if depletion dominates. We note that while most of the LOS have D or O abundances which lie below these bounds, consistent with depletion, none of them are more than 1 above these GCE-predicted ISM abundances, consistent with some of these LOS being depletion-free. One possible exception may be the LOS towards LSE 44 (Friedman et al. 2006; see Fig. 3). However, as Liszt (2006) notes, it is important to account for molecular hydrogen when determining the ISM deuterium abundance, since failure to do so biases the resulting D/H (and O/H) ratio(s) upward. Liszt notes that molecular hydrogen is unlikely to be negligible (compared to H ) whenever N(H )cm-2 and should be considered whenever N(H )cm-2. This makes the LOS to LSE 44, with N(H )cm-2, a good candidate for possibly overestimated D and O abundances111 Although within the errors the D and O abundances measured towards LSE 44 are, in fact, consistent with the predictions of our fiducial GCE model (, ), it is worth emphasizing that if molecular hydrogen were to contribute N(H2)/N(H ) = 0.19 along this LOS, then would be reduced from 2.24 to 1.88, and from 11.3 to 9.5, in even better agreement with the model predictions.. This possibility is indicated by the arrows in Figs. 3 and 4; note that the D/O ratios are unaffected.
The large difference in H and D column densities, orders of magnitude, is a potential source of systematic errors for the D/H determinations. The difficulties associated with determining D/H may be avoided by measuring the D/O ratio. Since charge exchange reactions between singly-ionized and neutral H and O (Field & Steigman 1971) couple H to O , oxygen (O ) is a good tracer of hydrogen (H ), so that the D/O ratio might be a good proxy for the D/H ratio (Timmes et al. 1997; Hébrard & Moos 2003; Steigman 2003). The D/O ratio is plotted (versus O/H) in the lower panel of Fig. 3. Indeed, the FUSE data (Oliveira et al. 2006; Linsky et al. 2006; Oliveira & Hébrard 2006) reveal that the D/O ratio has an even larger dispersion than that for D/H (a factor of 5, similar to that for O/H), suggesting that the variations in O and in D abundances may be real and not the result of systematic errors. However, note that, as seen in the lower panel of Fig. 3, the upper envelope of the D/O versus O/H data is consistent with an undepleted ISM D abundance of .
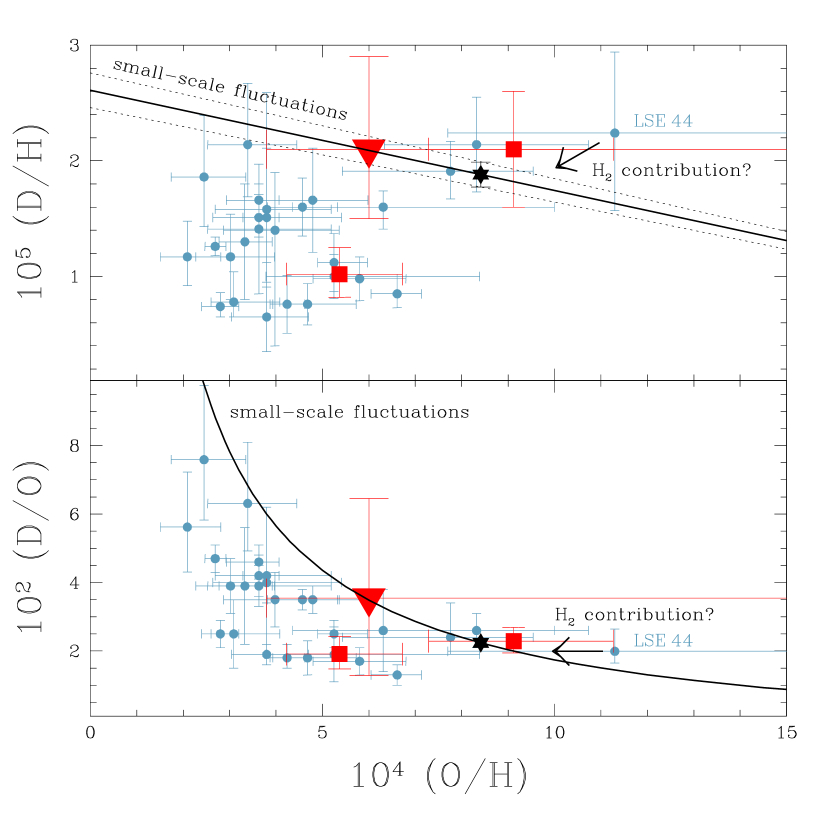
While the lower D and O abundances shown in Figs. 3 and 4 may have resulted from the depletion of gas phase D and O, the highest deuterium and oxygen abundances derived from the FUSE data are consistent with present epoch average ISM deuterium and oxygen abundances of and . For deuterium, these are consistent with a primordial abundance and a Galactic astration factor of 1.39, suggesting that gas phase D (and O) may be undepleted along at least some LOS in the local ISM. Modest depletion of deuterium along some of these high-D LOS could also be consistent with the data provided that the D (and O) variations are due, in part, to the contribution of incompletely mixed, D-enhanced, O-reduced infall222 Notice that our models are computed assuming infall of primordial (i.e. O-free) material. The conclusions are unchanged if the infalling material is slightly enriched ( 0.2 , as for instance that coming from the Magellanic Stream; Tosi 1988b; Tosi et al. 1998).. This latter possibility is shown in the two panels of Fig. 4. Even including the LOS to LSE 44, whose D/H and O/H ratios might be overestimated if there is a non-negligible contribution from unobserved H2, the FUSE data are consistent with primordial deuterium, GCE models, depletion, and – possibly, but not necessarily – local fluctuations due to infall.
3 Discussion
Despite the evidence of 30 years of data to the contrary, until recently the conventional wisdom has been that the local ISM is well mixed, with unique abundances of the chemical elements, D and O in particular. The FUSE data, complementing earlier observations, which reveals a factor of three range for D/H () and an even larger dispersion among the O/H ratios (), lays to rest this overly simplified assumption. While Linsky et al. (2006) don’t address the spread in oxygen abundances, they invoke localized depletion to account for the observed range of deuterium abundances. Although independent observational evidence for depletion is currently ambiguous, this mechanism does provide a description of the data. If so, the question becomes which, if any, of the observed D/H ratios represents the “true” (undepleted) ISM abundance?
Linsky et al. (2006) assume that the true D abundance is “equal to or slightly above the highest measured (D/H)gas ratios”. Limiting themselves to the 5 LOS with the highest D abundances, Linsky et al. conclude that (or, including a correction for the Local Bubble D abundance, or , depending on the scheme for weighting the data). These choices correspond to an astration factor , considerably smaller than those predicted by GCE models (Tosi 1996 and references therein; Chiappini, Renda & Matteucci 2002; Romano et al. 2006). However, given the errors associated with the FUSE D/H determinations, it is unclear why their estimate should have been limited to the 5 LOS with the highest central values of the D/H ratios since there are more than a dozen other LOS whose central values of D/H are within 1 of them. To test our hypothesis that an astration factor of 1.39, in combination with a BBN expected primordial abundance of , is consistent with the FUSE data, we have considered the 18 FUSE LOS with the highest D/H ratios (). Of these, nine have central values and nine have . Using these data we may test the assumption that the undepleted ISM D abundance is consistent with . We find that 13/18 (72%) have central values of D/H within 1 of our adopted ISM abundance and none are more than 1.4 away. The reduced is 0.70 (for 17 degrees of freedom) suggesting a more than % probability that the D abundances along these 18 LOS are consistent with our adopted value ( = 1.88).
Indeed, we have been “conservative” here in that, had we adopted for the primordial D abundance the O’Meara et al. (2006) estimate of inferred from the data for 6 high-z, low-Z QSOALS, consistency with the FUSE data is improved, allowing a slightly larger astration factor of .
In addition to inhomogeneously distributed depletion and possible systematic errors in some of the H column density determinations, some of the variations in D and O abundances could be due to incompletely mixed, recent infall of nearly primordial gas. As shown in the lower panel of Fig. 4, the upper envelope of the D/O ratios reveals a trend with O/H consistent with localized infall. However, although infall may contribute to the large dispersions in the D and O abundances, depletion appears to be required to account for the lowest D/H and O/H observed ratios. In any case, with or without localized infall, at least some of the current GCE models are consistent with the FUSE-inferred and CBR-predicted BBN D abundances.
4 Summary and Conclusions
Standard galactic chemical evolution models predict the climate and not the weather and, hence, they provide average abundances for deuterium and oxygen (as well as other chemical species) in the local ISM. This is in contrast to the large dispersion among the gas phase D and O abundances in the neutral ISM revealed by 30 years of data. Here we have demonstrated, despite recent claims to the contrary (Linsky et al. 2006; Savage et al. 2007), that current models for the chemical evolution of the Milky Way (Romano et al. 2006) are consistent with the FUSE inferred and CBR-predicted BBN deuterium abundances. While depletion of D (and O) onto dust grains (Draine 2004) alone may suffice to account for the observed variations, recent infall of (nearly) primordial gas on small spatial scales can not be ruled out as a viable explanation for at least some of the highest observed D abundances. It is worth emphasizing that such inhomogeneous infall – which must have occurred recently enough that mixing processes have not yet erased its elemental abundance signature – sums up to the continuous, homogeneous infall required by chemical evolution models to account for the solar neighbourhood metallicity data. Finally, notice that neglect of possible contributions from molecular hydrogen (Liszt 2006) may have biased some of the observed abundances upwards, enlarging the observationally inferred range for the present-day D/H (and O/H).
Acknowledgments
This research is supported at The Ohio State University by a grant (DE-FG02-91ER40690) from the US Department of Energy. DR and MT acknowledge useful discussions with the members of the LoLa-GE Team, the warm hospitality and generous financial support at the International Space Science Institute in Bern.
References
- [1] Cartledge S. I. B., Lauroesch J. T., Meyer D. M., Sofia U. J., 2004, ApJ, 613, 1037
- [2] Chiappini, C., Renda A., Matteucci, F., 2002, A&A, 395, 789
- [3] Draine B. T., 2004, in McWilliam A., Rauch M., eds, Origin and Evolution of the Elements. Cambridge University Press, Cambridge, p. 317
- [4] Epstein R., Lattimer J., Schramm D. N., 1976, Nat, 263, 198
- [5] Field G. B., Steigman G., 1971, ApJ, 166, 59
- [6] Friedman S. D., Hébrard G., Tripp T. M., Chayer P., Sembach K. R., 2006, ApJ, 638, 847
- [7] Geiss J., Gloeckler G., Charbonnel C., 2002, ApJ, 578, 862
- [8] Hébrard G., Moos H. W., 2003, ApJ, 599, 297
- [9] Hébrard G., Tripp T. M., Chayer P., Friedman S. D., Dupuis J., Sonnentrucker P., Williger G. M., Moos H. W., 2005, ApJ, 635, 1136
- [10] Hoopes C. G., Sembach K. R., Hébrard G., Moos H. W., Knauth D. C., 2003, ApJ, 586, 1094
- [11] Jura M., 1982, in Kondo Y., Mead J., Chapman R. D., eds, Advances in UV Astronomy. NASA, Washington, p. 54
- [12] Kirkman D., Tytler D., Suzuki N., O’Meara J. M., Lubin D., 2003, ApJS, 149, 1
- [13] Knauth D. C., Meyer D. M., Lauroesch J. T., 2006, ApJ, 647, L115
- [14] Kroupa P., Tout C. A., Gilmore G., 1993, MNRAS, 262, 545
- [15] Linsky J. L., et al., 2006, ApJ, 647, 1106
- [16] Liszt H. S., 2006, A&A, 452, 269
- [17] Maeder A., Meynet G., 1989, A&A, 210, 155
- [18] Oliveira C. M., Hébrard G., 2006, ApJ, 653, 345
- [19] Oliveira C. M., Moos H. W., Chayer P., Kruk J. W., 2006, ApJ, 642, 283
- [20] O’Meara J. M., Burles S., Prochaska J. X., Prochter G. E., Bernstein R. A., Burgess K. M., 2006, ApJ, 649, L61
- [21] Prantzos N., 1996, A&A, 310, 106
- [22] Prochaska J. X., Tripp T. M., Howk J. C., 2005, ApJ, 620, L39
- [23] Prodanović T., Fields B. D., 2003, ApJ, 597, 48
- [24] Romano D., Tosi M., Chiappini C., Matteucci F., 2006, MNRAS, 369, 295
- [25] Savage B., Lehner N., Fox A., Wakker B., Sembach K., 2007, ApJ accepted (astro-ph/0701110)
- [26] Scalo J. M., 1986, Fund. Cosm. Phys., 11, 1
- [27] Schaller G., Schaerer D., Meynet G., Maeder A., 1992, A&AS, 96, 269
- [28] Schlegel D. J., Finkbeiner D. P., Davis M., 1998, ApJ, 500, 525
- [29] Scully S., Cassé M., Olive K. A., Vangioni-Flam E., 1997, ApJ, 476, 521
- [30] Spergel D. N., et al., 2006, ApJ submitted (astro-ph/0603449)
- [31] Steigman G., 2003, ApJ, 586, 1120
- [32] Steigman G., Tosi M., 1992, ApJ, 401, 150
- [33] Steigman G., Tosi M., 1995, ApJ, 453, 173
- [34] Tegmark M., et al., 2006, Phys. Rew. D accepted (astro-ph/0608632)
- [35] Timmes F. X., Truran J. W., Lauroesch J. T., York D. G., 1997, ApJ, 476, 464
- [36] Tosi M., 1988a, A&A, 197, 33
- [37] Tosi M., 1988b, A&A, 197, 47
- [38] Tosi M., 1996, in Leitherer C., Fritze-von-Alvensleben U., Huchra J., eds, ASP Conf. Ser. Vol. 98., From Stars to Galaxies: The Impact of Stellar Physics on Galaxy Evolution. Astron. Soc. Pac., San Francisco, p. 299
- [39] Tosi M., Steigman G., Matteucci F., Chiappini C., 1998, ApJ, 498, 226
- [40] Vangioni-Flam E., Olive K. A., Prantzos N., 1994, ApJ, 427, 618