119–126
Are interpolations in metallicity reliable?
Abstract
In this proceeding we present the procedure that we have adopted to obtain a dataset of Padova94 tracks ([Bressan et al.(1993), Fagotto et al.(1994), Fagotto et al.(1994)]) interpolated in metallicity. The procedure requires special care to avoid spurious features in the resulting grid, thus we have subdivided tracks in evolutionary phases, we have chosen the suitable interpolation method and the transition masses. Finally, we have compared our interpolated dataset with a similar models, [Girardi et al.(2000)], obtaining a general good agreement.
keywords:
stars: evolution, Hertzsprung-Russell diagram1 Introduction
The Star Formation History (SFH) of stellar populations (e.g. galaxies and clusters) may be derived using the Synthetic CMD Method (SCM) based on the interpolation in mass and age of the Stellar Evolutionary Models (SEM).
To perform systematic studies and comparisons of the SFH of galaxies, the SEMs should have: i) a dense grid over a large masse range (up to 100 M⊙) to cover the entire age of the Universe; ii) a homogeneous input physics; iii) a dense grid in metallicity (Z) to cover the large range in metallicity of the stellar populations.
At present, only a few SEMs datasets satisfy two of the previous points: Padova94 ([Bressan et al.(1993), Fagotto et al.(1994), Fagotto et al.(1994)]) dataset is one of them, but its grid in metallicity is too coarse, particularly in the Z range 0.0004 - 0.004, that is the most commonly used. To compensate for this limitation, we have interpolated in this metallicity range the Padova94 models.
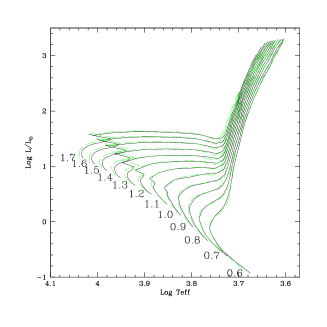
In this work, we discuss (section 2) our cares and prescriptions to obtain the interpolated tracks for Z=0.001 (fig. 1). The comparison between our results and [Girardi et al.(2000), hereafter G00] models, of the same metallicity, are shown in section 3, in order to emphasize the reliability of the interpolation.
2 The method
The interpolation in metallicity require special care to avoid spurious features in the resulting grid. Our procedure goes through three steps:
-
1.
The subdivision of the tracks in specific evolutionary phases with: i) the same internal burning processes; ii) comparable lifetimes; iii) similar behaviors on the HRD.
The subphases differ for the low, intermediate or high masses because of the different structures on the HRD. Interpolations are performed at constant fractionary age within each subphase. -
2.
We have performed several tests within Padova94 sets to get the reliable interpolation method. We have found that an average of linear and logarithmic factor in Z gives us the best result. The age has been linearly interpolated.
-
3.
We choose the transition masses for the selected metal content taking into account the trend of the transition masses over all the metallicity range.
3 Comparison and Conclusions
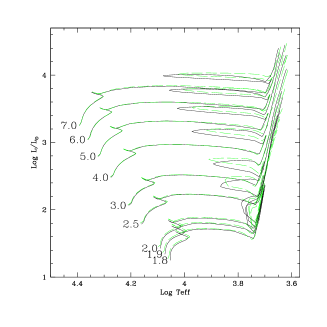
G00 models are similar to Padova94 models, although some differences are present because of different input physics. We test our interpolated tracks by comparing them with G00 models at Z=0.001:
-
1.
The of the H-burning phase is less than 2% for M M⊙. and smaller than 15% for M M⊙. The latter discrepancy reflects the different definition of the overshooting parameter in the mass range 1-1.4 M⊙.
-
2.
The of the He-burning phase is less than 15% for M M⊙ and smaller than 7% for M M⊙. For M=1.7 M⊙ the He-burning lifetime of our model is two times larger than that of G00. This is because in our set the M=1.7 M⊙ is adopted to be below the transition mass, while in G00 models it is close to the transition mass.
Taking into account the differences in the input physics, we find a good general agreement by comparing the interpolated tracks with the G00 models (e.g. the lifetime of the major phases are reasonably well evaluated) although some difference are present especially in the extention and luminosity of the blue loops.
The results showed here refers to a specific choice of Z. The same interpolation algorithm has been succesfully applied to other interpolated dataset (Z=0.002,0.003) and for other metallicity range (Z=0.004-0.008).
References
- [Bressan et al.(1993)] Bressan A., Fagotto F., Bertelli G., Chiosi C., 1993, A&AS, 100, 647
- [Fagotto et al.(1994)] Fagotto F., Bressan A., Bertelli G., Chiosi C., 1994, A&AS, 105, 29
- [Fagotto et al.(1994)] Fagotto F., Bressan A., Bertelli G., Chiosi C., 1994, A&AS, 104, 365
- [Girardi et al.(2000)] Girardi L., Bressan A., Bertelli G., Chiosi C., 2000, A&AS, 141, 371