X-ray Localization of the Globular Cluster G1 with XMM-Newton
Abstract
We present an accurate X-ray position of the massive globular cluster G1 by using XMM-Newton and the Hubble Space Telescope (HST). The X-ray emission of G1 has been detected recently with XMM-Newton. There are two possibilities for the origin of the X-ray emission. It can be either due to accretion of the central intermediate-mass black hole, or by ordinary low-mass X-ray binaries. The precise location of the X-ray emission might distinguish between these two scenarios. By refining the astrometry of the XMM-Newton and HST data, we reduced the XMM-Newton error circle to . Despite the smaller error circle, the precision is not sufficient to distinguish an intermediate-mass black hole and luminous low-mass X-ray binaries. This result, however, suggests that future Chandra observations may reveal the origin of the X-ray emission.
1 Introduction
Globular clusters are very efficient places to produce X-ray binaries via dynamical interactions. In particular, it has been known for many years that the formation rate per unit mass of luminous ( ) X-ray sources is much higher in globular clusters than that of the rest of our Galaxy. More recently, similar results are found in other nearby spiral galaxies like M31 (Di Stefano et al. 2002) and M104 (Di Stefano et al. 2003). Among all extragalactic globular clusters, G1 in M31 is an intriguing one. With a luminosity of (Rich et al. 1996), it is the most luminous star cluster in the Local Group, and also one of the most massive, at (Meylan et al. 2001). The rates at which X-ray binaries are created in the cluster core are therefore expected to be high compared with globular clusters in the Milky Way. Furthermore, it has been claimed, based on kinematic studies, that G1 hosts a intermediate-mass black hole (Gebhardt et al. 2002,2005). However, this result is controversial and has been challenged by Baumgardt et al. (2003). X-ray observations of G1 therefore allow us to investigate some of the interesting properties of the cluster.
Recently, XMM-Newton has conducted three short ( 10 ksec) observations of G1 and has discovered an X-ray source coincident with G1 (Trudolyubov & Priedhorsky 2004; Pooley & Rappaport 2006). To explain the origin of the X-ray emission of G1, Pooley & Rappaport (2006) proposed that it could be due to accretion of ionized cluster gas by a central intermediate-mass black hole or it could be produced by a conventional X-ray binary, and it is also possible to distinguish these two scenarios by obtaining a precise localization of the X-ray emission. If the X-ray emission is due to a central 20,000 black hole, we expect it comes from within 50 mas of the center. However, if low-mass X-ray binaries are responsible to the X-ray emission, then we expect the X-ray emission offsets from the core. This requires high-resolution X-ray observations. However, there is no Chandra observation of G1 and only XMM-Newton observations are available. Although Pooley & Rappaport (2006) investigated the XMM-Newton spectra of G1 in detail, they did not perform an astrometric study. The absolute astrometry of XMM-Newton is about (Kirsch 2006) while the statistical uncertainty is intensity dependent. This leads to a positional error of about depending on the source brightness. While the spatial resolution of XMM-Newton is much poorer than Chandra it is possible to localize X-ray positions to with XMM-Newton if one calibrates the astrometry carefully. In this paper, we refined the X-ray position of G1 by performing precise relative astrometry using XMM-Newton and the Hubble Space Telescope (HST).
2 Observations and Data Analysis
2.1 XMM-Newton
G1 was first observed with the XMM-Newton in 2001 January for a total exposure time of ksec. There were two more XMM-Newton observations in 2002 December and 2003 February. Both observations were off-axis resulting heavy vignetting and one of the observations was affected by high background [see Pooley & Rappaport (2006) for a summary]. In this Letter, we only consider the first observation taken in 2001. All three cameras (one pn camera and two MOS cameras) of the European Photon Imaging Camera (EPIC) were turned on for collecting data. All the X-ray data were processed with the XMM-Newton Science Analysis System (SAS) version 7.0.
We downloaded the raw data from the XMM-Newton archive and reprocessed with SAS together with the latest calibration products. The reprocessed event lists were first examined for background variation using the high energy (10–15 keV) background lightcurves and we did not find any significant background flaring event. We extracted X-ray images with photon energies in the range of 0.3–10 keV, and only considered events with FLAG = 0 and single and double events for the pn camera (PATTERN ), and single to quadruple events for the MOS cameras (PATTERN ). Source detection was then performed using a maximum likelihood approach as implemented by the SAS tools edetect_chain. We ran the source detection simultaneously on the data from all three cameras. G1 was clearly detected and was seen in all three cameras with a combined detection likelihood of 63. We compared the X-ray source list with the 2MASS and USNO catalogs and images, and looked for coincidence of bright and isolated stellar objects. We found one star (2MASS 00325251+3931424) that is from the X-ray position and it is likely to be a foreground star.
To verify the nature of this X-ray emitting stellar object, we computed the hardness ratios. These ratios were based on the source counts in the three energy bands: (0.3–1 keV), (1–2 keV), and (2-10 keV). The two hardness ratios are defined as HR1= and HR2=. Figure 1 shows the color-color diagram of the X-ray emitting foreground star and G1. We have overlaid the color-color diagram with lines showing the tracks followed by representative spectra with differing values of . The X-ray colors of the X-ray emitting star indicate that it has a very soft X-ray spectrum, consistent with a very soft X-ray source (Di Stefano & Kong 2004). The X-ray radiation is therefore likely due to the coronal emission from a foreground star. The star has a magnitude of 14.0 (Monet et al. 2003). We calculated the X-ray to optical flux ratio as (Hornschemeier et al. 2001). With a count rate of 0.018 c/s in the pn detector and assuming a Raymond-Smith model with keV and cm-2, the 0.3–10 keV flux is and the corresponding is 0.005, typical for a foreground star (Hornschemeier et al. 2001).
Based on the optical counterpart, the boresight correction that needs to be applied to the X-ray source positions is in R.A. and in decl.; the uncertainties are quadratic sum of the positional errors of the X-ray and 2MASS source. The correction is consistent with the absolute pointing accuracy of XMM-Newton (see also an example in Pietsch, Freyberg & Haberl 2005).

2.2 Hubble Space Telescope
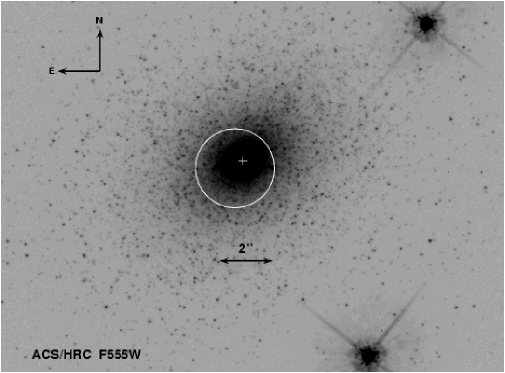
G1 was observed with the HST Advanced Camera for Surveys (ACS) in High Resolution Channel (HRC) mode on 2003 October 24. The total integration time is 41 minutes in the F555W filter centering on G1. We used the HST pipeline data that were shifted and co-added using the MultiDrizzle package in PyRAF, with masking of cosmic rays, saturated pixels, and bad pixels. We calibrated the astrometry of the HST data by using the 2MASS catalog. The field-of-view of the ACS/HRC is small () and only two stars in the field are in the 2MASS catalog. By computing the average offset between the HST and 2MASS stars, we shifted the HST image by in R.A. and in decl., with a residual of . The ACS/HRC image of G1 is shown in Figure 2.
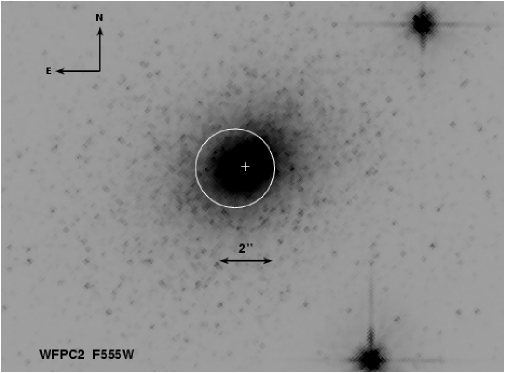
G1 was also observed with the HST Wide Field Planetary Camera 2 (WFPC2) on 1995 October 2 with a total integration time of 37 minutes in the F555W filter. In addition to the F555W data, images were also taken in the F814W and F1042M filters. We downloaded the F555W image from the WFPC2 Associations Science Products Pipeline for which cosmic-ray free, science-quality images are dithered and co-added. Since the field-of-view of WFPC2 is much larger than that of ACS/HRC, we can correct the astrometry with 6 stars in the 2MASS catalog. We applied the astrometry correction using IRAF task ccmap yielding a residual of . The WFPC2 F555W image is shown in Figure 2.
3 X-ray Localization of G1
After registering the absolute reference frames of the HST and XMM-Newton images to the 2MASS catalog, we located the center of G1 in the HST images and the X-ray position of G1. We determined the centroid of G1 in the ACS/HRC image (R.A.=00h32m46.537s, decl.=+39d34m40.65s with error of ) by computing the intensity weighted mean within the core radius (; Ma et al. 2007) using IRAF task center. We also checked the result by using the half-mass radius () and there is no difference except for a larger error bar (). For the X-ray position, we applied the astrometric correction on the value determined by edetect_chain yielding R.A.=00h32m46.6s, decl.=+39d34m40s. We then determined the radius error circle () of the XMM-Newton position of G1 by computing the quadratic sum of the positional uncertainty for the X-ray source (), the uncertainty in the optical astrometry (), and the uncertainty in the X-ray boresight correction (). The same procedure was also applied to the WFPC2 image. Figure 2 shows the ACS/HRC and WFPC2 images of G1 and the radius X-ray error circles. The center of G1 derived from the optical image is also marked.
4 Discussion
Using XMM-Newton and HST, we determined the centroid of G1 in the optical images as well as the X-ray position of G1. From Figure 2, although the X-ray position offsets from the cluster core, the cluster center is within the error circle of the X-ray position. Therefore, the current XMM-Newton data cannot provide constraint on whether the X-rays of G1 come from Bondi accretion of ionized cluster gas by a central intermediate-mass black hole for which the X-rays should come from the central 50 mas of the cluster (Pooley & Rappaport 2006). Alternatively, the X-ray emission could be produced by luminous low-mass X-ray binaries and we expect such X-ray emission may be outside the cluster center. Previous X-ray observations of globular clusters suggest that luminous ( ergs s-1) X-ray sources tend to locate within the core radius (Grindlay et al. 1984). Recent Chandra observations also show that nearly half of the quiescent low-mass X-ray binaries are found within the core radius (e.g., Grindlay et al. 2002; Pooley et al. 2002; Heinke et al. 2003,2006). Therefore, it is likely that a luminous low-mass X-ray binary would locate within the core radius (; Ma et al. 2007) of G1. The X-ray emission of G1 could also come from multiple low-mass X-ray binaries and we may be able to resolve G1 as an extended source with high spatial resolution instrument. Pooley & Rappaport (2006) estimated that about 75 low-mass X-ray binaries might be in G1. It is worth noting that only one globular cluster, M15, is known to host two luminous X-ray sources (White & Angelini 2001; Hannikainen et al. 2005). In conclusion, based on the current XMM-Newton data, we cannot distinguish the two possible mechanisms of generating the X-ray emission of G1.
While the X-ray position of G1 is the most crucial factor to determine its nature, Pooley & Rappaport (2006) also suggested that the X-ray spectrum may provide some hint. However, it has been proven that X-ray spectra of intermediate-mass black hole candidates consist of a class of different spectral shapes and in many cases, the spectra can be fit with several models and the estimated mass of the accreting black hole is model dependent (e.g. Stobbart et al. 2006; Gonçalves & Soria 2006). Some intermediate-mass black hole candidates also show X-ray spectral change at different luminosity states (Kong & Di Stefano 2005). These make interpretation based on X-ray spectra more difficult. Nevertheless, if we assume a simple accretion disk model for G1, following Pooley & Rappaport (2006), we would expect G1 has a 10 eV supersoft component (see Di Stefano & Kong 2003); any emission above 0.5 keV must come from additional components. From the color-color diagram (Figure 1), G1 has significant emission above 1 keV and indeed it is very similar to a typical X-ray binary in M31 with a simple power-law spectral model (Kong et al. 2002). Therefore, if G1 has a 10 eV supersoft spectrum, it must also have an additional hard component. Indeed, it would be a challenge for XMM-Newton and Chandra to detect such supersoft emission because an absorbed (Galactic value to the direction of M31; cm-2) 10 eV spectrum turns over at about 0.2 keV which is the sensitivity limit of these instruments. For instance, if the X-ray emission is dominated by a 10 eV spectrum, simulation shows that it requires 700 ksec XMM-Newton or 1 Msec Chandra observing time in order to detect the source. If the black hole of G1 is only 100 , the thermal emission would have a temperature of about 80 eV and we should be able to detect it with a 6 ksec XMM-Newton or 10 ksec Chandra observaiton. As a supersoft X-ray source ( eV), we do not expect to see X-rays above 1 keV which is not consistent with our current result. Alternatively, if the X-ray emission is from a luminous low-mass X-ray binary, we would also expect soft multi-color disk blackbody X-ray emission ( keV) in addition to a power-law like component associated with Comptonization of cooler photons (e.g. Sidoli et al. 2001). However, with only counts from all three XMM-Newton detectors, we do not have a good constraint on the spectral model. In conclusion, X-ray spectra provided by XMM-Newton and Chandra alone cannot provide convincing evidence for the nature of the X-ray emission from G1.
Although the X-ray position provided by XMM-Newton cannot provide any reasonable constraint to the nature of the X-ray emission of G1, it suggests that future Chandra observations may resolve the problem. As discussed in Pooley & Rappaport (2006), we can improve the relative astrometry of Chandra and HST to if we can match a few Chandra sources to their optical counterparts (e.g. foreground stars or background active galactic nuclei). With such observations, we can accurately localize the X-ray emission of G1. However, the fact that a luminous low-mass X-ray binary is likely to locate from the cluster core suggests that we may not disentangle from the emission of a possible intermediate-mass black hole. Alternatively, a Chandra observation may be able to distinguish between multiple X-ray sources as an extended object and point-like emission.
References
- (1)
- (2) Baumgardt, H., Makino, J., Hut, P., McMillan, S., & Portegies Zwart, S. 2003, ApJ, 589, L25
- (3)
- (4) Di Stefano, R., Kong, A. K. H., Garcia, M. R., Barmby, P., Greiner, J., Murray, S. S., & Primini, F. A. 2002, ApJ, 570, 618
- (5)
- (6) Di Stefano, R., Kong, A. K. H., VanDalfsen, M. L., Harris, W. E., Murray, S. S., & Delain, K. M. 2003, ApJ, 599, 1067
- (7)
- (8) Di Stefano, R., & Kong, A. K. H. 2004, ApJ, 609, 710
- (9)
- (10) Di Stefano, R., & Kong, A. K. H. 2003, ApJ, 592, 884
- (11)
- (12) Gebhardt, K., Rich, R. M., & Ho, L. C. 2002, ApJ, 578, L41
- (13)
- (14) Gebhardt, K., Rich, R. M., & Ho, L. C. 2005, ApJ, 634, 1093
- (15)
- (16) Gonçalves, A. C., & Soria, R. 2006, MNRAS, 371, 673
- (17)
- (18) Grindlay, J. E., Hertz, P., Steiner, J. E., Murray, S. S., & Lightman, A. P. 1984, ApJ, 282, L13
- (19)
- (20) Grindlay, J. E., Camilo, F., Heinke, C. O., Edmonds, P. D., Cohn, H., & Lugger, P. 2002, ApJ, 581, 470
- (21)
- (22) Hannikainen, D. C., Charles, P. A., van Zyl, L., Kong, A. K. H., Homer, L., Hakala, P., Naylor, T., & Davies, M. B. 2005, MNRAS, 357, 325
- (23)
- (24) Heinke, C. O., Grindlay, J. E., Edmonds, P. D., Lloyd, D. A., Murray, S. S., Cohn, H. N., & Lugger, P. M. 2003, ApJ, 598, 516
- (25)
- (26) Heinke, C. O., Wijnands, R., Cohn, H. N., Lugger, P. M., Grindlay, J. E., Pooley, D., & Lewin, W. H. G. 2006, ApJ, 651, 1098
- (27)
- (28) Hornschemeier, A. E., et al. 2001, ApJ, 554, 742
- (29)
- (30) Kirsch, M. 2006, XMM-EPIC status of calibration and data analysis, XMM-SOC-CAL-TN-0018, http://xmm.esac.esa.int/docs/documents/CAL-TN-0018.pdf
- (31)
- (32) Kong, A. K. H., Garcia, M. R., Primini, F. A., Murray, S. S., Di Stefano, R., & McClintock, J. E. 2002, ApJ, 577, 738
- (33)
- (34) Kong, A. K. H., & Di Stefano, R. 2005, ApJ, 632, L107
- (35)
- (36) Ma, J., de Grijs, R., Chen, D., van den Bergh, S., Fan, Z., Wu, Z., Wu, H., Zhou, X., & Wu, J. 2007, MNRAS, in press, astro-ph/0702012
- (37)
- (38) Meylan, G., Sarajedini, A., Jablonka, P., Djorgovski, S. G., Bridges, T., & Rich, R. M. 2001, AJ, 122, 830
- (39)
- (40) Monet, D. G., et al. 2003, AJ, 125, 984
- (41)
- (42) Pietsch, W., Freyberg, M., & Haberl, F. 2005, A&A, 434, 483
- (43)
- (44) Pooley, D., & Rappaport, S. 2006, ApJ, 644, L45
- (45)
- (46) Rich, R. M., Mighell, K. J., Freedman, W. L., & Neill, J. D. 1996, AJ, 111, 768
- (47)
- (48) Sidoli, L., Parmar, A. N., Oosterbroek, T., Stella, L., Verbunt, F., Masetti, N., & Dal Fiume, D. 2001, A&A, 368, 451
- (49)
- (50) Stobbart, A.-M., Roberts, T. P., & Wilms, J. 2006, MNRAS, 368, 397
- (51)
- (52) Trudolyubov, S., & Priedhorsky, W. 2004, ApJ, 616, 821
- (53)
- (54) White, N. E., & Angelini, L. 2001, ApJ, 561, L101
- (55)