Effects of Galaxy Formation on Thermodynamics of the Intracluster Medium
Abstract
We present detailed comparisons of the intracluster medium (ICM) in cosmological Eulerian cluster simulations with deep Chandra observations of nearby relaxed clusters. To assess the impact of galaxy formation, we compare two sets of simulations, one performed in the non-radiative regime and another with radiative cooling and several physical processes critical to various aspects of galaxy formation: star formation, metal enrichment and stellar feedback. We show that the observed ICM properties outside cluster cores are well-reproduced in the simulations that include cooling and star formation, while the non-radiative simulations predict an overall shape of the ICM profiles inconsistent with observations. In particular, we find that the ICM entropy in our runs with cooling is enhanced to the observed levels at radii as large as half of the virial radius. We also find that outside cluster cores entropy scaling with the mean ICM temperature in both simulations and Chandra observations is consistent with being self-similar within current error bars. We find that the pressure profiles of simulated clusters are also close to self-similar and exhibit little cluster-to-cluster scatter. We provide analytic fitting formulae for the pressure profiles of the simulated and observed clusters. The X-ray observable-mass relations for our simulated sample agree with the Chandra measurements to in normalization. We show that this systematic difference could be caused by the subsonic gas motions, unaccounted for in X-ray hydrostatic mass estimates. The much improved agreement of simulations and observations in the ICM profiles and scaling relations is encouraging and the existence of tight relations of X-ray observables, such as , and total cluster mass and the simple redshift evolution of these relations hold promise for the use of clusters as cosmological probes. However, the disagreement between the predicted and observed fractions of cluster baryons in stars remains a major puzzle.
Subject headings:
cosmology: theory–clusters: formation– methods: numerical1. Introduction
Clusters of galaxies are fascinating astrophysical objects and laboratories for studying galaxy formation and structure formation in general. At the same time, clusters can provide cosmological constraints that are complementary to those obtained with other methods such as temperature anisotropies of the cosmic microwave background, Type Ia supernovae, and weak lensing (e.g., Voit, 2005; Tozzi, 2006; Borgani, 2006; Albrecht et al., 2006). Cosmological applications of clusters include cluster counts and their evolution with redshift (e.g., Henry & Arnaud, 1991; Markevitch, 1998; Ikebe et al., 2002; Vikhlinin et al., 2003), spatial distribution (e.g., Miller et al., 2002), and the angular-diameter distance measurements (Allen et al., 2004; LaRoque et al., 2006). Detailed observations of merging clusters provide unique insights into the physics of the intracluster plasma (e.g., Vikhlinin et al., 2001a, b; Markevitch et al., 2003) and provide key evidence for the existence and properties of dark matter (Markevitch et al., 2004; Clowe et al., 2006).
All cosmological applications of clusters, at least to a certain degree, rely on solid understanding of the physics of their formation. Given that clusters are nonlinear collapsed systems, numerical cosmological simulations are the method of choice for their theoretical studies. Modern cosmological codes using -body and numerical hydrodynamics techniques can accurately follow dynamics of dark matter and gaseous baryonic components in their full complexity during the hierarchical build-up of structures. Yet, more realistic modeling of clusters requires inclusion of additional baryonic processes. For example, to model formation of cluster galaxies, we need, at the very least, to correctly treat energy dissipation due to radiative losses by baryons, and conversion of gas into stars. In addition, any feedback in the form of energy injection and metal enrichment from supernova winds (e.g., Metzler & Evrard, 1994; Valdarnini, 2003) and active galactic nuclei (Brüggen et al., 2005; Sijacki & Springel, 2006; Cattaneo & Teyssier, 2007), and injection of non-thermal cosmic rays at large-scale shocks accompanying cluster formation (Pfrommer et al., 2007) can alter the thermodynamics of the intracluster gas.
Although our understanding of details and relative importance of these processes is currently sketchy, the simulations with specific assumptions about them are highly predictive, which should make models falsifiable. In particular, by comparing observed cluster properties with the results of simulations that include various physical processes described above we can learn a great deal about these processes and their role in cluster formation.
Over the last two decades, such comparisons were used extensively to put constraints on the deviations of ICM thermodynamics from the simple self-similar behavior, described originally by Kaiser (1986, 1991). The first studies of the observed correlation of cluster X-ray luminosity, , and spectral temperature, , unambiguously showed that its slope is steeper than the slope predicted by the self-similar model (e.g., Edge & Stewart, 1991; Henry & Arnaud, 1991; White et al., 1997; Markevitch, 1998; Allen & Fabian, 1998; Arnaud & Evrard, 1999). In addition, the slope of the relation steepens for the lowest mass clusters (e.g., Helsdon & Ponman, 2000; Finoguenov et al., 2002, 2007). Deviations from self-similarity were shown to be the strongest in the cores of clusters (e.g., Markevitch, 1998; De Grandi & Molendi, 2002; Vikhlinin et al., 2006) and were widely interpreted as evidence for preheating of the intracluster gas by energy from supernovae and AGN feedback (e.g., David et al., 1991; Kaiser, 1991; Evrard & Henry, 1991; White, 1991; Wu et al., 2000; Bialek et al., 2001; Borgani et al., 2001, 2002; Nath & Roychowdhury, 2002).
Alternative explanation was proposed by Bryan (2000), who argued that cooling and condensation of the gas accompanying formation of cluster galaxies can reduce the ICM gas density and increase its temperature and entropy to the observed levels (see also Voit & Bryan, 2001; Voit et al., 2002). This explanation was borne out by cosmological simulations (Pearce et al., 2000; Muanwong et al., 2001; Valdarnini, 2002; Davé et al., 2002; Kay et al., 2004, 2007). However, the amount of gas that condenses out of the hot ICM in cosmological simulations due to cooling (e.g., Suginohara & Ostriker, 1998; Lewis et al., 2000; Pearce et al., 2000; Davé et al., 2002; Ettori et al., 2004) appears to be a factor of 2-3 too large compared to the observed stellar mass in clusters (Lin et al., 2003; Gonzalez et al., 2007). Thus, the X-ray measurements appear to be consistent with a large fraction of cooling gas, while the optical estimates of stellar mass indicate that this fraction is small.
Modern X-ray observations with Chandra and XMM-Newton allow us to study the ICM properties with unprecedented detail and accuracy. Their superb spatial resolution and sensitivity enable resolved, accurate X-ray brightness and temperature maps over a large fraction of the cluster virial radii. The X-ray measurements also enable accurate mass modeling of relaxed clusters with the assumption of hydrostatic equilibrium of the ICM in the cluster potential. These observations can therefore be used for detailed comparisons of both global cluster properties and their profiles with simulation results, which provide more stringent tests for the models of the ICM thermodynamics. In particular, such comparisons can shed some light on the apparently contradictory lines of evidence as to the efficiency of cooling in clusters described above.
To this end, in the present study we focus on the effects of radiative cooling and star formation on the observable properties of clusters and compare results of simulations in both non-radiative and radiative regimes with the current X-ray data. Namely, we use two sets of simulations started from the same initial conditions. Both sets treat collisionless dynamics of dark matter and hydrodynamics of diffuse gas with high-resolution using the adaptive mesh refinement technique. In the baseline set of cluster simulations, the gas is modeled in non-radiative regime and thus does not reach high densities and is not allowed to form stars. The second set of simulations includes several processes accompanying galaxy formation: gas cooling, star formation, metal enrichment and thermal feedback due to the supernovae. Comparison of the simulated profiles in these two sets of simulations to those of observed clusters allows us to gauge the role of galaxy formation in shaping properties of the ICM. As we show in § 4, the simulations that include galaxy formation processes provide a considerably better match to the observed ICM profiles outside cluster cores compared to the non-radiative simulations.
The paper is organized as follows. In § 2 we describe cosmological cluster simulations. The methods used to analyze the simulations and the brief description of observations used in our comparisons are given in § 2 and 3, respectively. We present results of comparison of the ICM density, temperature, entropy, and pressure profiles in § 4, and integrated quantities such as spectral X-ray gas temperature, gas mass, and pressure, in simulations and observations in § 5. We discuss our results and conclusions in § 6.
2. Cosmological Cluster Simulations
In this study, we analyze high-resolution cosmological simulations of 16 cluster-sized systems in the flat CDM model: , , , and , where the Hubble constant is defined as , and an is the power spectrum normalization on an Mpc scale. The simulations were done with the Adaptive Refinement Tree (ART) -bodygasdynamics code (Kravtsov, 1999; Kravtsov et al., 2002), an Eulerian code that uses adaptive refinement in space and time, and (non-adaptive) refinement in mass (Klypin et al., 2001) to reach the high dynamic range required to resolve cores of halos formed in self-consistent cosmological simulations. The same set of cluster simulations was used in our related recent studies (Kravtsov et al., 2006; Nagai et al., 2007), where additional details can be found. We provide a description of the simulation details here for completeness.
| Name | rel.unrel. | ||||||||
|---|---|---|---|---|---|---|---|---|---|
| (Mpc) | () | (keV)aa is the average temperature measured directly from the 3D ICM distribution in the simulations. | (keV)bbAverage temperatures measured in the shell of [0.15,1] from the mock Chandra analysis of simulated clusters viewed along three orthogonal projection axes (, , , from left to right). Note that the values of quoted here are different from those in Table 1 of Nagai et al. (2007), where erroneous values were presented. | (1/0)ccClassification of relaxed and unrelaxed clusters are indicated with 0 and 1, respectively, for the three projections. | |||||
| CL101 | 1.160 | 8.17 | 90.81 | 7.44 | 8.72 | 8.67 | 8.86 | 000 | |
| CL102 | 0.978 | 4.82 | 54.47 | 5.63 | 5.63 | 5.83 | 5.86 | 000 | |
| CL103 | 0.994 | 4.92 | 57.71 | 4.84 | 4.73 | 4.93 | 4.62 | 000 | |
| CL104 | 0.976 | 5.15 | 53.88 | 6.61 | 7.69 | 7.73 | 7.73 | 111 | |
| CL105 | 0.943 | 4.71 | 48.59 | 5.67 | 6.21 | 6.21 | 6.17 | 001 | |
| CL106 | 0.842 | 3.17 | 34.65 | 4.54 | 4.34 | 4.35 | 4.30 | 000 | |
| CL107 | 0.762 | 2.17 | 25.66 | 3.61 | 3.97 | 3.71 | 3.94 | 100 | |
| CL3 | 0.711 | 1.91 | 20.90 | 3.37 | 3.65 | 3.60 | 3.61 | 111 | |
| CL5 | 0.609 | 1.06 | 13.11 | 2.22 | 2.40 | 2.39 | 2.39 | 111 | |
| CL6 | 0.661 | 1.38 | 16.82 | 2.88 | 3.38 | 3.38 | 3.57 | 000 | |
| CL7 | 0.624 | 1.21 | 14.13 | 2.54 | 2.96 | 2.88 | 2.90 | 111 | |
| CL9 | 0.522 | 0.73 | 8.23 | 1.58 | 1.53 | 1.60 | 1.57 | 000 | |
| CL10 | 0.487 | 0.43 | 6.72 | 1.58 | 1.93 | 1.90 | 1.91 | 111 | |
| CL11 | 0.537 | 0.78 | 8.99 | 1.75 | 2.00 | 2.02 | 1.98 | 000 | |
| CL14 | 0.509 | 0.62 | 7.69 | 1.64 | 1.85 | 1.84 | 1.83 | 111 | |
| CL24 | 0.391 | 0.26 | 3.47 | 0.97 | 1.06 | 1.04 | 1.07 | 010 | |
The bodygasdynamics cluster simulations used in this analysis follow collisionless dynamics of dark matter and stars, gasdynamics and several physical processes critical to various aspects of galaxy formation: star formation, metal enrichment and thermal feedback due to Type II and Type Ia supernovae, self-consistent advection of metals, metallicity-dependent radiative cooling and UV heating due to cosmological ionizing background (Haardt & Madau, 1996). The cooling and heating rates take into account Compton heating and cooling of plasma, UV heating, and atomic and molecular cooling, and are tabulated for the temperature range K and a grid of metallicities, and UV intensities using the Cloudy code (ver. 96b4; Ferland et al., 1998). The Cloudy cooling and heating rates take into account metallicity of the gas, which is calculated self-consistently in the simulation, so that the local cooling rates depend on the local metallicity of the gas. Star formation in these simulations was done using the observationally-motivated recipe (e.g., Kennicutt, 1998): , with yrs. Stars are allowed to form in regions with temperature K and gas density . 111We have compared runs where star formation was allowed to proceed in regions different from our fiducial runs. We considered thresholds for star formation of , , , and . We find that thresholds affect the properties of the ICM at small radii, , but differences are negligible at the radii we consider in this study. The code also accounts for the stellar feedback on the surrounding gas, including injection of energy and heavy elements (metals) via stellar winds, supernovae, and secular mass loss. The details of star formation prescription and feedback are discussed in Kravtsov et al. (2005). Some potentially relevant physical processes, such as AGN bubbles, physical viscosity, magnetic field, and cosmic rays, are not included.
The adaptive mesh refinement technique is used to achieve high spatial resolution in order to follow the galaxy formation and evolution self-consistently in these simulations. The peak spatial resolution is and kpc, and the dark matter particle mass in the region around the cluster was and for CL 101–107 and CL 3–24, respectively. To test the effects of galaxy formation, we also repeated each cluster simulation with only the standard gasdynamics for the baryonic component, without radiative cooling or star formation. We will use labels “non-radiative” and “cooling+SF” (CSF) to refer to these two sets of runs, respectively.
In this work, we also use mock Chandra X-ray images and spectra of the simulated clusters to derive total mass, gas mass and temperature profiles, as well as integrated cluster properties, using the analysis procedures essentially identical to those used to analyze real Chandra observations, as described in Nagai et al. (2007). The average X-ray spectral temperature, , is obtained from a single-temperature fit to the spectrum integrated within , excluding the central region, . For each cluster, the mock data is created for three orthogonal projections along the , , and coordinate axes. In § 5.3 we use quantities derived from the mock observations to compare scaling relations exhibited by simulated clusters to observations.
Our simulated sample includes 16 clusters at and their most massive progenitors at . The properties of simulated clusters at are given in Table 1. The masses are reported at the radius enclosing overdensities with respect to the critical density at the redshift of the output. This choice of the outer radius is mainly motivated by the fact that clusters are more relaxed within compared to the outer regions (Evrard et al., 1996). We also use , , and which are approximately , , and times , respectively. Mean spectral temperatures are presented separately for the three orthogonal projections to show the variation due to projection effects, substructure, etc. Note that the values of quoted here are different from those in Table 1 of Nagai et al. (2007), where erroneous values were presented by mistake. In our analysis below we distinguish unrelaxed and relaxed clusters for a more consistent comparison with the observations. The classification is based on the overall morphology of the mock X-ray images, as discussed in Nagai et al. (2007). In Table 1 relaxed and unrelaxed clusters are indicated with 0 and 1 for the three orthogonal projections (, , from left to right).
3. Observational Cluster Sample
To test our simulation results against observations we use a set of accurate measurements of gas density, temperature, and total mass profiles for a sub-sample of 13 relaxed clusters at that was presented in Vikhlinin et al. (2005) and Vikhlinin et al. (2006). The clusters are selected on the basis of regular and relaxed morphology of their X-ray surface brightness images, although some of the systems show signs of AGN activity in their cores. Three of the low- clusters, including USGC S152 ( keV), A262 ( keV), and RXJ1159+5531 ( keV), are excluded from the comparisons that involve measurements of or normalization with because their values are very uncertain due to insufficient spatial coverage. In § 5.2, we include USGC S152 and RXJ1159+5531 for comparisons of the entropy scaling relations at , , and , and A262 at the first two radii, but not at . Since none of the measurements extends out to , we estimate using , which provides a robust and accurate estimate of for our CSF and non-radiative simulations as well as the XMM-Newton mass measurements Pointecouteau et al. (2005). The observations and analysis procedure used to extract ICM properties and profiles from the Chandra data are described in detail in Vikhlinin et al. (2005) and Vikhlinin (2006).
In our previous study (Nagai et al., 2007), we used the mock Chandra images and spectra of the simulated clusters to assess the accuracy of the X-ray measurements of galaxy cluster properties. Our results show that the X-ray analysis of Vikhlinin et al. (2006) provides very accurate reconstruction of the 3D gas density and temperature profiles for relaxed clusters. Therefore, we directly compare the profiles derived from Chandra analysis to the 3D profiles of simulated clusters. Note that masses and overdensity radii of the clusters in the Chandra sample were derived from the X-ray hydrostatic analysis. A bias in the estimated cluster mass may results in a slight underestimate of the estimated cluster virial radius by about a few percent for relaxed clusters (see also Nagai et al., 2007, for more details and discussions). We will show a such comparison in § 4.
At the same time, our tests show that X-ray analysis can result in a underestimate in the hydrostatic estimates of total cluster mass. The bias is due to the non-thermal pressure support from the sub-sonic turbulent motions of the ICM gas, ubiquitous in cluster simulations (Evrard, 1990; Norman & Bryan, 1999; Nagai et al., 2003; Rasia et al., 2004; Kay et al., 2004; Faltenbacher et al., 2005; Dolag et al., 2005; Rasia et al., 2006; Nagai et al., 2007), but not included in observational hydrostatic mass estimates. In § 5.3, we present the comparisons of the X-ray observable-mass relations of our simulated clusters to deep Chandra X-ray observations of nearby, relaxed clusters using both the true masses of clusters measured in simulations and the masses estimated from hydrostatic equilibrium analysis. We also correct for the differences in the assumed cosmological parameters in simulations ( and ) to those assumed in the observational analyses ( and ). We adopt and throughout this work. Note that and are assumed in both analyses.
In addition, we compare in § 5.2 the Chandra ICM entropy measurements with those based on the XMM-Newton observations of 10 clusters (Pratt et al., 2006) and the ROSAT+ASCA data for 64 clusters (Ponman et al., 2003). In these comparisons, we do not use measurements that involve extrapolation, so that we minimize biases arising from such procedure.
4. Effects of Galaxy Formation on the ICM Profiles
In this section we investigate the effects of galaxy formation on the ICM properties by comparing simulations performed with and without the processes associated with the galaxy formation: gas cooling, star formation, stellar feedback, and metal enrichment. Similar comparisons have been done for a subset of 11 clusters in Kravtsov et al. (2005) and Nagai (2006). Here, we use the extended sample of 16 clusters and analyze the sub-sample of six relaxed clusters that are identified as “relaxed” in all three orthogonal projections, indicated as 111 in the last column of the Table 1. In § 5, we compare the results of simulations to the Chandra X-ray observations of nearby relaxed clusters.
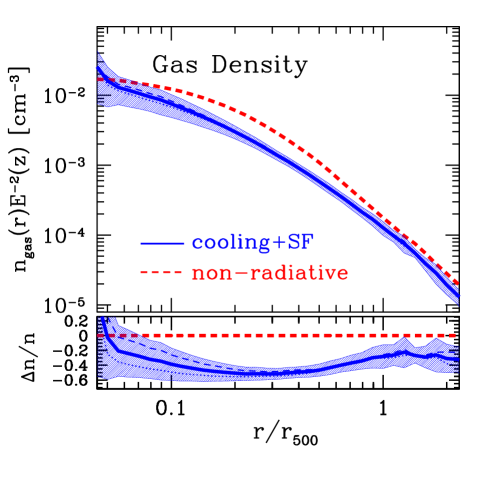
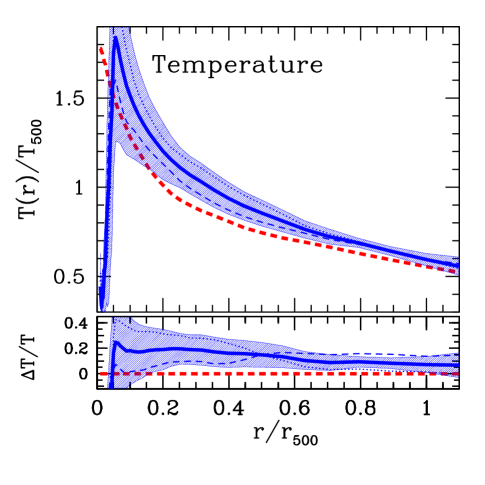
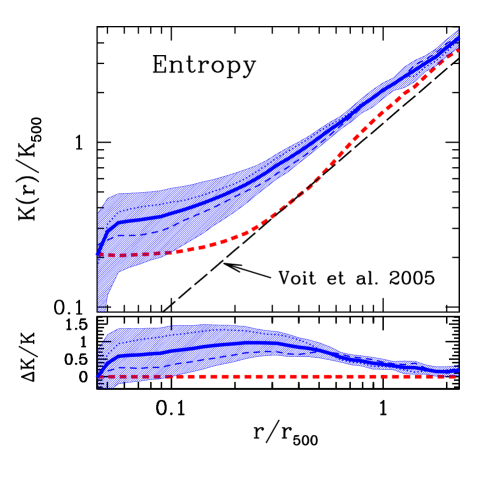
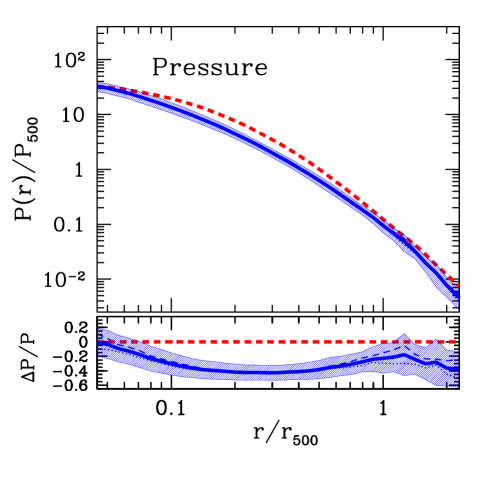
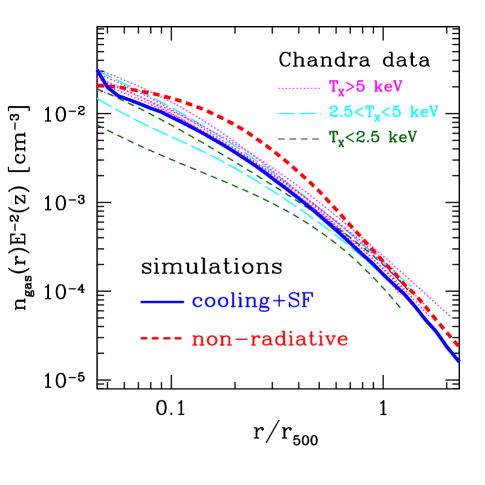
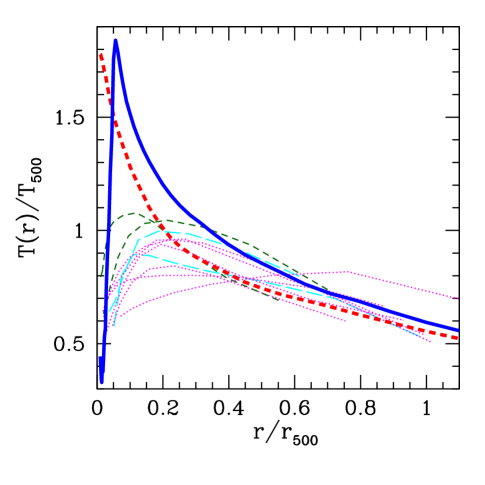
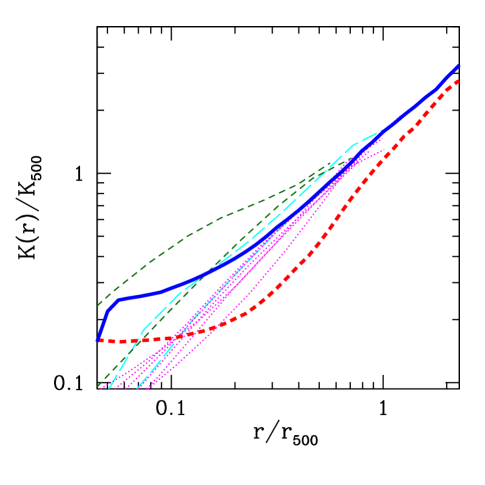
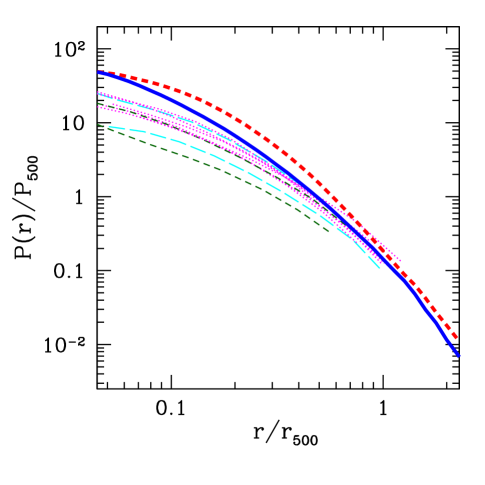
Figure 1 shows the average radial profiles of the ICM in relaxed clusters at in the CSF and non-radiative runs. Clockwise from the top-left panel, we show the gas density, temperature, pressure, and entropy profiles. The mean profiles are obtained by first normalizing the ICM profiles of each cluster at and then averaging over a sample of relaxed clusters. The shaded bands show rms scatter around the mean profile of the CSF runs, and the mean and scatter of the profiles are computed for a logarithm of each thermodynamic quantity. We also examine systems with 2.5 keV and 2.5 keV separately to study the mass dependence of the effects (and also the effects of cooling in the bremsstrahlung- and line emission-dominated regimes). In the bottom panel of each figure, we also show the fractional change of the ICM profiles in the CSF runs relative to the non-radiative runs.
The temperature, entropy (defined as ), and pressure profiles are normalized to the values computed for the given cluster mass using a simple self-similar model (Kaiser, 1986; Voit, 2005):
| (1) | |||||
| (2) | |||||
| (3) |
where is a total cluster mass enclosed within , for a flat universe with a cosmological constant assumed in our simulations. Numerical coefficients in equations (2) and (3) follow from the definitions and , where , is the critical density of the universe, is the mean baryon fraction in the Universe, is the mean molecular weight, and is the mean molecular weight per free electrons. Note that we use and throughout this work.
Figure 1 shows that including the gas cooling and star formation significantly modifies the ICM profiles throughout the cluster volume. The effect is larger in the inner region and for the systems with lower (or the cluster mass). Compared to the non-radiative runs, the gas density in the CSF runs is reduced by and at and , because a fraction of gas is converted into stars. At small radii, we observe a trend with cluster mass; for example, the suppression of the gas density in the CSF runs at is and 30% for systems with keV and keV, respectively. However, at (or ), our simulations show very little systematic trend with , indicating that the clusters become self-similar in the outskirts even when the cooling and star formation are turned on.
The ICM temperature profiles decline monotonically from outwards. The shape of the temperature profiles are similar between the non-radiative and CSF runs, but there is a clear offset in their normalization. The temperature in the CSF runs is systematically higher by 10%–20% outside the core, indicating that the net effect of gas cooling and star formation is to increase the ICM temperature. The effects of gas cooling and star formation on the ICM temperature show a stronger dependence on cluster mass than gas density.
The ICM entropy provides one of the most fundamental insights into physical processes determining the thermodynamics of the ICM, because it is expected to a be a conserved quantity, modified only by shock waves and “non-adiabatic” processes we are interested in (e.g., see Voit et al., 2002, 2005, and references therein). Figure 1 shows that the entropy profiles in our non-radiative simulations scale self-similarly and are well-described by a power law , at , in agreement with previous studies (Voit et al., 2005). Note, however, that there is a systematic discrepancy between the predictions of the Eulerian and SPH codes at small radii (Frenk et al., 1999; Ascasibar et al., 2003). However, since the primary focus of this paper is on the ICM properties outside the cluster core, we leave a detailed analysis of this entropy discrepancy for future work.
Using the average profile from the non-radiative simulations as a baseline, we study the effects of gas cooling and star formation on the ICM entropy. Compared to the non-radiative runs, the ICM entropy in the CSF runs is enhanced in the entire radial range of interest, even at the virial radius . This is because cooling leads to the condensation of the lowest entropy gas, which is replaced by the gas of higher entropy (Bryan, 2000; Voit & Bryan, 2001). The effect strongly depends on radius and is most pronounced in the inner regions with the largest effect of near . However, the entropy is enhanced by even at . The figure also shows that the magnitude of the effect in the inner regions depends on cluster mass, but is approximately the same for all masses at , indicating that cooling preserved self-similarity of the cluster outskirts.
Finally, pressure profiles exhibit the most remarkable degree of self-similarity and low-level of cluster-to-cluster scatter. Notice that the average pressure profiles of low and high- systems are nearly identical. This indicates that the self-similarity is best preserved for the quantities directly proportional to the ICM pressure or thermal energy, such as the integrated pressure (Nagai, 2006) and (Kravtsov et al., 2006). Note, however, that inclusion of gas cooling and star formation modifies the overall shape and normalization of the pressure profiles and hence the and parameters for the clusters of a fixed mass. In our simulations, the ICM pressure is suppressed by about 25% and 40% at and , respectively.
5. Comparisons with observations
In this section we present detailed comparisons of gas density, temperature, entropy, and pressure profiles in the simulated clusters and the Chandra observations of low- relaxed clusters (Vikhlinin et al., 2006). We also compare the scaling relations between , , the X-ray “pressure” (), and cluster total mass.
5.1. Profile comparison
Figure 2 compares the ICM profiles in simulations with those observed. For the simulated clusters, we plot the mean ICM profiles averaged over the samples of relaxed clusters in both non-radiative and CSF runs. They are compared to the Chandra X-ray measurements of 11 nearby relaxed clusters. The observed clusters with keV, keV, and keV are indicated with thin dotted, long-dashed, and short-dashed lines.
The comparisons show that the ICM profiles in the CSF simulations agree quite well with observations outside the cores of clusters (), while the non-radiative simulations predict overall shape and normalization of the ICM profiles inconsistent with observations at all radii. The observations indicate then that a significant amount of cooling and condensation of gas out of hot ICM phase has occurred in real clusters.
The ICM profiles in the inner regions, on the other hand, are not reproduced well in any of our simulations. The only exception is the profiles for keV clusters, where the CSF runs produce results consistent with observation down to . However, even for these clusters the discrepancies between simulations and observations are evident in the and profiles at . The shape of the entropy profiles is different in the inner region of the simulated and observed clusters. For example, the entropy profiles of the observed clusters monotonically decrease with decreasing radius, while simulated entropy profiles flatten substantially at .
Note that the ICM profiles of the keV Chandra clusters are systematically offset from the high- clusters in the inner regions and exhibit more pronounced cluster-to-cluster variations. The lowest- system, MKW4 ( keV), shows the most striking deviations from self-similarity. Our simulated clusters show similar trends, but the sample is too small to quantify the trends with and the scatter. Note also that, if we use the estimated of simulated clusters to compare with data, the simulation curves in Figure 2 could slide to the left, bringing the characteristic values plotted in Figures 3 and 4 down slightly (; see § 5.3 for more discussions).
| radius | quantity | cooling+SF | non-radiative | Chandra | XMM-Newton |
|---|---|---|---|---|---|
| radius | quantity | cooling+SF | Chandra | XMM-Newton |
|---|---|---|---|---|
5.2. Entropy scaling relations
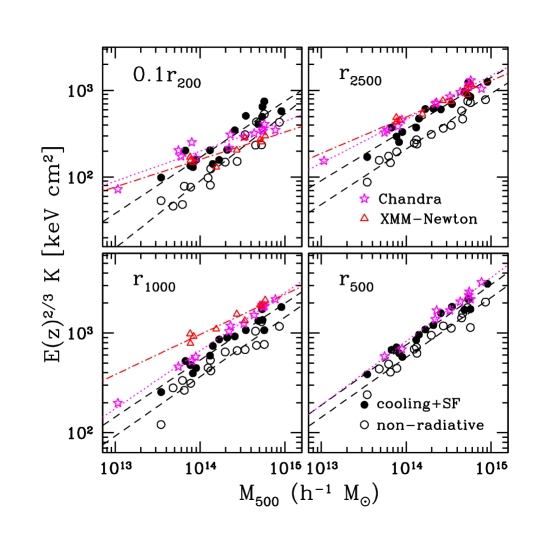
The scaling of the entropy with mass or of clusters provides one of the most powerful diagnostics of the effects of galaxy formation on the ICM and deviations from self-similarity (Evrard & Henry, 1991; Ponman et al., 1999; Voit & Bryan, 2001; Pratt et al., 2006). For the self-similar cluster model, the entropy at a fixed overdensity radius is expected to scale linearly with and with mass as (cf. eq. 1). In the discussion above we showed that entropy profiles of both observed and simulated clusters become approximately self-similar outside the cluster cores. In this section we explicitly consider the scaling of entropy with cluster mass and temperature at four different radii and compare the results of numerical simulations with X-ray measurements obtained using Chandra (Vikhlinin et al., 2006). We also compare the Chandra measurements with the XMM-Newton (Pratt et al., 2006) and ROSAT+ASCA (Ponman et al., 2003) results.
The entropy levels measured in the simulated clusters at , , , and are shown as a function of in Figure 3 (such a relation was first studied observationally by Pratt et al., 2006). The best-fit power law approximations of these data, , are given in Table 2 (the term corrects for evolution in the self-similar model, which needs to be applied to clusters observed at ). Clearly, in the simulated clusters, inclusion of gas cooling and star formation increases the entropy level, and the magnitude of the effect is larger in the inner region. The changes in the normalization for clusters is a factor of 1.71, 1.65, 1.41, and 1.34 at , , , and , respectively. The effects of cooling and star formation on the ICM entropy are thus stronger at small radii. The slopes are consistent with the prediction of the self-similar model () within 1 at all radii, in both CSF and non-radiative simulations. However, there are indications that the slopes are slightly shallower than the self-similar value, and the slope in the non-radiative run is somewhat steeper than that in the CSF at . A larger sample of simulated clusters is needed to determine whether these differences are real.
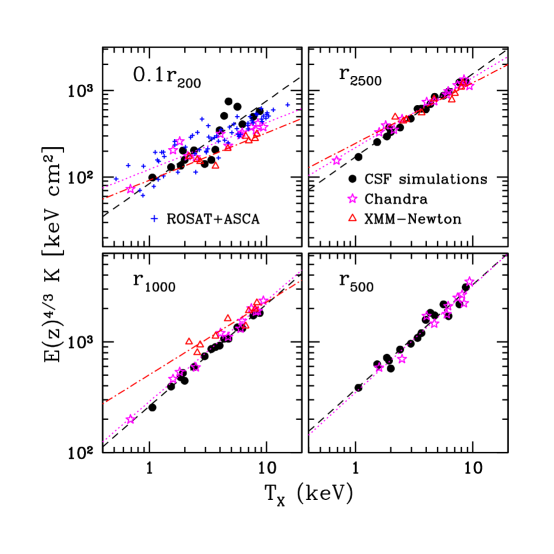
It is easier to compare the entropy levels in the simulated and observed clusters via the correlation. The results for our CSF runs are , , , and are shown in Figure 4. Table 3 lists the best-fit parameters of the power approximations, . As in the case of the relation, the power-law slopes in the CSF runs are slightly shallower than, but consistent with, the self-similar expectation () at all radii considered. Note also that the relations exhibit remarkably tight relations at for all clusters.
We also show in Figure 3 and 4 the and scalings derived from several sets of X-ray cluster observables. It is most straightforward to compare our simulations with the Chandra results of Vikhlinin et al. (2006) (shown by stars in Figures 3 and 4), because we explicitly tested their data analysis procedures (Nagai et al., 2007) and because the Chandra results for many clusters extend to . First, we note the entropy normalizations in the Chandra clusters show a good overall agreement with the CSF runs at all radii. The results for non-radiative runs are strongly inconsistent with the data (see also Ponman et al., 2003; Pratt et al., 2006).
At small radii, and , the observed clusters show significantly shallower slopes than expected in the self-similar model and seen in the simulations. For example, the slope of the relation at is for the simulated clusters, and for Chandra sample. These results are in line with the disagreement between the profiles of the simulated and observed clusters at small radii, discussed in § 5.1.
The agreement, however, improves quickly as we go to larger radii. At , the slopes of the relation are for simulated clusters and for the Chandra sample. At larger radii, and , the Chandra-observed relations are fully consistent with the CSF simulations both in terms of slope and normalization; the slopes are also very close to the self-similar expectations, and . These results confirm the general conclusion of § 5.1 that although effects of cooling on the entropy normalization are significant within radii as large as , the scaling of the thermodynamic properties of the ICM become close to the self-similar expectation outside the inner cluster region.
Also shown in Figure 3 and 4 are the entropy scaling relations derived from two more X-ray data sets, the XMM-Newton sample of Pratt et al. (2006) [triangles], and the ASCA+ROSAT sample of Ponman et al. (2003) [crosses at ]. At small radii, where the X-ray measurements are most straightforward, there is a good agreement between all observed relation. In particular, the XMM-Newton and Chandra relations for and are nearly identical. A small offset of the Ponman et al. (2003) data points can be explained by the slightly different definitions of used in these works222The quantity was defined in Ponman et al. (2003) through the Evrard et al. (1996) scaling with ; through the NFW fit to the data at smaller radii in Pratt et al. (2006); and through hydrostatic estimates of for the Chandra clusters..
At , the entropy normalizations for the most massive clusters are in agreement for the Chandra and XMM-Newton samples but there is some tension in the values of slope. The XMM-Newton results indicate nearly the same slopes at and smaller radii, all significantly flatter than the self-similar prediction: , , and for , , and , respectively. The Chandra results clearly indicate a significantly steeper slope at this radius, ; a steep slope, is also observed at . The statistical significance of the difference between the Chandra and XMM-Newton slopes is for the and for the relations. The best-fit values of indicate qualitatively different cluster properties. While the XMM-Newton results suggest that the departures from self-similar scalings are of the similar amplitude at all radii, the Chandra measurements clearly point in the direction that the effect is confined to the very central regions.
A detailed comparison of the XMM-Newton and Chandra data analyses is beyond the scope of this work. We only point out two effects that may contribute to the difference in the entropy scalings. First, the Chandra temperature profiles show a systematic decline at large radii (by a factor of at relative to peak values near ), the XMM-Newton temperature profiles in the Pratt et al. (2006) sample are much flatter. This systematic difference is discussed in Vikhlinin et al. (2005). Second, the gas densities in the Chandra analysis were derived using a model that allows for steepening of the profile at large radii. The XMM-Newton data were fit with the -type models that do not allow for such steepening (Pointecouteau et al., 2005). This leads to somewhat different gas density profiles at large radii (see, e.g., Appendix A2 in Vikhlinin et al., 2006).
5.3. Relations between Total Mass and X-ray Observables
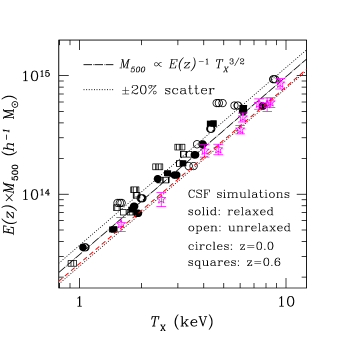
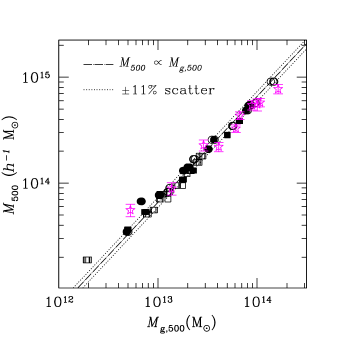
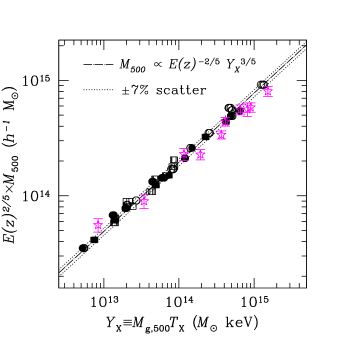
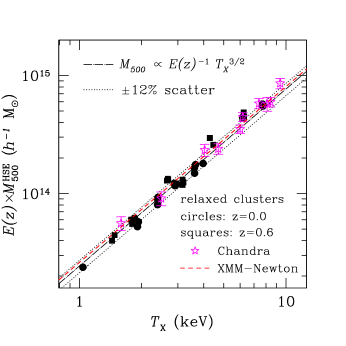
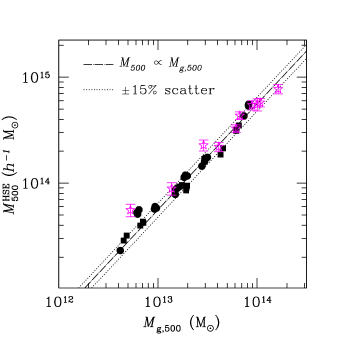
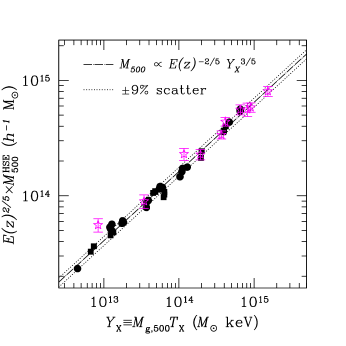
We present comparisons of the X-ray observable-mass relations of the CSF simulations and Chandra X-ray observations of nearby relaxed clusters in Figure 5. Following Kravtsov et al. (2006), we consider three X-ray proxies for the cluster mass: — the spectral temperature (), the gas mass (), and the X-ray pressure (). These X-ray mass proxies are derived from mock Chandra images of the simulated clusters and analyzing them using a model and procedure essentially identical to those used in real data analysis. Note that the mean temperatures were estimated from a single-temperature to the spectrum integrated in the radial range (i.e., excluding emission from cluster core).
In the upper panels of Figure 5, we compare the scaling relations of simulated clusters for the true cluster mass, , measured in simulations to the relations from the Chandra X-ray cluster observations. We also plot the best-fit relation from the XMM-Newton measurements (Arnaud et al., 2005) for comparison. Results of power law fits to these relations for different subsets of the clusters are presented in Table 2 of Kravtsov et al. (2006).333Note that is in units of in this work, while it is in Kravtsov et al. (2006). The comparisons show that the normalizations of the scaling relations involving true for our simulated sample are systematically high by compared to the observed relations. We note that this level of agreement is considerably better than agreement between simulations and data as recently as several years ago (e.g., Pierpaoli et al., 2001).
The remaining bias could arise from the assumption of the hydrostatic equilibrium, which is a key assumption that enables measurements of gravitationally bound mass of clusters from the X-ray and Sunyaev-Zel’dovich (SZ) effect data. To illustrate this, we compare the scaling relations based on the estimated hydrostatic mass () derived from the mock Chandra analysis of simulated clusters to the Chandra measurements in the lower panels of Figure 5. Note that we account for additional biases in the estimated cluster masses arising from a bias in the estimation of a cluster virial radius by measuring the cluster mass within the estimated from the hydrostatic analysis (see also Nagai et al., 2007, for more details and discussions). Similarly, the gas mass () is also computed at and in the upper and lower panels.444Note that is computed within in both panels; however, correcting for the bias in has a negligible () effect on the estimate. In Table 4, we summarize results for the relaxed clusters at z=0, relevant for comparison with observations considered here. These analyses show that the simulation results are in much better agreement with observations when using the hydrostatic mass. The systematic offset in normalizations could thus be due to the bias of total hydrostatic mass estimate due to turbulent motions of the ICM.
In terms of scatter, the relation exhibits the largest scatter of in around the mean relation, most of which is due to unrelaxed clusters. The unrelaxed clusters also have temperatures biased low for a given mass, likely because the mass of the system has already increased but only a fraction of the kinetic energy of merging systems is converted into the thermal energy of gas, due to incomplete relaxation during mergers (Mathiesen & Evrard, 2001). Unfortunately, we cannot compare the scatter directly to the Chandra results because for real clusters, the scatter is dominated by the measurement uncertainties and the intrinsic scatter (see discussion in Vikhlinin et al., 2006). The slope and redshift evolution of the relations are quite close to the simple self-similar expectation. The relation has a somewhat smaller scatter () around the best-fit power-law relation than the , but its slope is significantly different from the self-similar prediction for the relation due to the trend of gas fraction with cluster mass present for both the simulated clusters in our sample (see Kravtsov et al., 2005) and for the observed clusters (Vikhlinin et al., 2006). In all of the scaling relations considered here, the use of , instead of , modifies the scatter by a few percent for the relaxed clusters.
The relation shows the scatter of only , making it by far the tightest of all the scaling relations. Note that this value of scatter includes clusters at both low and high-redshifts and both relaxed and unrelaxed systems. The tightness of the relation and simple evolution are due to a fortunate cancellation of opposite trends in gas mass and temperature (see Kravtsov et al., 2006). The slope and redshift evolution of normalization for the relations are well-described by the simple self-similar model.
| relationaaPower law fits were performed for relaxed clusters of our cluster sample at and . In addition to the fits in which both normalization and slope of the power-law relations were fit simultaneously, we provide the best fit normalizations, , for each relation when fit with the slopes fixed to their self-similar values: , , and for the , , and relations, respectively. | quantitybbFor each observable (, , ), we fit power law relation of the form , with keV, , and keV , for , , , respectively. Note that is in units of . | (True) | (HSE) | (Chandra) |
|---|---|---|---|---|
| scatter | 0.136 | 0.117 | ||
| scatter | 0.114 | 0.153 | ||
| scatter | 0.053 | 0.087 | ||
6. Discussion and conclusions
We presented analyses of the simulated cluster sample of 16 clusters spanning a representative mass range () and modeled using the shock-capturing Eulerian adaptive mesh refinement -body+gasdynamics ART code in the CDM cosmology. These simulations achieve high spatial resolution and include various physical processes of galaxy formation, including radiative cooling, star formation and other processes accompanying galaxy formation. We study the effects of gas cooling and star formation on the ICM properties by comparing two sets of simulations performed with and without these processes included. The results of simulations with dissipation are compared to recent Chandra X-ray observations of nearby, relaxed clusters (Vikhlinin et al., 2005, 2006).
We show that gas cooling and star formation modify both the normalization and the shape of the gas density, temperature, entropy, and pressure profiles. As the lowest-entropy gas cools and condenses out of the hot phase in the cluster progenitors, the gas density in their inner regions is lowered and entropy is increased (Bryan, 2000; Voit & Bryan, 2001). The effects have strong radial dependence and are the strongest in the inner regions . At these inner radii simulation profiles do not match the observations. On the other hand, at the profiles in the CSF simulations and observations agree quite well, while profiles in the non-radiative runs disagree with observations at all radii within .
In particular, the simulations with cooling can explain the observed high levels of entropy in observed clusters compared to the non-radiative expectation pointed out previously (Ponman et al., 2003; Pratt et al., 2006). At the cluster profiles are approximately self-similar within current statistical error bars, while there is an indication that their best-fit slopes are slightly shallower than the self-similar value. Moreover, the slope and normalization of the entropy scaling relations in the simulated clusters are in good agreement with Chandra observations at and , while the observed relations exhibits deviations from the self-similarity at . Note also that the results of Chandra and XMM-Newton measurements agree quite well within , but the significant disagreement is seen at . The statistical significance of the difference between the Chandra and XMM-Newton slopes is for the and for the relations. The difference is critical for theoretical interpretation and implications, as the XMM-Newton scaling was billed as a major evidence for deviations from self-similar scalings at large radii (indeed at , where XMM-Newton measurements is several sigma away from the slope of 1.0). Chandra results show that deviations at larger radii, if they exist, are much smaller. Despite the deviations from self-similarity in the ICM entropies, we show that pressure profiles in particular, show a remarkable degree of self-similarity and exhibit very small scatter.
We also present comparisons of scaling relations of cluster X-ray observables with total cluster mass in the simulations with cooling and recent deep Chandra observations. Specifically, we compare correlation of the spectral X-ray temperature, ICM gas mass (), and the X-ray equivalent of integrated pressure (). In these comparisons X-ray observables for the simulated clusters are derived from mock Chandra analysis using procedure essentially identical to those used in real data analysis.
The slope and normalization of the and relations in simulations and Chandra observations are in good agreement, and they are consistent with the simple self-similar expectation. In terms of scatter, the relation shows scatter of only , making it by far the tightest of all the scaling relations. Note that this value of scatter includes clusters at both low and high redshifts and both relaxed and unrelaxed systems. The relation, on the other hand, exhibits the largest scatter of scatter in around the mean relation, most of which is due to unrelaxed clusters. The unrelaxed clusters also have temperatures biased low for a given mass, likely because the mass of the system has already increased but only a fraction of the kinetic energy of merging systems is converted into the thermal energy of gas, due to incomplete relaxation (Mathiesen & Evrard, 2001) during mergers.
Moreover, these comparisons show that the normalizations of the scaling relations of relaxed clusters in simulations and observations agree at a level of about . This is a considerable improvement, given that significant disagreement existed just several years ago (see Finoguenov et al., 2001; Seljak, 2002; Pierpaoli et al., 2003). The residual systematic offset in the normalization is likely caused by non-thermal pressure support from subsonic turbulent gas motions (Evrard et al., 1996; Rasia et al., 2004, 2006; Faltenbacher et al., 2005; Dolag et al., 2005, E. Lau et al. 2007, in preparation). This contribution is approximately independent of cluster mass (Vazza et al., 2006, E. Lau et al. 2007, in preparation) and is not accounted for in X-ray hydrostatic mass estimates. For example, when we repeat the comparison of scaling relations using hydrostatic mass estimates for the observed clusters, we find excellent agreement in normalizations, demonstrating explicitly that there is a systematic offset between hydrostatic mass estimate and the true mass in simulated clusters.
Part of the non-thermal pressure support may also be contributed by cosmic-rays and magnetic fields. In practice, it may be difficult to distinguish between different sources of non-thermal pressure. A possible test is their radial dependence. Turbulent motions, for example, are in general smaller at smaller radii and the turbulent pressure gradient is correspondingly smaller. In the case of turbulent motions, we can therefore expect that the bias in the total mass estimate should decrease at smaller radii. This may not be the case for some other sources of non-thermal pressure, although recent models of cosmic-rays contribution to the total pressure show a qualitatively similar radial dependence as the turbulent pressure (Pfrommer et al., 2007).
The much improved agreement of the scaling relations and, especially, normalization and shape of the gas profiles between simulations with cooling and star formation and observations show that inclusion of galaxy formation in cluster simulations results in more realistic modeling of the hot ICM. This may indicate that gravitational dynamics and the basic cooling of the hot gas accompanying galaxy formation are the dominant processes determining thermodynamics of the ICM outside the cluster cores, while other processes, such as feedback, thermal conduction, viscosity, and cosmic-rays, are playing only a minor role for a large fraction of the ICM mass.
Note, however, that the agreement between our simulations and observations is achieved by condensation of a significant fraction of hot gas into cold dense phase, which is subsequently converted into stars. Thus, simulated clusters have of their baryons within in stellar form at , while the rest of the baryons are in the hot phase. Although the low hot gas mass fractions ( of the universal value) are consistent with observations (Vikhlinin et al., 2006; McCarthy et al., 2007), the high stellar fractions are not. Note, however, that the reduced stellar fraction with more efficient stellar or AGN energy feedback generally results in the profiles that are in between those of the CSF and non-radiative runs and disrupts the good agreement between models and data.
Observational estimates of the stellar mass fractions in groups and clusters range from (Eke et al., 2005) to (Lin et al., 2003; Gonzalez et al., 2007) of the universal baryon fraction or at least a factor of 2-3 lower than the fractions found in our simulations. This is a well-known discrepancy often referred to as the “overcooling problem”. Our results show that the X-ray and optical observations appear to give seemingly contradicting constraints. The low observed stellar fractions imply existence of an efficient mechanism suppressing star formation in real clusters, while observed properties of hot ICM are not consistent with small amounts of cooling (i.e., predictions close to the non-radiative limit). At present it is not clear how these two observational constraints can be reconciled.
Our tests indicate that profiles and average quantities (i.e., gas fractions) derived from analyses of modern X-ray data are robust and do not suffer any obvious biases (Nagai et al., 2007). On the other hand, there are certain systematic uncertainties in estimates of stellar mass from optical observations related both to possible low-surface stellar component missed in shallow observations (e.g., Gonzalez et al., 2005, 2007; Lauer et al., 2007; Seigar et al., 2007) and to the uncertainties in the stellar population modeling of the observed photometry. It is unlikely, however, that any single uncertainty is large enough to account for the entire factor of 2-3 discrepancy between stellar fractions in simulations and observations. We note also that stellar fraction predicted by simulations depends on the implementation of the feedback processes in simulations (e.g., Borgani et al., 2006). However, the current implementations of the feedback processes efficient in significantly suppressing stellar fraction are essentially ad hoc and it is uncertain whether the feedback is actually as efficient in practice.
The progress in our understanding of these issues should come from detailed convergence studies and comparisons of simulation results done using different numerical codes, further comparisons of simulations with deep X-ray observations, deeper observations, and thorough analysis of uncertainties in the optical estimates of cluster stellar masses.
Appendix A Analytic pressure model
The Sunyaev-Zel’dovich (SZ) effect is a direct probe of thermal energy content of the Universe and provides a unique and powerful probe of the structure formation and cosmology in the near future. The SZ observations are probing the integrated pressure of the ICM. Accurate analytic parameterizations of the ICM pressure profiles can therefore be useful for developing efficient cluster detection algorithm for upcoming SZ cluster surveys, analysis and interpretation of SZ effect observations, as well as theoretical modeling of cluster ICM. The fact that the self-similarity is best preserved for the pressure profiles and their low cluster-to-cluster scatter (see § 4) provides further motivation for the use of accurate pressure profile parameterizations.
Here we present a simple analytic model of the pressure profile that closely matches the observed profiles of the Chandra X-ray clusters and results of numerical simulations in their outskirts. Since the gas pressure distribution is primarily determined by the gravitationally dominant dark matter component, we parameterize the pressure profile using the generalized NFW model,
| (A1) |
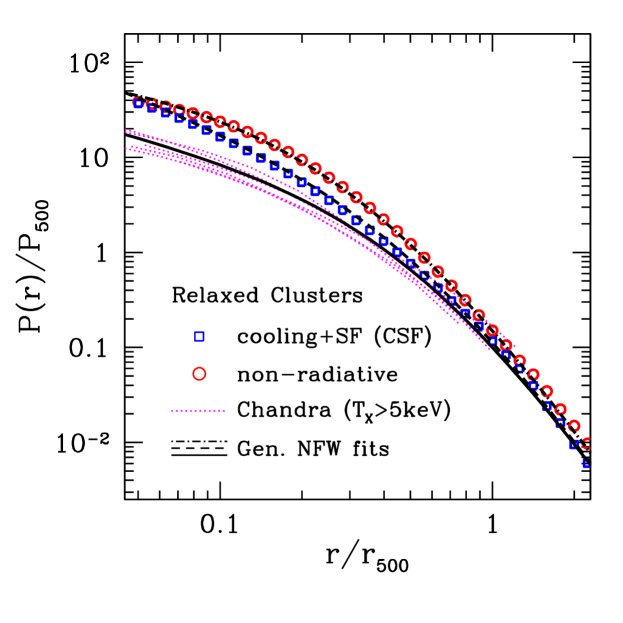
where , , is given by equation 3, and are the slopes at , , and , respectively. We find that a model with =3.3, =1.8, and provides a good description of the pressure profiles of the high- Chandra clusters within the observed range () as well as the profiles of simulated clusters in . Figure 6 shows generalized NFW fits to the pressure profiles of relaxed clusters in simulations and Chandra observations. In the outskirts, we set the slope to be , which is the average best-fit values for both non-radiative and CSF simulations. For the Chandra clusters with keV, the inner slopes of the pressure profile are . The inner slopes appear to be shallower for the lower- systems, but they also show much larger cluster-to-cluster variation. Table 5 summarizes the best-fit model parameters for observed and simulated clusters. For the relaxed systems, the same set of parameters with a different inner slope produces the pressure profile of the CSF run, while that of the non-radiative run requires a very different set of parameters. The pressure profiles of the unrelaxed systems are generally less concentrated (smaller value of ) with slightly different inner and outer slopes.
| Runs | Sample | |||
|---|---|---|---|---|
| Chandra Obs. | Relaxed | |||
| Cooling+SF | Relaxed | |||
| Cooling+SF | Unrelaxed | |||
| Non-radiative | Relaxed | |||
| Non-radiative | Unrelaxed |
References
- Albrecht et al. (2006) Albrecht, A., Bernstein, G., Cahn, R., Freedman, W. L., Hewitt, J., Hu, W., Huth, J., Kamionkowski, M., Kolb, E. W., Knox, L., Mather, J. C., Staggs, S., & Suntzeff, N. B. 2006, astro-ph/0609591
- Allen & Fabian (1998) Allen, S. W. & Fabian, A. C. 1998, MNRAS, 297, L57
- Allen et al. (2004) Allen, S. W., Schmidt, R. W., Ebeling, H., Fabian, A. C., & van Speybroeck, L. 2004, MNRAS, 353, 457
- Arnaud & Evrard (1999) Arnaud, M. & Evrard, A. E. 1999, MNRAS, 305, 631
- Arnaud et al. (2005) Arnaud, M., Pointecouteau, E., & Pratt, G. W. 2005, A&A, 441, 893
- Ascasibar et al. (2003) Ascasibar, Y., Yepes, G., Müller, V., & Gottlöber, S. 2003, MNRAS, 346, 731
- Bialek et al. (2001) Bialek, J. J., Evrard, A. E., & Mohr, J. J. 2001, ApJ, 555, 597
- Borgani (2006) Borgani, S. 2006, Lectures for 2005 Guillermo Haro Summer School on Clusters, to appear in ”Lecture notes in Physics” (astro-ph/0605575)
- Borgani et al. (2006) Borgani, S., Dolag, K., Murante, G., Cheng, L.-M., Springel, V., Diaferio, A., Moscardini, L., Tormen, G., Tornatore, L., & Tozzi, P. 2006, MNRAS, 367, 1641
- Borgani et al. (2001) Borgani, S., Governato, F., Wadsley, J., Menci, N., Tozzi, P., Lake, G., Quinn, T., & Stadel, J. 2001, ApJ, 559, L71
- Borgani et al. (2002) Borgani, S., Governato, F., Wadsley, J., Menci, N., Tozzi, P., Quinn, T., Stadel, J., & Lake, G. 2002, MNRAS, 336, 409
- Brüggen et al. (2005) Brüggen, M., Ruszkowski, M., & Hallman, E. 2005, ApJ, 630, 740
- Bryan (2000) Bryan, G. L. 2000, ApJ, 544, L1
- Cattaneo & Teyssier (2007) Cattaneo, A. & Teyssier, R. 2007, MNRAS, 376, 1547
- Clowe et al. (2006) Clowe, D., Bradač, M., Gonzalez, A. H., Markevitch, M., Randall, S. W., Jones, C., & Zaritsky, D. 2006, ApJ, 648, L109
- Davé et al. (2002) Davé, R., Katz, N., & Weinberg, D. H. 2002, ApJ, 579, 23
- David et al. (1991) David, L. P., Forman, W., & Jones, C. 1991, ApJ, 380, 39
- De Grandi & Molendi (2002) De Grandi, S. & Molendi, S. 2002, ApJ, 567, 163
- Dolag et al. (2005) Dolag, K., Vazza, F., Brunetti, G., & Tormen, G. 2005, MNRAS, 364, 753
- Edge & Stewart (1991) Edge, A. C. & Stewart, G. C. 1991, MNRAS, 252, 414
- Eke et al. (2005) Eke, V. R., Baugh, C. M., Cole, S., Frenk, C. S., King, H. M., & Peacock, J. A. 2005, MNRAS, 362, 1233
- Ettori et al. (2004) Ettori, S., Borgani, S., Moscardini, L., Murante, G., Tozzi, P., Diaferio, A., Dolag, K., Springel, V., Tormen, G., & Tornatore, L. 2004, MNRAS, 354, 111
- Evrard (1990) Evrard, A. E. 1990, ApJ, 363, 349
- Evrard & Henry (1991) Evrard, A. E. & Henry, J. P. 1991, ApJ, 383, 95
- Evrard et al. (1996) Evrard, A. E., Metzler, C. A., & Navarro, J. F. 1996, ApJ, 469, 494
- Faltenbacher et al. (2005) Faltenbacher, A., Kravtsov, A. V., Nagai, D., & Gottlöber, S. 2005, MNRAS, 358, 139
- Ferland et al. (1998) Ferland, G. J., Korista, K. T., Verner, D. A., Ferguson, J. W., Kingdon, J. B., & Verner, E. M. 1998, PASP, 110, 761
- Finoguenov et al. (2002) Finoguenov, A., Jones, C., Böhringer, H., & Ponman, T. J. 2002, ApJ, 578, 74
- Finoguenov et al. (2007) Finoguenov, A., Ponman, T. J., Osmond, J. P. F., & Zimer, M. 2007, MNRAS, 374, 737
- Finoguenov et al. (2001) Finoguenov, A., Reiprich, T. H., & Böhringer, H. 2001, A&A, 368, 749
- Frenk et al. (1999) Frenk, C. S., White, S. D. M., Bode, P., Bond, J. R., Bryan, G. L., Cen, R., Couchman, H. M. P., Evrard, A. E., Gnedin, N., Jenkins, A., Khokhlov, A. M., Klypin, A., Navarro, J. F., Norman, M. L., Ostriker, J. P., Owen, J. M., Pearce, F. R., Pen, U.-L., Steinmetz, M., Thomas, P. A., Villumsen, J. V., Wadsley, J. W., Warren, M. S., Xu, G., & Yepes, G. 1999, ApJ, 525, 554
- Gonzalez et al. (2007) Gonzalez, A., Zaritsky, D., & Zabludoff, A. I. 2007, ApJ in press (astro-ph/0705.1726)
- Gonzalez et al. (2005) Gonzalez, A. H., Zabludoff, A. I., & Zaritsky, D. 2005, ApJ, 618, 195
- Haardt & Madau (1996) Haardt, F. & Madau, P. 1996, ApJ, 461, 20
- Helsdon & Ponman (2000) Helsdon, S. F. & Ponman, T. J. 2000, MNRAS, 319, 933
- Henry & Arnaud (1991) Henry, J. P. & Arnaud, K. A. 1991, ApJ, 372, 410
- Ikebe et al. (2002) Ikebe, Y., Reiprich, T. H., Böhringer, H., Tanaka, Y., & Kitayama, T. 2002, A&A, 383, 773
- Kaiser (1986) Kaiser, N. 1986, MNRAS, 222, 323
- Kaiser (1991) —. 1991, ApJ, 383, 104
- Kay et al. (2007) Kay, S. T., da Silva, A. C., Aghanim, N., Blanchard, A., Liddle, A. R., Puget, J.-L., Sadat, R., & Thomas, P. A. 2007, MNRAS, 377, 317
- Kay et al. (2004) Kay, S. T., Thomas, P. A., Jenkins, A., & Pearce, F. R. 2004, MNRAS, 355, 1091
- Kennicutt (1998) Kennicutt, R. C. 1998, ApJ, 498, 541
- Klypin et al. (2001) Klypin, A., Kravtsov, A. V., Bullock, J. S., & Primack, J. R. 2001, ApJ, 554, 903
- Kravtsov (1999) Kravtsov, A. V. 1999, PhD thesis, New Mexico State University
- Kravtsov et al. (2002) Kravtsov, A. V., Klypin, A., & Hoffman, Y. 2002, ApJ, 571, 563
- Kravtsov et al. (2005) Kravtsov, A. V., Nagai, D., & Vikhlinin, A. A. 2005, ApJ, 625, 588
- Kravtsov et al. (2006) Kravtsov, A. V., Vikhlinin, A., & Nagai, D. 2006, ApJ, 650, 128
- LaRoque et al. (2006) LaRoque, S. J., Bonamente, M., Carlstrom, J. E., Joy, M. K., Nagai, D., Reese, E. D., & Dawson, K. S. 2006, ApJ, 652, 917
- Lauer et al. (2007) Lauer, T. R., Faber, S. M., Richstone, D., Gebhardt, K., Tremaine, S., Postman, M., Dressler, A., Aller, M. C., Filippenko, A. V., Green, R., Ho, L. C., Kormendy, J., Magorrian, J., & Pinkney, J. 2007, ApJ, 662, 808
- Lewis et al. (2000) Lewis, G. F., Babul, A., Katz, N., Quinn, T., Hernquist, L., & Weinberg, D. H. 2000, ApJ, 536, 623
- Lin et al. (2003) Lin, Y.-T., Mohr, J. J., & Stanford, S. A. 2003, ApJ, 591, 749
- Markevitch (1998) Markevitch, M. 1998, ApJ, 504, 27
- Markevitch et al. (2004) Markevitch, M., Gonzalez, A. H., Clowe, D., Vikhlinin, A., Forman, W., Jones, C., Murray, S., & Tucker, W. 2004, ApJ, 606, 819
- Markevitch et al. (2003) Markevitch, M., Mazzotta, P., Vikhlinin, A., Burke, D., Butt, Y., David, L., Donnelly, H., Forman, W. R., Harris, D., Kim, D.-W., Virani, S., & Vrtilek, J. 2003, ApJ, 586, L19
- Mathiesen & Evrard (2001) Mathiesen, B. F. & Evrard, A. E. 2001, ApJ, 546, 100
- McCarthy et al. (2007) McCarthy, I. G., Bower, R. G., & Balogh, M. L. 2007, MNRAS, 377, 1457
- Metzler & Evrard (1994) Metzler, C. A. & Evrard, A. E. 1994, ApJ, 437, 564
- Miller et al. (2002) Miller, C. J., Nichol, R. C., & Chen, X. 2002, ApJ, 579, 483
- Muanwong et al. (2001) Muanwong, O., Thomas, P. A., Kay, S. T., Pearce, F. R., & Couchman, H. M. P. 2001, ApJ, 552, L27
- Nagai (2006) Nagai, D. 2006, ApJ, 650, 538
- Nagai et al. (2003) Nagai, D., Kravtsov, A. V., & Kosowsky, A. 2003, ApJ, 587, 524
- Nagai et al. (2007) Nagai, D., Vikhlinin, A. A., & Kravtsov, A. V. 2007, ApJ, 655, 98
- Nath & Roychowdhury (2002) Nath, B. B. & Roychowdhury, S. 2002, MNRAS, 333, 145
- Norman & Bryan (1999) Norman, M. L. & Bryan, G. L. 1999, in LNP Vol. 530: The Radio Galaxy Messier 87, ed. H.-J. Röser & K. Meisenheimer, 106
- Pearce et al. (2000) Pearce, F. R., Thomas, P. A., Couchman, H. M. P., & Edge, A. C. 2000, MNRAS, 317, 1029
- Pfrommer et al. (2007) Pfrommer, C., Enßlin, T. A., Springel, V., Jubelgas, M., & Dolag, K. 2007, MNRAS, 378, 385
- Pierpaoli et al. (2003) Pierpaoli, E., Borgani, S., Scott, D., & White, M. 2003, MNRAS, 342, 163
- Pierpaoli et al. (2001) Pierpaoli, E., Scott, D., & White, M. 2001, MNRAS, 325, 77
- Pointecouteau et al. (2005) Pointecouteau, E., Arnaud, M., & Pratt, G. W. 2005, A&A, 435, 1
- Ponman et al. (1999) Ponman, T. J., Cannon, D. B., & Navarro, J. F. 1999, Nature, 397, 135
- Ponman et al. (2003) Ponman, T. J., Sanderson, A. J. R., & Finoguenov, A. 2003, MNRAS, 343, 331
- Pratt et al. (2006) Pratt, G. W., Arnaud, M., & Pointecouteau, E. 2006, A&A, 446, 429
- Rasia et al. (2006) Rasia, E., Ettori, S., Moscardini, L., Mazzotta, P., Borgani, S., Dolag, K., Tormen, G., Cheng, L. M., & Diaferio, A. 2006, MNRAS, 369, 2013
- Rasia et al. (2004) Rasia, E., Tormen, G., & Moscardini, L. 2004, MNRAS, 351, 237
- Seigar et al. (2007) Seigar, M. S., Graham, A. W., & Jerjen, H. 2007, MNRAS, 378, 1575
- Seljak (2002) Seljak, U. 2002, MNRAS, 337, 769
- Sijacki & Springel (2006) Sijacki, D. & Springel, V. 2006, MNRAS, 366, 397
- Suginohara & Ostriker (1998) Suginohara, T. & Ostriker, J. P. 1998, ApJ, 507, 16
- Tozzi (2006) Tozzi, P. 2006, Lectures in the 3rd Aegean Summer School, Chios, 26 September - 1 October, 2005 (astro-ph/0602072)
- Valdarnini (2002) Valdarnini, R. 2002, ApJ, 567, 741
- Valdarnini (2003) —. 2003, MNRAS, 339, 1117
- Vazza et al. (2006) Vazza, F., Tormen, G., Cassano, R., Brunetti, G., & Dolag, K. 2006, MNRAS, 369, L14
- Vikhlinin (2006) Vikhlinin, A. 2006, ApJ, 640, 710
- Vikhlinin et al. (2006) Vikhlinin, A., Kravtsov, A., Forman, W., Jones, C., Markevitch, M., Murray, S. S., & V., S. L. 2006, ApJ, 640, 691
- Vikhlinin et al. (2001a) Vikhlinin, A., Markevitch, M., & Murray, S. S. 2001a, ApJ, 551, 160
- Vikhlinin et al. (2001b) —. 2001b, ApJ, 549, L47
- Vikhlinin et al. (2005) Vikhlinin, A., Markevitch, M., Murray, S. S., Jones, C., Forman, W., & Van Speybroeck, L. 2005, ApJ, 628, 655
- Vikhlinin et al. (2003) Vikhlinin, A., Voevodkin, A., Mullis, C. R., VanSpeybroeck, L., Quintana, H., McNamara, B. R., Gioia, I., Hornstrup, A., Henry, J. P., Forman, W. R., & Jones, C. 2003, ApJ, 590, 15
- Voit (2005) Voit, G. M. 2005, Rev.Mod.Phys., 77, 207
- Voit & Bryan (2001) Voit, G. M. & Bryan, G. L. 2001, Nature, 414, 425
- Voit et al. (2002) Voit, G. M., Bryan, G. L., Balogh, M. L., & Bower, R. G. 2002, ApJ, 576, 601
- Voit et al. (2005) Voit, G. M., Kay, S. T., & Bryan, G. L. 2005, MNRAS, 364, 909
- White et al. (1997) White, D. A., Jones, C., & Forman, W. 1997, MNRAS, 292, 419
- White (1991) White, III, R. E. 1991, ApJ, 367, 69
- Wu et al. (2000) Wu, K. K. S., Fabian, A. C., & Nulsen, P. E. J. 2000, MNRAS, 318, 889