Spectroscopic observations of eight supernovae at intermediate redshift
Abstract
Aims. We present spectra of six Type Ia and two Type II supernovae obtained in June 2002 at the William Herschel Telescope during a search for Type Ia supernovae (SN Ia) at intermediate redshift.
Methods. Supernova type identification and phase determination are performed using a fitting technique based on a minimization against a series of model templates.
Results. The spectra range from to , including one spectroscopically underluminous SN Ia at . This set of spectra significantly increases the sample of well-observed type SN Ia supernovae available in the range . Together with the twelve supernovae observed by our team in 1999 in the same redshift range, they form an homogeneous sample of seventeen type Ia supernovae with comparable signal-to-noise ratio and regular phase sampling in a still largely unexplored region of the redshift space.
Key Words.:
cosmology:observations – supernovae:general1 Introduction
Spectroscopic observations of type Ia supernovae (SN Ia) at various redshifts are crucial when building the Hubble diagram from which cosmological parameters are derived. They are necessary to confirm the nature and type of the candidates, which are usually selected by photometric means. They also provide the only way, so far known, to measure redshifts with sufficient accuracy to be used in constructing the Hubble diagram. Moreover, spectra give clues to the diversity of type Ia supernovae (Benetti et al., 2005; Hachinger et al., 2006) and allow one to test the fundamental hypothesis underlying these cosmological studies: that type Ia supernovae are standardizable candles.
Much effort has thus been put in the last decade to detect and follow up SN Ia, both photometrically and spectroscopically, at high redshifts where the cosmological test is most significant and at low redshifts where observations are necessary to anchor the Hubble diagram. Spectroscopic and photometric programs have been scheduled in parallel as part of unified observational programs on various telescopes during the pioneering SN searches in the late 1990s and early 2000s. More recently, these programs are typically scheduled in service observing mode at the 8-10m class telescopes in second generation, larger scale searches such as the ones undertaken by the SNLS (Astier et al., 2006) or the ESSENCE/High-Z teams (Barris et al., 2004; Matheson et al., 2005). Whereas the high redshift supernova searches have gathered several hundreds spectra of type Ia supernovae (Basa et al., 2006; Howell et al., 2005; Hook et al., 2005) and spectroscopic programs are underway to study low redshift SN Ia (LOSS; Filippenko et al. (2001), SNFactory; Aldering et al. (2002)), the redshift range has been relatively unexplored so far. This situation is about to change with the forthcoming publication of the Sloan Digital Sky Survey (SDSS; Sako et al. (2005a, b)) supernova sample at intermediate redshift. This should provide an unprecedented collection of supernova spectra at these redshifts. Meanwhile, smaller scale searches of SN Ia at intermediate redshifts have been undertaken by various groups, e.g. Riello et al. (2003), Balland et al. (2006). The spectra described in this paper are part of such pioneering observations.
Studying SN Ia at intermediate redshifts is of crucial importance. These supernovae not only allow for the filling of the gap observed in the current Hubble diagram, but also their spectra allow for studying the evolution of supernova properties with redshift as well as the evolution of the rate of peculiar (under- or overluminous) supernovae that can pollute supernova samples and thus potentially alter the derived cosmological results. There is growing evidence that diversity rather than uniformity is common among type Ia supernovae at low redshifts and it is important to know whether this diversity is also found at higher redshifts and how it may limit the precision on the cosmological parameters one can expect from this cosmological test based on the Hubble diagram.
For these reasons, a systematic search for SN Ia at intermediate redshift was carried out at the Isaac Newton Group of Telescopes on La Palma Observatory in 2002 as part of the International Time Program (ITP2002; Ruiz-Lapuente et al.) on ” and from Supernovae, and the Physics of Supernova Explosions”. The spectra presented in this paper were obtained on June 10th and 11th, 2002 at the William Herschel Telescope (WHT). Photometric detection and follow-up were obtained at the 2.5m Isaac Newton Telescope, the 1.0m Jakobus Kapteyn Telescope and the Nordic Optical telescope. Preliminary results of this search have been reported by Altavilla et al. (2005). The present paper presents in detail the fully reduced spectra and their analysis. In Sect. 2, we briefly summarize the detection strategy. More details can be found in Balland et al. (2006) as the strategy described in that paper is by many respects comparable to the one adopted in this search. In Sect. 3, we present the spectroscopic observations and reduction techniques. We present the spectroscopic analysis and results in Sects. 4 and 5. Finally, we discuss our spectra and conclude in Sect. 6.
2 Strategy for discovering SN Ia at intermediate redshift
The search for supernovae used the INT Prime Focus Wide Field Camera (WFC) with its array of four 40962048 thinned EEV CCD’s. This camera has a square degree FOV. Repeated observations of the same area of the sky were obtained for consecutive 4 nights (June 4th to June 7th 2002) in one photometric band (g’) on 88 separate fields. These were selected from the Wide Field Survey (WFS) fields, including the 1610+5430 Elais N1, 1637+4117 Elais N2 and 2240+0000 regions. Due to overlap of fields, about 20 square degrees were surveyed over the discovery period, for a total of 2 exposures of 480 seconds with an average seeing of arcsec. The typical depth achieved was g’ (Walton et al., 1999; McMahon et al., 2001). Subtraction images were then obtained by subtracting a reference image of the same field obtained two or three years before (these reference images were g’ band 600s exposures), from either the first, the second or the sum of two new exposures. During the first three nights, the search for point-like sources was performed automatically on the three subtracted images, by requiring a positive subtraction simultaneously on the three images and at the same location within two pixels. Cosmic rays hits and transient objects are rejected by this procedure. The candidates were then checked visually by several (at least two) independent scanners. The selected candidates were then reobserved the following night and kept only if present on these new images with a similar or higher flux. This aims to limit the number of declining supernovae selected by our procedure. Finally, supernova candidates were classified as very likely, probable or possible supernovae according to their flux and shape properties, and prioritized for spectroscopy. Applying this search procedure generated 25 supernova candidates over the 4 nights of the discovery period. Seventeen candidates were sent to WHT for spectroscopy within a few days after discovery, among which eight were subsequently confirmed as supernovae (Ruiz-Lapuente et al., 2005). The remaining candidates were identified as various active galaxies ranging from to , and are not presented in this paper.
3 Spectroscopic observations and reduction
3.1 Observations
We used the two arms (red and blue) of the ISIS spectrometer to obtain long-slit spectra of the supernova candidates previously selected. Observations were carried out on June 10th and June 11th 2002. The weather was good during these two nights, with an average seeing of arcsec. For each candidate, except two (SN 2002lk, SN 2002li), two exposures of 900s were obtained producing spectra over the spectral range , using the R158B grating in the blue arm and the R158R grating in the red arm, with the dichroic filter. The typical spectral resolution is in the blue and red arms, with fringing arising in the red spectra beyond . A slit of arcsec width was used on June 10th at the parallactic angle. On June 11th, the slit width was reduced to 1.0 arcsec, comparable to the seeing, except for one spectrum of SN 2002lk and one of SN 2002lj. Good quality spectra, with signal-to-noise ratio greater than or of the order of 5 per pixel ( bin), were obtained in this way. Spectra of two spectrophotometric standard stars (BD+17 4708 and HZ 44) were acquired at the beginning and at the end of each night and used to flux calibrate the supernova spectra. Copper-Neon-Argon arcs were also taken for the purpose of wavelength calibration.
For one candidate, SN 2002lk, first observed on June 10th, one more exposure of 600s was taken on June 11th. Indeed, this very unusual supernova at low redshift () was identified as a spectroscopically underluminous supernova during a preliminary reduction at the telescope (see below).
A summary of the spectroscopic observations is given in Table Spectroscopic observations of eight supernovae at intermediate redshift.
3.2 Spectra reduction and extraction
Data reduction was done in two steps: first, a rapid assessment of the spectra was performed at the telescope in order to decide whether more telescope time should be spent on a particular object. For example, after the ”real time” analysis of SN 2002lk, we decided to take another spectrum of this object during the next night. Then, a full reduction of the spectra was done off-line, using ESO-MIDAS data reduction software version SEP02. After debiasing and flat-fielding, a two dimensional dispersion relation was obtained from the identification of lines for each row of an CuNeAr arc frame (the dispersion axis is horizontal in our settings) and applied to every frame for wavelength calibration. Mild geometrical distortions along the slit, likely due to instrument flexure during observations, were traced and corrected for. The wavelength calibration was checked against a few prominent emission sky lines, both for blue (NaI at 5893Å and [OI] at 5577Å) and red ([OI] at 6300 and 6363Å) frames, and was found to be at most within 1 of the tabulated value. This lead to a wavelength calibration accuracy better than 0.05 % over the entire wavelength scale. The wavelength calibrated frames were then corrected from extinction using the extinction curve of La Palma observatory (King, 1985) and absolute flux calibration was done using spectrophotometric standards spectra acquired at the beginning and end of each night. Sky subtraction was performed by polynomial interpolation of the sky signal at the location of the spectrum, using two windows above and below the candidate spectrum. Parameters for sky extraction were optimized in order to minimize the r.m.s. dispersion of the sky residuals in the sky subtracted frame, in 200 wavelength bands centered on and for the blue arm, , and for the red arm, where sky emission lines are important. Extraction of spectra was then performed following the Horne (1986) optimized algorithm. Sky residuals were subtracted by hand but we did not attempt to correct for atmospheric absorption features. An error spectrum was computed for each candidate spectrum using the CCDs noise and gain properties. Error spectra are dominated by the sky emission both in the red and blue spectra, but, due to the dichroic response, the error is slightly larger in the blue than in the red.
4 Identification procedure
4.1 Redshift determination
As a first step in identification, we determined the redshift of the candidate from galaxy emission or absorption lines if present, or directly from the supernova absorption features. If derived from galaxy lines, the accuracy on the wavelength calibration translates into an absolute uncertainty on the redshift of less than 0.001 at and even lower at intermediate redshift. As a consequence, all redshifts derived from the host lines (denoted ) are given in this paper with three significant figures. In the case where the redshift determination is drawn from supernova features, the uncertainty increases by up to 0.01 due to large P-Cygni lines and dispersion in the line velocities among supernovae at a given phase.
4.2 Template fitting
As for our 1999 campaign, we used a template fitting technique based on a minimization to identify SN candidate spectra. Using -fit, software developed for the SNLS collaboration (Sainton, 2004; Balland et al., 2006), a series of model templates is built as a combination of a fraction of a supernova and a fraction of a galaxy properly redshifted to the redshift of the spectrum candidate (if known, otherwise the redshift is left as a free parameter):
| (1) |
These models are compared to the spectral data. The minimization is done against the pair of parameters and , excluding undesirable regions, such as atmospheric absorptions, if necessary, and is performed for all couples SN/galaxy available among the different template categories selected by the user. Solutions are ranked in order of increasing reduced and the resulting parameter set and templates are given. The stability of the phase (and of the redshift obtained from the fit when no host lines could be used) is checked by examining the five first solutions immediately following the best-fit solutions. The typical error on the phase determination for SN Ia spectra around maximum (up to days) was found to be days for spectra with comparable signal-to-noise ratio as in Balland et al. (2006). This increases to days for later phase spectra as supernova spectra evolve less rapidly at later time in the photospheric phase. SN and galaxy templates are drawn from a database111Appendix A of Balland et al. (2006) describes this database in details containing about 250 templates including local Branch-normal SN Ia with a continuous phase sampling between -10 up to +15 days, under and overluminous SN Ia, a series of partially synthetic templates with a phase sampling of day (Nobili et al., 2003), various templates of type Ib, Ic and II supernovae, and a set of galaxy templates from Kinney et al. (1996) representing the Hubble sequence from ellipticals to late-type spirals.
All template spectra were dereddened, except for the two highly reddened supernovae SN 1986G (Phillips et al., 1987) and SN 1998bu (Jha et al., 1999), and put into the restframe. No reddening correction is allowed during the fit because such a correction is likely to be hard to interpret, as many effects can combine to give a spectrum ”redder” than real (e.g., error in flux calibration, flux losses due to differential refraction unproperly accounted for). However, one might be worried that a reddened spectrum leads to a wrong, later phase than real, identification. To test this hypothesis, Balland et al. (2006) have artificially reddened by various amounts of the template spectrum SN 1994D (Patat et al., 1996) at -2 days and fitted the reddened spectra. They found that, as higher values of are used, the fit tends indeed to produce later phase (redder) solutions. However, for values higher than 0.2, no satisfactory fit is obtained. For , they found that this reddening-phase degeneracy can not lead to an error on the phase of more than 2 to 3 days, comparable with the accuracy on the phase determination obtained for unreddened spectra.
The fit is performed on the wavelength range over which the template model and the spectral data overlap. Even if the database templates have been selected, among other criteria, for their large spectral range, once redshifted, the overlap region with the data might be small. In that case, confusion with other types is possible as, e.g., type II supernova features might fit well the red part of a SN Ia. Another possible degeneracy that might falsify the identification is the possible confusion between a SN Ic at early phase with a SN Ia after maximum. Complementary information, such as the date of B-band maximum light, should be used if available.
4.3 Host galaxy subtraction and identification
Contamination of the supernova spectrum by its host signal often occurs and it is an important step to subtract the galaxy contribution in order to get the true supernova spectrum. In our scheme, the contribution of the template galaxy to the total model is done by -fit. The fraction represents the fraction of the galaxy template in the model and not the real contribution of the galaxy to the total signal. Nevertheless, the fraction given by -fit provides a useful indication of the galaxy contribution. In case a spectrum of the host can be extracted from the data, it can be used as an input galaxy to build the model. However, this situation never occured in the present analysis.
Host identification is preferentially made from emission and/or absorption lines when present in the spectrum. We adopt the division of the host galaxy into three main morphological classes as proposed by Sullivan et al. (2003): type 0 for spheroids (E/S0/bulge), type 1 for early-type spirals (Sa/Sb) and type 2 for late-type spirals and starbursts (Sc/Stb). Spectral features used for the identification (and for redshift determination; see §4.1) include Ca ii H&K absorption lines at and Å, the 4000Å break (), Hydrogen Balmer lines (mostly and given the redshift range of the present spectra), oxygen forbidden lines [O ii] and [O iii]. When no line is present in the total (SN+host) spectrum, identification is based on the result of the minimization procedure. Indeed, -fit selects a best-fit host type according to the lines and the overall spectral energy distribution. This, in itself, gives an indication of the real nature of the host and the concordance of the identification based on galaxy lines with the best-fit galaxy from -fit is found to be satisfactory in approximately 80% of occurences. We also determine a host type from the SDSS colors available for our galaxies (see §5.4 below).
4.4 Strategy for supernova identification
In order to confirm the candidate nature, type and phase, we systematically perform a fit for the total (blue + red) spectra using all supernova and galaxy templates available. If a satisfactory solution is obtained for a SN Ia template, we then perform three series of fits: one with Branch-normal SN Ia templates alone, one with Nobili’s templates alone, and one with peculiar (under and overluminous) SN Ia templates. If the best-fit solution is not obtained for a SN Ia template, we perform another fit restricting to SN II or SN Ib/c templates to compare the best-fit result with adjacent solutions with the same SN type. If galaxy lines are absent, a plausible redshift range is determined from the absorptions visible in the spectrum of the candidate supernova, and is used as an initial guess for the minimization procedure. In all cases, we redo the fits after having cut all galaxy lines present in the data. This gives a new redshift fit, . The uncertainty on is typically of 0.01, that is 10 times higher than the uncertainty on the redshift drawn from galaxy lines.
Comparison of the reduced leads to the candidate identification. When the lowest is obtained for a normal SN Ia, we test the stability of the phase by 1) checking the five solutions immediately following the best-fit solution in terms of increasing ; 2) checking that the solution obtained from the fit with Nobili’s templates is consistent (within the typical uncertainty on the phase days) with the normal SN Ia solution; this usually happens, except when the normal SN Ia templates yield a solution fitting a too small wavelength range of the data: in that case, due to its large wavelength coverage, the Nobili’s templates are likely to give a better estimate of the phase; 3) that fitting the red and blue spectra separately yields consistent solutions in terms of phase; 4) that the best-fit solution for the full spectrum is consistent with the solutions obtained when fitting the blue or red part alone. This insures that the phase is securely determined within to 4 days.
5 Spectroscopic results
5.1 General results
Table Spectroscopic observations of eight supernovae at intermediate redshift presents the results of the identification for the eight supernovae observed during this campaign. For each supernova, the best fit result is given for the total spectrum. Columns 2 and 3 give the best-fit supernova and galaxy template model. In column 3, the percentage of galaxy signal in the best-fit model is indicated. Columns 4 and 5 give the best-fit redshift from the fit and from host lines . Finally, columns 6 to 8 indicate the phase of the best-fit solution, the reduced value and the associated number of degrees of freedom. Five out of the eight supernovae observed are found to be normal SN Ia (SN 2002li, SN 2002lj, SN 2002lp, SN 2002lq and SN 2002lr), while one is identified as a spectroscopically underluminous SN Ia (SN 2002lk) and two are type II supernovae (SN 2002ln and SN 2002lo). For the SN Ia of the sample, three are pre- or close to maximum light whereas three have phases between 3 and 9 days after maximum. The two type II supernovae in our sample are at late phases. As SN II are less energetic events than SN Ia, only those at relatively low redshift () match the selection cuts of the present search and have thus been selected as potential SN Ia candidates.
In Figure 1, we show the fitted redshift as a function of the redshift (upper panel), and the corresponding residuals (bottom panel). The two quantities agree at better than the 1% level, with the dispersion being higher for supernovae with weak galaxy features. The total r.m.s dispersion is , and is an estimate of the error on the redshift determined by -fit. On the residuals, it is seen that no systematic effect affects the redshift determination. All observed supernovae are in the range , with an average redshift . Excluding the peculiar SN 2002lk and the two type II-P SN 2002ln and SN 2002lo, the average redshift becomes . The redshift of SN 2002lk is found to be . Indeed, the selection of an underluminous supernova implies it to be at a much lower redshift than a normal SN Ia. SN 2002lk is thus not in the intermediate redshift range targeted during this search and we will exclude it from the intermediate sample analysis. However, as a peculiar object, it is an interesting supernova and we devote to it a specific analysis later in this paper.
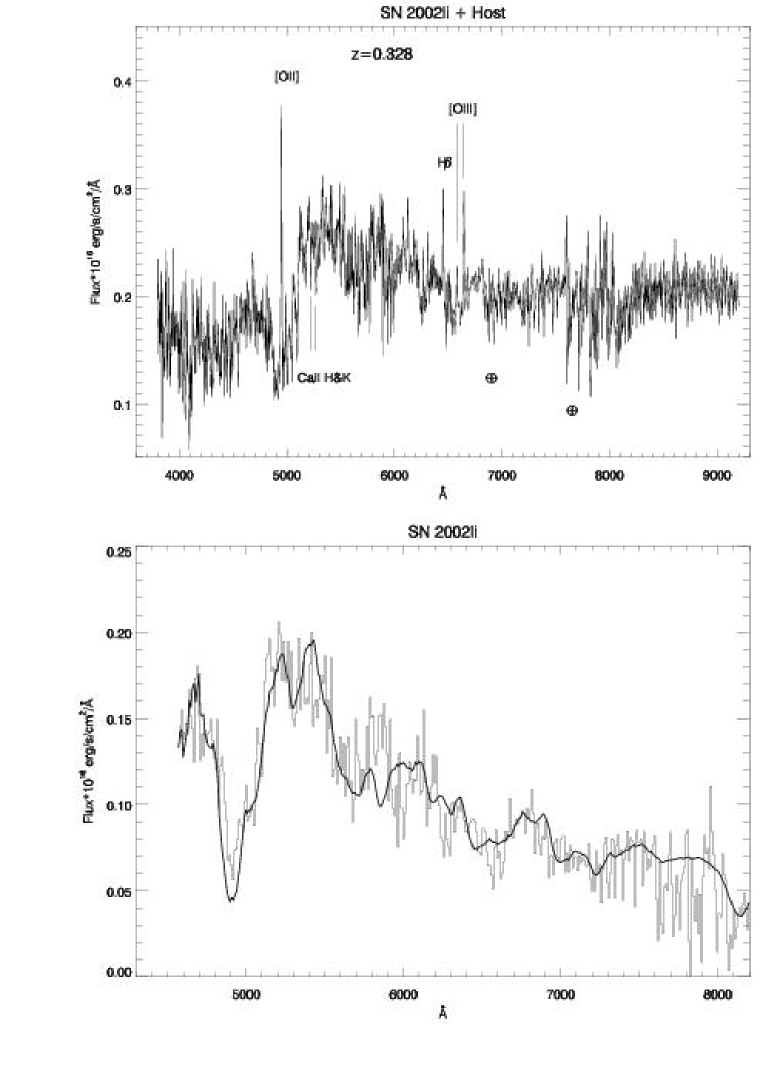
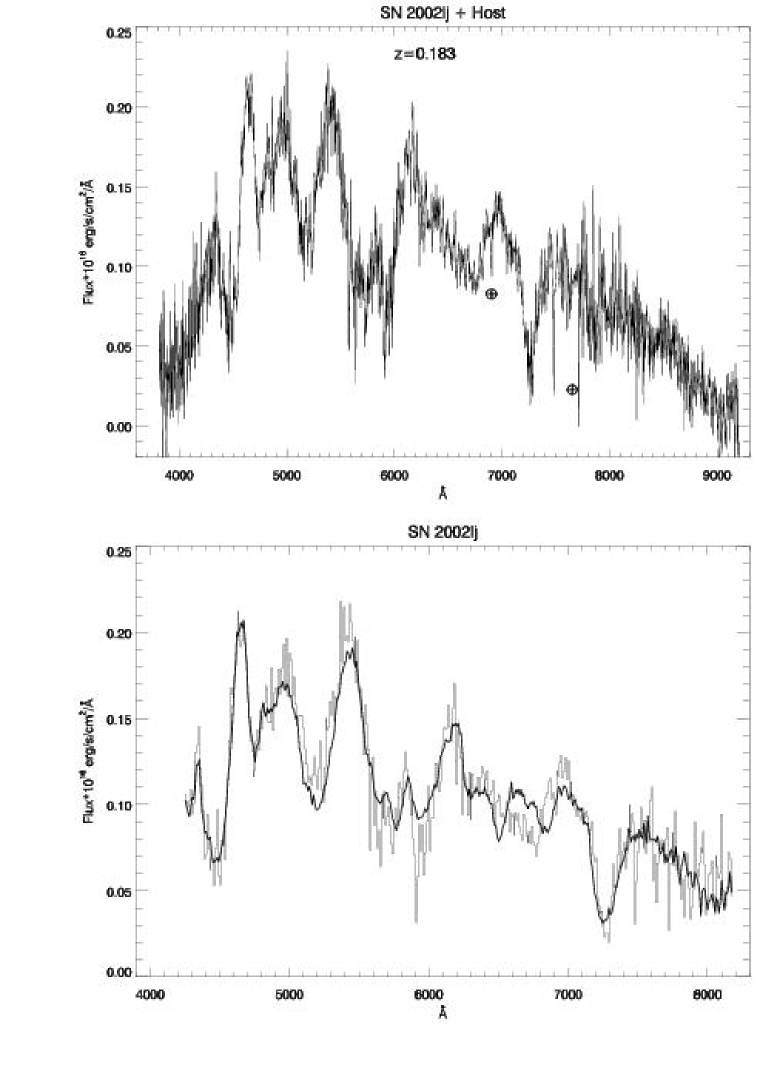
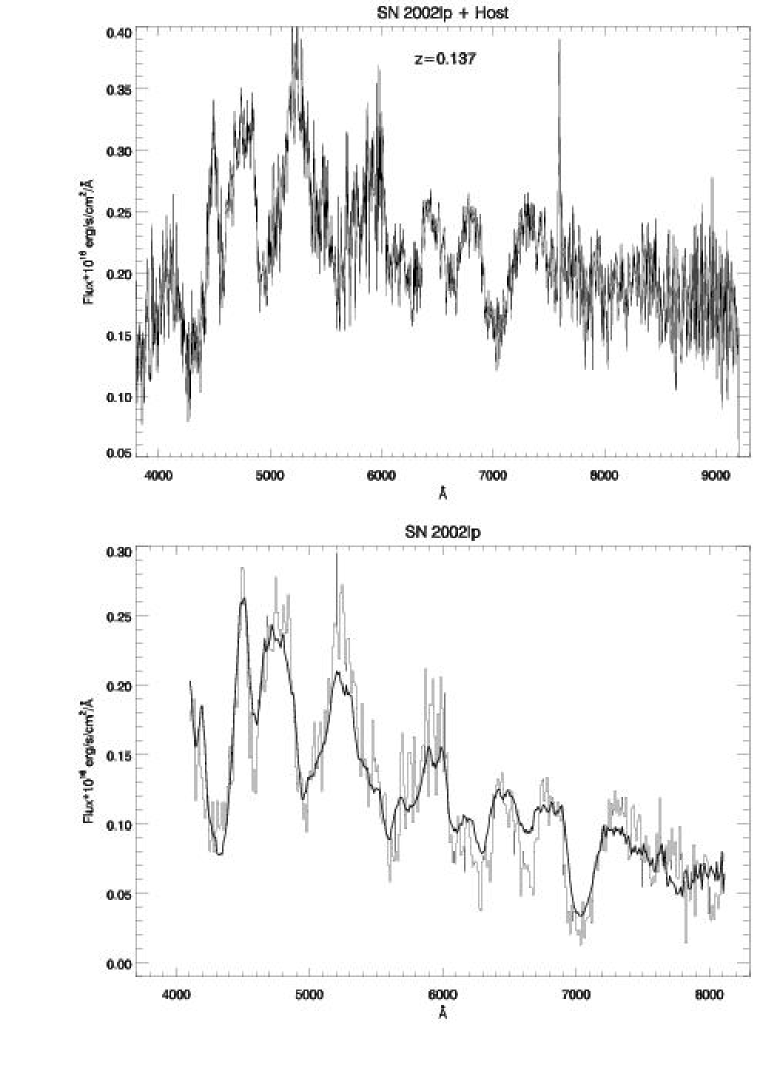
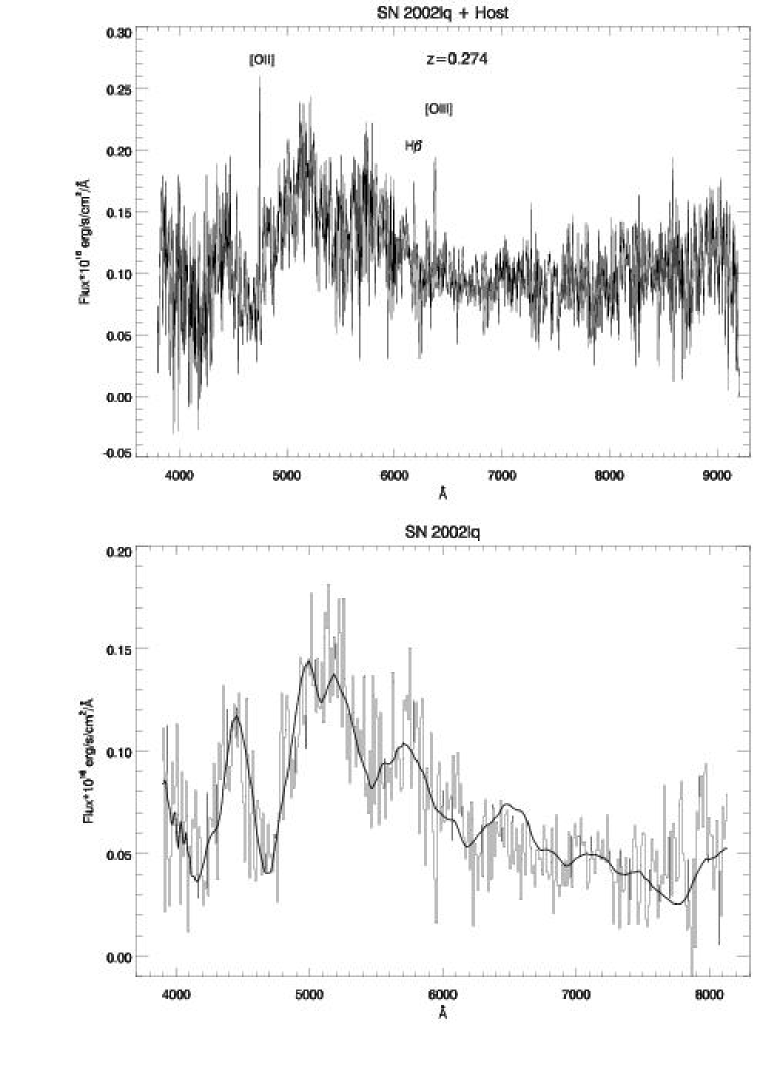
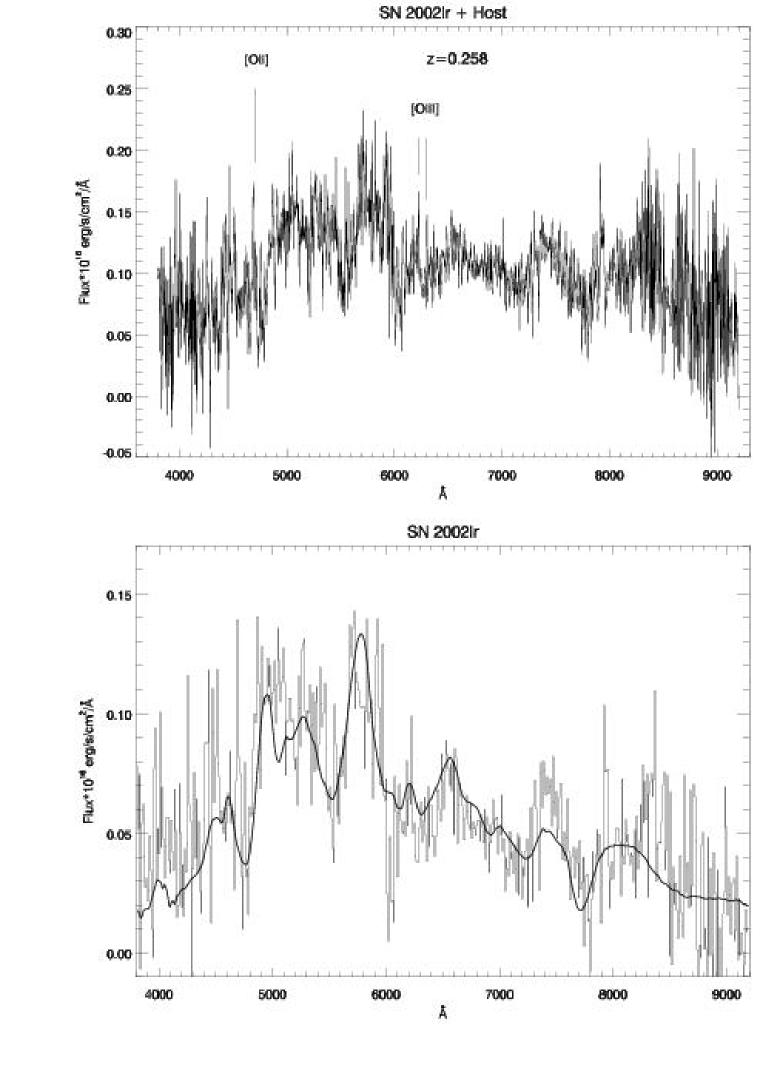
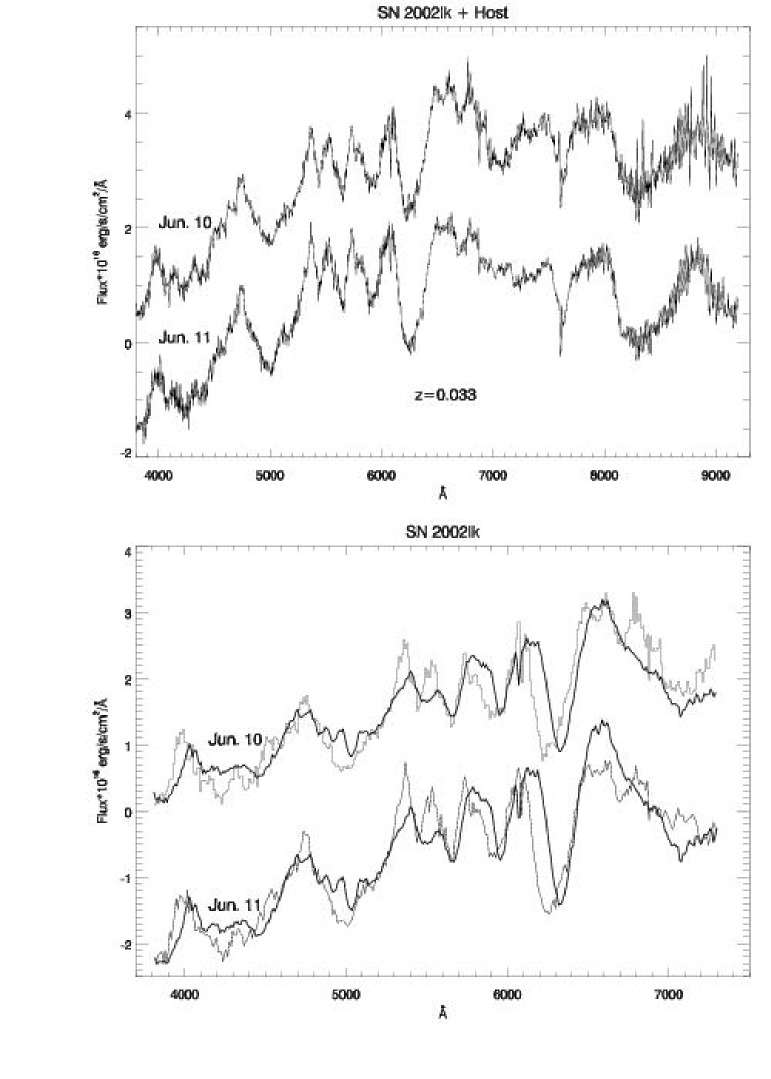
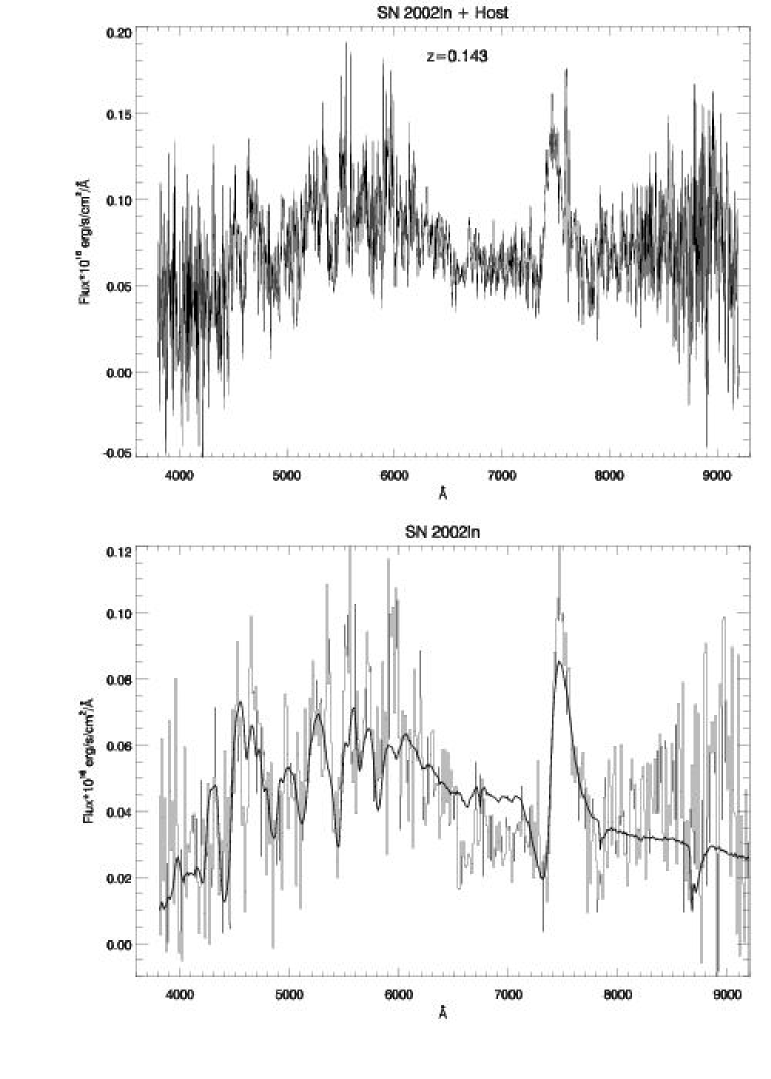
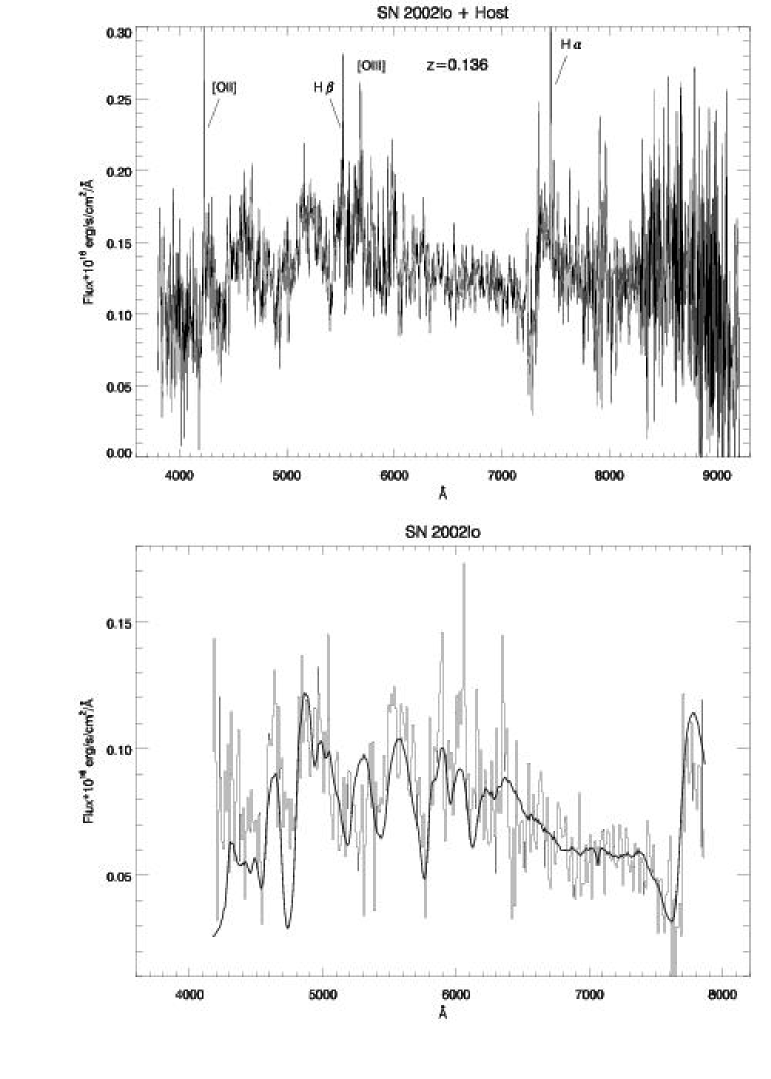
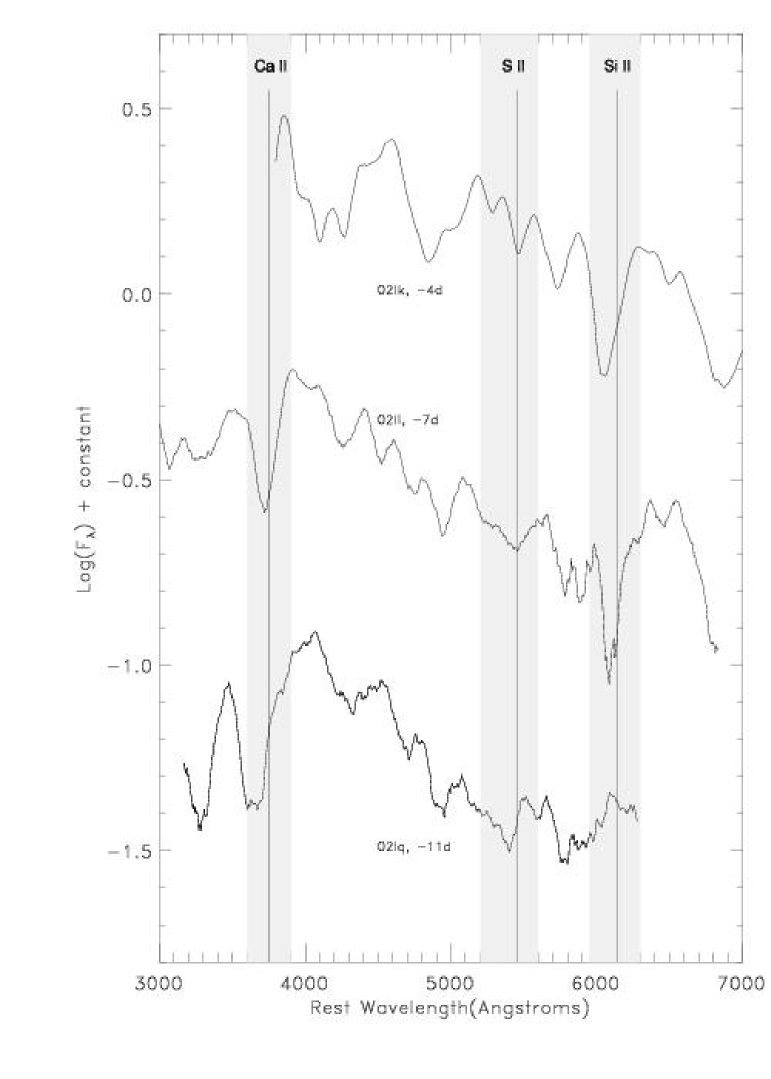
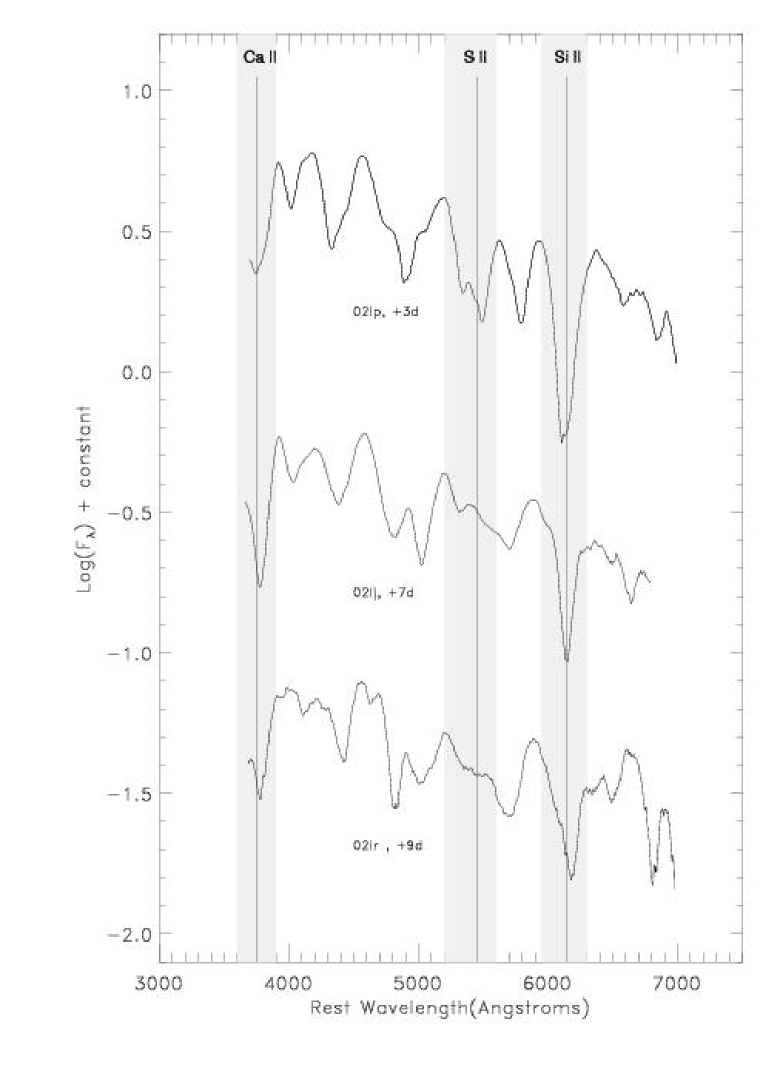
In Figures 2 to 10, we present the spectra. For each supernova, we show the total spectrum (SN+host) over the full spectral range (top panel), and the SN alone with the best-fit solution superimposed (bottom panel). All spectra are presented in the observer frame and the SN spectra have been rebinned on 10Å bins for visual convenience. Uncorrected atmospheric lines are indicated with the sign . When visible, galactic lines are labeled with the corresponding ion. A smoothed version of these SN Ia spectra is presented in Figures 11 and 12, for pre-maximum and post-maximum supernovae respectively. The spectra are ordered with increasing phase. Residual lines resulting from imperfect galaxy subtraction and atmospheric absorption lines have been removed, and the spectra have been smoothed using a Savitsky-Golay filter of degree 2 with a 60 data points window (Press et al., 1992). The three grey lines on these two latter graphs indicate the Ca ii, S ii and Si ii found in normal SN Ia. In addition, three vertical solid lines indicate the positions of Ca ii at 3945Å, S ii at 5640Å and Si ii at 6355Å, blueshifted by 15000 km/s (Ca ii) and 10000 km/s (S ii, Si ii). These values are typical of ’normal’ SN Ia at maximum (Benetti et al., 2004) and serve as a reference for visual inspection.
The presence of features due to intermediate mass elements in the supernova spectra is a discriminant for the fits, and thus for the identification. Due to the redshift range and spectral response of the grating used with the red arm, the Si ii signature found at 6150Å (in the restframe of the supernova) is often noisy if visible at all. The W-shape around 5500Å due to S ii absorption at 5640Å often falls close to or in the cut-off region of the dichroic filter. Moreover, this feature is observed around maximum and fades at later epochs. It is indeed often difficult to identify it in our spectra. Other discriminant features in the blue part of the spectra are the Ca ii absorption at 3945Å and the Si ii at 4130Å . Regarding SN II, the main discriminant features are the P-Cygni profiles of the Hydrogen Balmer series, mostly and .
5.2 Notes on individual SN Ia
In this section, we detail the properties of each spectrum and discuss the results of the fitting procedure.
5.2.1 Normal SN Ia
SN 2002li: This is a typical SN Ia before maximum (Fig. 2). It has the largest redshift of the sample (). The full spectrum is well fitted by SN 2003du (Anupama et al., 2005) at 7 days. The phase is very stable when one goes to higher rank solutions. The red part does not show many wiggles and the fit is mostly sensitive to the overall energy distribution. The best-fit solution for the red spectrum only is for SN 1999ee (Hamuy et al., 2002) at 9 days. The same solution is found when the blue spectrum alone is fitted by Nobili’s templates. Again, the phase is very stable with higher ranked solutions. However, fitting the blue spectrum with SN Ia templates yields a somewhat lower value (SN 1999ee at 4 days), but the fitting range is small (269 pixels) and degeneracy between solutions may occur. We thus favor the 7 day solution, however note that the solution at 4 days is only marginally discrepant, given the day uncertainty.
The host galaxy contamination is fairly high as it ranges from to % for the three fits (blue, red, total spectrum). The best-fit host type is a Sa galaxy in all cases. Despite a somewhat noisy spectrum (high and fairly high host contribution), the identification is quite secure given the observed stability on the phase.
SN 2002lj: The signal-to-noise ratio is excellent (13 over the whole spectral range) for this typical SN Ia a week after maximum light (Fig. 3). The redshift () is determined from very weak host emission and absorption lines (the host contribution is low — less than 15% of the galaxy template is needed to build the best-fit model). The full spectrum is well fitted with SN 1992A, 7 days past maximum (Kirshner et al., 1993). The phase is very stable as the contiguous solutions to the best-fit are all for SN Ia at +7 days. The fit is excellent visually, except in the range 6100-6700Å where the redshifted W-shape S ii feature seen in SN Ia spectra up to one week after maximum is absent. This suggests that the phase of +7 days is a lower limit on the true phase. The fit of the sole red part of the spectrum corroborates this fact, as the best-fit solution is obtained for SN 1994D 10 days past maximum. Here again, this phase is very stable, and fitting with Nobili’s templates gives the same result for the phase. The best-fit solution for the blue spectrum is for SN 1992A +7 days and the best-fit phase for a fit with Nobili’s template is +8 days. The phase for the blue fit is very stable. All the fits we have attempted on this supernova yield a phase between 7 days up to 10 days, two values consistent within our adopted 3 day error bar.
The value obtained for the various fits is rather poor, a fact that traces back to the good signal-to-noise ratio of this spectrum. Indeed, when the signal is good (the error is low), the discrepancies between the model built by the fitting procedure and the data yield a high value of the . In some sense, the higher the signal-to-noise ratio, the poorer the fit in terms of values. This fact, already noted in Balland et al. (2006), underlines the limits of reproducing a large variety of supernova spectra from the template database.
As the galaxy contamination is weak, it is hard to derive any significant conclusion regarding its type from the fit. We note however that the best-fit is consistently obtained for a spiral galaxy, either a Sa (blue and full spectrum fit) or a Sb (red fit).
SN 2002lp: This supernova at is well fitted by SN 1992A template at +3 days (Fig. 4). Here again, the high value obtained reflects the discrepancies between the spectrum and the model, exacerbated by the good signal-to-noise ratio of the spectrum. Although the main features are convincingly reproduced by the model, we note a significant discrepancy around the Si ii 5972 as the model does not reproduce the deep silicon absorption. This is similar to what is observed in underluminous SN Ia. However, in underluminous SN Ia, this deep Si ii absorption goes along with another absorption at Å clearly not observed in our spectrum. We conclude that SN 2002lp is a normal SN Ia. The observed discrepancy illustrates the large diversity found in SN Ia .
SN 2002lq: The features of this SN at are most noticeable in the blue part of the spectrum with a prominent Ca ii 3965 Å absorption and are consistent with a normal SN Ia about 10 days before maximum light (Fig. 5). The best-fit phase is 11 days for SN 1994D. Features in the red part of the spectrum are less prominent but the overall energy distribution is consistent with this solution. Galaxy emissions are clearly detected in this moderately host contaminated spectrum.
SN 2002lr: The spectrum of this far () supernova is rather noisy but clear SN Ia features are visible both in the blue and the red part of the spectrum (Fig. 6). The best fit model (SN 1992A +9 days) reproduces fairly well the main features. This best-fit phase is to be taken as a lower limit, the uncertainty on the phase being larger from a week past maximum, as supernova features evolve less. The fit is poor from 8300 to 8600 (observer frame). This is likely to be due to sky subtraction residuals rather than to a real difference in the supernova spectrum, as sky emissions start being very important at these wavelengths.
5.2.2 A spectroscopically SN 1986G-like SN Ia ?
SN 2002lk: The spectrum of SN 2002lk exhibits the features of a reddened underluminous SN Ia (Fig. 7 and Fig. 8). In many respects it resembles the spectrum of SN 1986G (Phillips et al., 1987) as it lies in the dust lane of an early spiral galaxy (probably Sb) visible on the discovery images of this supernova. The spectral similarity is clearly visible in Figure 7. Best fits of these reddened spectra are obtained for a phase slightly past maximum (+2 days). Velocity shifts between the spectra and the template are noticeable, with SN 1986G having smaller blueshifts than SN 2002lk except around the sulfur W absorptions for which the expansion velocities are comparable. The observed discrepancies suggest different explosion energetics for these two supernovae. Also, we note that the Si ii and the Ca ii IR triplet absorptions are very large as compared to the same features in the SN 1986G template.
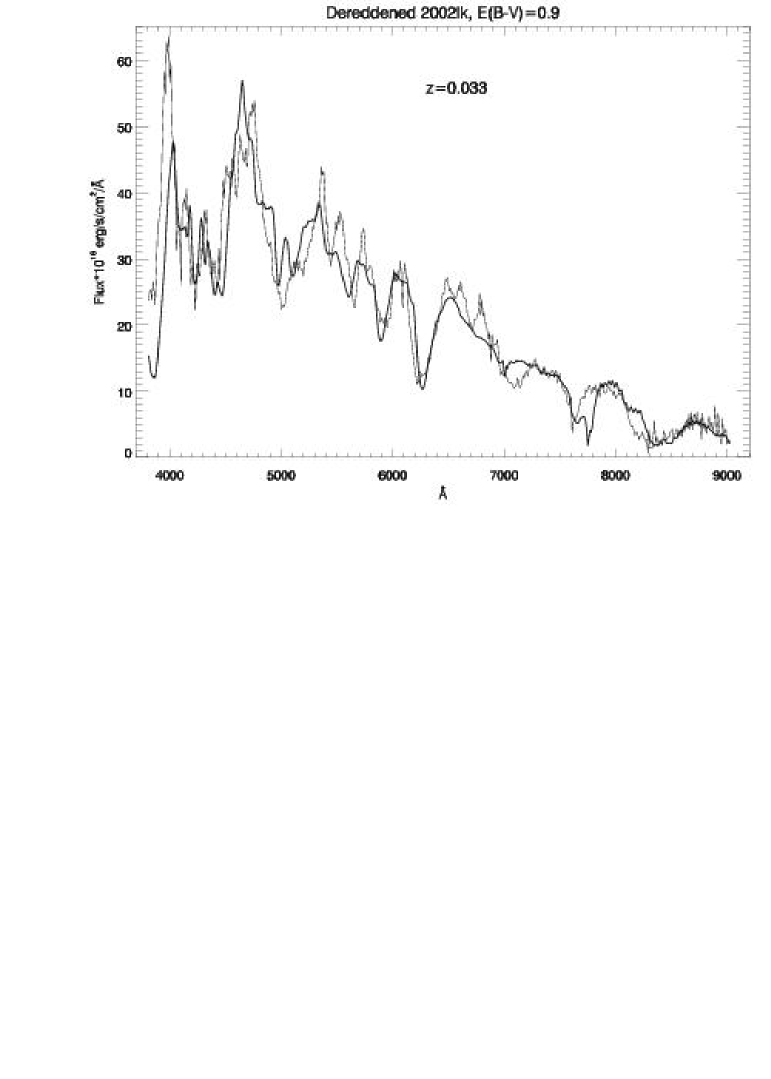
In Figure 8, we show the best-fit obtained for the June 10th spectrum of SN 2002lk dereddened using the reddening law of Howarth (1983) and (see §5.5 for more details). With this high color excess, a fair match of the spectrum is obtained for SN 1999by (Garnavich et al., 2004) 4 days before maximum. Note the difference between the phases obtained with fitting the reddened and the dereddened spectra. We adopt the phase of this latter, which is in almost perfect agreement with our preliminary photometric estimate of the date of maximum light (see §5.3.3 below).
5.2.3 SN II
As byproducts of our Ia supernova search, two candidates turn out to be type II supernova.
SN 2002ln: This noisy spectrum at is characterized by the prominent P-Cygni profile found in type II SNe spectra (Fig. 9). The best-fit is obtained for SN 1999em, a type-II plateau supernova (Hamuy et al., 2001; Elmhamdi et al., 2003). The best-phase is for about three weeks (23 days) after explosion. However, this value is rather uncertain due to the scarcity of the database templates at these ’late’ phases. Besides , we are able to fit several features in the blue part of the spectrum despite the fairly poor signal-to-noise ratio.
SN 2002lo: The spectrum of SN 2002lo exhibits a P-Cygni profile less prominent than for SN 2002ln, but has blue features more visible (Fig. 10). This type II-P supernova at is best-fitted by SN 1999em about 10 days after explosion (best-fit phase +13 days) although again some uncertainty on this value remains.
5.3 Properties of the SN Ia
In this section, we analyse the spectra presented in this paper and characterize their properties. Our main purpose is to assess the homogenity of this new sample at intermediate redshift for comparison to other supernovae at all redshifts.
5.3.1 Velocity measurements
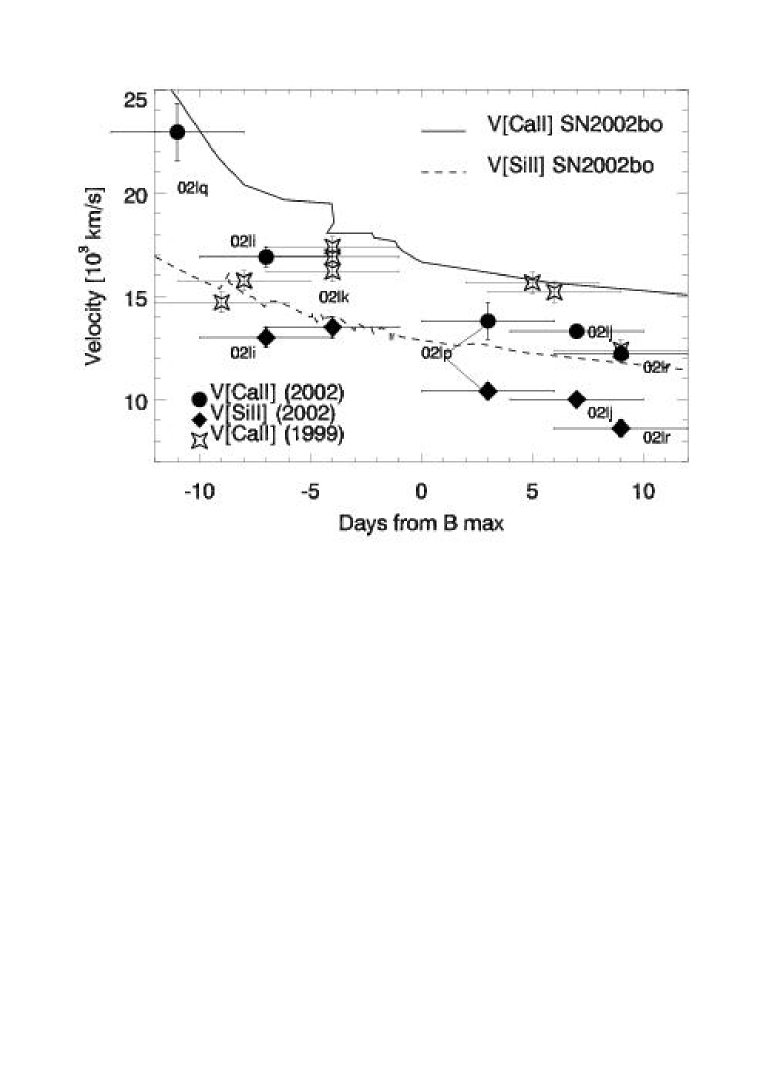
Supernova expansion velocity measurements at a given epoch, or the gradient between two different epochs, appear to be one of the major indicators of the diversity of SN Ia samples (Patat et al., 1996; Benetti et al., 2004, 2005; Hachinger et al., 2006). We have been able to measure a number of line velocities in our spectra for the calcium and silicon features. Results are given in Table Spectroscopic observations of eight supernovae at intermediate redshift and reported in Figure 13. Errors on the velocity measurements are obtained from several measurements of the minimum of the given absorption line and summed quadratically. For the error on the date of maximum light, we adopt the typical days from the spectroscopic identification. Solid and dashed lines are for SN 2002bo Ca ii and Si ii respectively (Benetti et al., 2004) and are shown for reference. The measurements made on the 2002 spectra are plotted as filled circles (Ca ii) and diamonds (Si ii). Also plotted as empty stars are the calcium measurements for 1999 SN Ia taken from Balland et al. (2006). The velocities of Si ii for SN 2002lj, SN 2002lp and SN 2002lr are similar to the one of SN 1994D (Patat et al., 1996). The Si ii velocity of SN 2002li is slightly higher. Only SN 2002lk exhibits a Si ii velocity comparable to SN 2002bo. The Si ii velocity of SN 2002lk is , about 3000 higher than for SN 1986G. Regarding Ca ii velocities, all measurements are consistent with SN 1994D, with SN 2002lq velocity being slightly higher. Measurement of Ca ii velocity for SN 2002lk is hardly possible, as this feature is located at the lower limit of the effective spectral range due to the very low redshift of this supernova. Analysis of line velocities does not provide any hint of any peculiarity for the 2002 supernovae in the range . Even the fairly high Si ii blueshift measured for the spectroscopically subluminous SN 2002lk falls within the dispersion observed among supernovae classified as ’Branch-normal’ SN Ia .
5.3.2 Searching for peculiar SN Ia
Putting aside SN 2002lk, we have systematically searched for peculiarities in the spectra of the 2002 intermediate redshift sample in order to assess the existence of peculiar SN Ia at these redshifts. We follow the analysis performed in Balland et al. (2006) and systematically perform a fit using only the peculiar (under- or overluminous) templates of our database. The best-fit solutions are compared to the best-fits obtained using only normal SN Ia templates. The possibility that two solutions are equivalent in terms of is assessed by performing a F-test on the two solutions. The results are presented in Table Spectroscopic observations of eight supernovae at intermediate redshift for the five SN Ia of our sample in the range . Columns 2 to 5 are for the fit using peculiar templates, columns 6 to 8 are the best-fit results using normal templates, as presented in Table Spectroscopic observations of eight supernovae at intermediate redshift. In all cases but one, the best-fit solution is obtained for normal templates rather than peculiar templates. The significance of this result is evaluated by means of the F-test values: the normal solution is strongly favored (low F-test) for SN 2002lj, SN 2002lp and SN 2002lr, three supernovae for which features are well fitted both in the red and the blue part of the spectra. The normal solution is only weakly favored for SN 2002lq as the relatively featureless red part of the spectrum is not very discriminant.
Only in the case of SN 2002li is a solution for an overluminous SN Ia template (SN 1999aa; Garavini et al. (2004)) weakly favored over a normal solution. Given the absence of characteristic features in the red part of this spectrum and a fair contamination of the spectral signal by the host light, the F-test does not clearly favor one solution over the other. At this stage, we consider that SN 2002li is likely a normal type Ia but this conclusion is not as secure as for the other SN Ia of the sample.
Finally, we note that the best-fit solutions obtained with peculiar templates are all for overluminous objects, except for SN 2002lp for which the underluminous SN 1999by is found as the best-fit template. This might be linked to the strong silicon 5972 absorption observed in this spectrum which is stronger than what is usually observed in normal SN Ia .
5.3.3 SN Ia Phases
An independent way to check the spectroscopic phase is to compare it with the phase derived from light-curve fitting. We have obtained this photometric phase as a preliminary step in the analysis of the photometric follow-up of our supernovae. The photometric analysis, including photometric calibration and control of systematics will be published elsewhere. We use here the dates of maximum light as these are very robust against slight modifications of the photometric calibration. Table Spectroscopic observations of eight supernovae at intermediate redshift gives the photometric date of B-band maximum (column 2) along with the one inferred from the spectroscopic analysis (column 3). We conservatively estimate a day uncertainty on the photometric dates. In Fig. 14, we plot the photometric Julian date of maximum as a function of the Julian spectroscopic maximum (top panel). Residuals are shown on the bottom panel. The dispersion obtained is days, slightly larger than our spectroscopic estimate. It grows up to days when considering the phases obtained from the fits with peculiar SN Ia templates (this difference is mainly due to SN 2002lr).
5.4 Host results
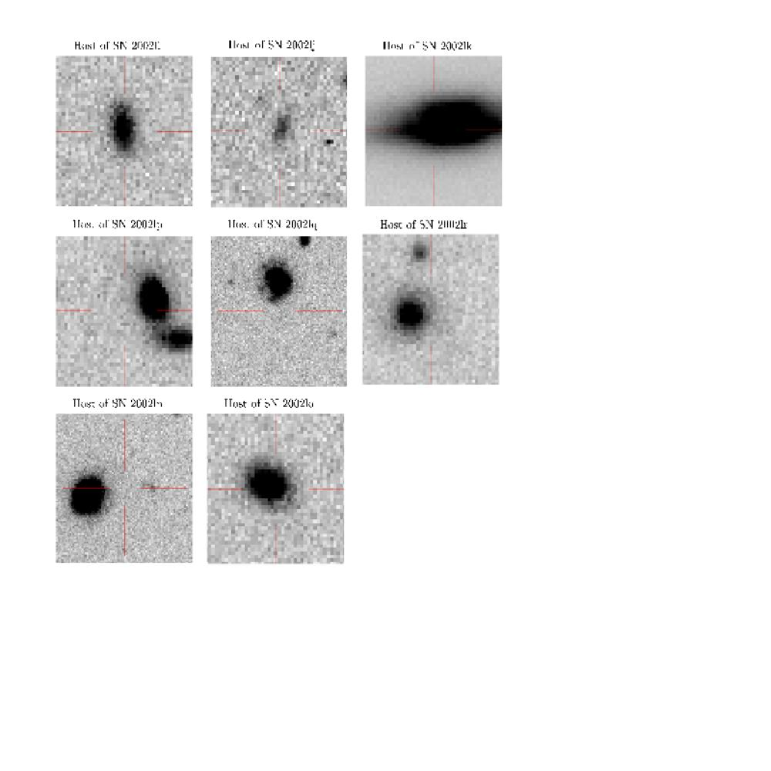
Figure 15 shows WFS reference images of host galaxies of the eight supernovae. All vignettes are a 0.250.25 square-arcmin g’ image centered on the location of the supernova explosion, except for SN2002ln and SN2002lq for which a 0.50.5 square-arcmin image is shown.
Table Spectroscopic observations of eight supernovae at intermediate redshift summarizes the host classification for each candidate. The lines used for identification are detailed in column 2, specific comments are given in column 3, and the identification based on the spectra is presented in column 4. For comparison, the galaxy of the best-fit model found by -fit is given in column 5. In general, good agreement is found between the identification drawn from galaxy features and the galaxy type used to build the best-fit model.
We have also computed host colors from their magnitudes found in the SDSS online archive. This was possible for six out of the eight supernovae of our sample, with the exception of SN 2002lj and SN 2002lk. Results are given in Table Spectroscopic observations of eight supernovae at intermediate redshift. u’-g’ and g’-r’ colors have been computed directly from the magnitudes, whereas B-V colors were calculated using Fukugita et al. (1996) color equations. We compare these colors to the colors of Frei & Gunn (1994) that were computed using the galaxy energy distributions compiled for each Hubble type by Coleman et al. (1980). For our purposes, we interpolate the and colors of Frei & Gunn at the redshifts of our hosts, for each Hubble type. To connect their galaxy types with ours, we associate their type E to our type 0, Sbc to our type 1 and Scd and Im to our type 2. We assume that a Sa galaxy (type 1 in our classification) has colors falling in between their E and Sbc types. The resulting classification is indicated in column 6. Identification is possible when at least two out of the three computed colors are consistent with the given type. We note that in 3 cases, the 3 colors agree. We compare this color-based type to the spectral type presented in Table Spectroscopic observations of eight supernovae at intermediate redshift. We find general agreement between the various identifications, except for SN 2002lo for which the color based identification yields a type 2 whereas the spectroscopic identification is for a type 1 host.
5.5 The case of SN 2002lk
The presence of a strong Na iD doublet ( absorption line in the spectra of SN 2002lk allows for a determination of the color excess for this object. Unfortunately, at the redshift of SN 2002lk, the Na iD line falls at (in the observer frame; see Fig. 7 and 8), that is at the junction between the blue and the red part of the spectrum. Hence, the measurement of the equivalent width of the Na iD line is quite uncertain (), as this part of the spectrum is most sensitive to possible errors in flux calibration. Using Barbon et al. (1990) and Turatto et al. (2003) empirical correlation between equivalent width and color excess, we estimate . We note that these high values, mostly due to dust absorption in the dense lane visible on the detection images of SN 2002lk, are consistent with the high value obtained by Phillips et al. (1999) for SN 1986G. The Galaxy contribution to the reddening is negligeable with mag. (Schlegel et al., 1998). We have dereddened the June 10th spectrum of SN 2002lk using various ranging from 0.5 to 1.2 with 0.1 increase step, and for each dereddened spectrum we have searched for the best-fit template using -fit. The best-fit is obtained for (in fair agreement with a preliminary fit to the light-curve of SN 2002lk yielding ) and has been presented in Fig. 8. This is well matched by an underluminous SN Ia template a few days before maximum. No satisfactory solution is obtained when the same dereddened spectrum is fitted with Nobili’s template around maximum. We need to go to higher phase ( days) to get solution with values comparable with the underluminous solution. However, in this case, the phase is no longer consistent with the photometric phase of this SN.
6 Discussion and concluding remarks
With the SDSS-II results to come, the sample of SN Ia at intermediate redshift will increase by an order of magnitude. At present, the SN Ia in this redshift range amount to approximately 35. Our two searches in 1999 and 2002 represent half of them. Indeed, excluding the peculiar SN 2002lk and the two type-II of the present sample, the set of spectra presented in this paper, combined with the spectra of Balland et al. (2006), provides a total of seventeen spectra of normal SN Ia at intermediate redshift. This total sample constitutes a homogeneous set of spectra in terms of signal-to-noise ratio, wavelength coverage and resolution. Phases sample the range 11 to +9 days222Except for SN 1999dr found at 24 days past maximum. in a regular way, with a majority around maximum light, and redshifts range between and . For the 2002 SN Ia alone, we classify 20 % of the hosts as type 0, 60% as type 1 and 20% as type 2. These numbers are very similar to those obtained for the 1999 SN Ia sample (18, 58 and 25% respectively). Put altogether, we find 18% of type 0, 59% of type 1 and 23% of type 2. About 82% of the hosts of our total sample are spirals, in good agreement with the results of Sullivan et al. (2003) for their low redshift sample: they find 12%(0), 56%(1) and 32%(2), that is 88% of spirals for SN Ia at .
We have searched for peculiarities in the spectra of the seventeen SN Ia of the total sample. Although a full computation of the rate of peculiar objects at intermediate redshift would imply an assessment of the detection efficiency of such objects in our surveys through detailed Monte-Carlo simulations, we can draw a first conclusion from the analyses of this paper and of Balland et al. (2006). We found 0 peculiar objects in the 1999 sample. The same result is obtained in the 2002 sample as the F-test can not discriminate between an SN 1999aa and a normal best-fit solution for SN 2002li. Thus, for our total sample, two might be spectrally overluminous, leading to an upper limit estimate of 12 of the full sample, perfectly consistent with the 12% found by Li et al. (2001a) in Monte-Carlo simulations for a magnitude-limited survey with a 20 day baseline such as ours, with an extra R-band extinction for overluminous objects of 0.8 mag and an age-bias cutoff of 7 days. This however contrasts with the 36% of peculiar objects found in local samples (Li et al., 2001b). In high redshift samples, no peculiar objects have been reported (Perlmutter et al., 1999; Riess et al., 1998). It is interesting that our estimated percentage of peculiar objects at intermediate redshift falls in between the values for low- and high-redshift samples, as it suggests a continuous sequence in the rate of peculiar SN Ia with redshift.
This paper has presented spectra of five Branch-normal SN Ia and of two type II-P supernovae, all at intermediate redshift, observed as part of an international time program on ” and from Supernovae, and the Physics of Supernova Explosions”, performed in May and June 2002. In addition, three spectra of an underluminous supernova at low redshift have been taken during two consecutive nights in June 2002. This supernova (SN 2002lk) is interesting, in addition to being underluminous, it sits in a dust lane of its host galaxy and it is consequently very reddened (E(B-V) 0.9). It closely ressembles SN 1986G, and spectra of this latter supernova around maximum provide a reasonable fit to SN 2002lk. Once dereddened, the spectra of SN 2002lk are well fitted by SN 1991bg-like supernovae. We conclude that, from a spectroscopic point of view, SN 2002lk belongs to this class of underluminous supernovae.
Regarding SN Ia alone, the new set presented in this paper, added to the spectra of Balland et al. (2006), provides more than fifteen spectra of supernovae in the still largely unexplored intermediate redshift range . In this paper, we have concentrated on some physical properties of the SN Ia in this redshift range.
Regarding the phase and redshift distribution, our global sample is representative of a population of type Ia supernovae around maximum light. The use of both the blue and red arms of the ISIS spectrometer for the present sample gives access to the UV part of spectra down to . This was also the case for the two April spectra in 1999 (Balland et al., 2006). This part of the spectrum is expected to be sensitive to metallicity and will be interesting to study in larger scale samples.
As far as host types are concerned, the analysis of this new set of SN Ia confirms the fractions of Hubble types of host populations found in other samples at lower or higher redshift. This conclusion, that reinforces the idea that no systematic difference exists in supernova populations at different redshifts was not so clear in our 1999 sample. The inclusion of this new set in our analysis allows us to conclude more firmly on this matter.
Finally, our analysis reveals that very few if any of these supernovae at intermediate redshift show signatures of peculiarities, contrary to what is observed in low-redshift samples. In particular, no overluminous supernova is found, although we have undertaken a specific search of these supernovae, both by fitting our data with peculiar spectral templates and by a close examination of the ejection velocities of some spectral features that are a potential signature of peculiarity. This is somewhat contradictory with what one could have expected, as overluminous supernovae are often found in regions of active star formation (Li et al., 2001a), more numerous at high redshift. Although based on a still low number sample, this fact is an important conclusion regarding the potential contamination of the Hubble diagram by such objects.
Acknowledgements.
The observations described in this paper were obtained, as part of the International Time Programme on and from Supernovae, and the Physics of Supernova Explosions, as visiting/guest astronomers at the INT and WHT, operated by the Royal Greenwich Observatory at the Spanish Observatorio del Roque de los Muchachos of the Instituto de Astrofisica de Canarias. We thank the dedicated staffs of these observatories for their assistance. We also thank A.-L. Huat for her participation in reducing the data during her master training period. S. Fabbro, A.-M. Mourão and R. Pascoal thank the support by Fundação para a Ciência e Tecnologia under project POCTI/FNU/43749/2001.References
- Aldering et al. (2002) Aldering, G., Adam, G., Antilogus, P., et al. 2002, in Survey and Other Telescope Technologies and Discoveries. Edited by Tyson, J. Anthony; Wolff, Sidney. Proceedings of the SPIE, Volume 4836, pp. 61-72 (2002)., ed. J. A. Tyson & S. Wolff, 61–72
- Altavilla et al. (2005) Altavilla, G., Ruiz-Lapuente, P., Balastegui, A., et al. 2005, in ASP Conf. Ser. 342: 1604-2004: Supernovae as Cosmological Lighthouses, ed. M. Turatto, S. Benetti, L. Zampieri, & W. Shea, 486
- Anupama et al. (2005) Anupama, G. C., Sahu, D. K., & Jose, J. 2005, A&A, 429, 667
- Astier et al. (2006) Astier, P., Guy, J., Regnault, N., et al. 2006, A&A, 447, 31
- Balland et al. (2006) Balland, C., Mouchet, M., Pain, R., et al. 2006, A&A, 445, 387
- Barbon et al. (1990) Barbon, R., Benetti, S., Rosino, L., Cappellaro, E., & Turatto, M. 1990, A&A, 237, 79
- Barris et al. (2004) Barris, B. J., Tonry, J. L., Blondin, S., et al. 2004, ApJ, 602, 571
- Basa et al. (2006) Basa, S., Filiol, M., Baumont, S., et al. 2006, A&A, in prep.
- Benetti et al. (2005) Benetti, S., Cappellaro, E., Mazzali, P. A., et al. 2005, astro-ph, 0411059
- Benetti et al. (2004) Benetti, S., Meikle, P., Stehle, M., et al. 2004, MNRAS, 348, 261
- Coleman et al. (1980) Coleman, G. D., Wu, C.-C., & Weedman, D. W. 1980, ApJS, 43, 393
- Elmhamdi et al. (2003) Elmhamdi, A., Danziger, I. J., Chugai, N., et al. 2003, MNRAS, 338, 939
- Filippenko et al. (2001) Filippenko, A. V., Li, W. D., Treffers, R. R., & Modjaz, M. 2001, in ASP Conf. Ser. 246: IAU Colloq. 183: Small Telescope Astronomy on Global Scales, ed. B. Paczynski, W.-P. Chen, & C. Lemme, 121
- Frei & Gunn (1994) Frei, Z. & Gunn, J. E. 1994, AJ, 108, 1476
- Fukugita et al. (1996) Fukugita, M., Ichikawa, T., Gunn, J. E., et al. 1996, AJ, 111, 1748
- Garavini et al. (2004) Garavini, G., Folatelli, G., Goobar, A., et al. 2004, AJ, 128, 387
- Garnavich et al. (2004) Garnavich, P. M., Bonanos, A. Z., Krisciunas, K., et al. 2004, ApJ, 613, 1120
- Hachinger et al. (2006) Hachinger, S., Mazzali, P. A., & Benetti, S. 2006, MNRAS, 370, 299
- Hamuy et al. (2002) Hamuy, M., Maza, J., Pinto, P. A., et al. 2002, AJ, 124, 417
- Hamuy et al. (2001) Hamuy, M., Pinto, P. A., Maza, J., et al. 2001, ApJ, 558, 615
- Hook et al. (2005) Hook, I. M., Howell, D. A., Aldering, G., et al. 2005, AJ, 130, 2788
- Horne (1986) Horne, K. 1986, PASP, 98, 609
- Howell et al. (2005) Howell, D. A., Sullivan, M., Perrett, K., et al. 2005, ApJ, 634, 1190
- Jha et al. (1999) Jha, S., Garnavich, P. M., Kirshner, R. P., et al. 1999, ApJS, 125, 73
- King (1985) King, D. 1985, ING Tech Note No 31
- Kinney et al. (1996) Kinney, A. L., Calzetti, D., Bohlin, R. C., et al. 1996, ApJ, 467, 38
- Kirshner et al. (1993) Kirshner, R. P., Jeffery, D. J., Leibundgut, B., et al. 1993, ApJ, 415, 589
- Li et al. (2001a) Li, W., Filippenko, A. V., & Riess, A. G. 2001a, ApJ, 546, 719
- Li et al. (2001b) Li, W., Filippenko, A. V., Treffers, R. R., et al. 2001b, ApJ, 546, 734
- Matheson et al. (2005) Matheson, T., Blondin, S., Foley, R. J., et al. 2005, AJ, 129, 2352
- McMahon et al. (2001) McMahon, R. G., Walton, N. A., Irwin, M. J., et al. 2001, New Astronomy Review, 45, 97
- Nobili et al. (2003) Nobili, S., Goobar, A., Knop, R., & Nugent, P. 2003, A&A, 404, 901
- Patat et al. (1996) Patat, F., Benetti, S., Cappellaro, E., et al. 1996, MNRAS, 278, 111
- Perlmutter et al. (1999) Perlmutter, S., Aldering, G., Goldhaber, G., et al. 1999, ApJ, 517, 565
- Phillips et al. (1999) Phillips, M. M., Lira, P., Suntzeff, N. B., et al. 1999, AJ, 118, 1766
- Phillips et al. (1987) Phillips, M. M., Phillips, A. C., Heathcote, S. R., et al. 1987, PASP, 99, 592
- Press et al. (1992) Press, W. H., Flannery, B. P., Teulkolsky, S. A., & Vetterling, W. T. 1992, Cambridge U. Press, New York, N.Y.
- Riello et al. (2003) Riello, M., Altavilla, G., Cappellaro, E., et al. 2003, in From Twilight to Highlight: The Physics of Supernovae, ed. W. Hillebrandt & B. Leibundgut, 400
- Riess et al. (1998) Riess, A. G., Filippenko, A. V., Challis, P., et al. 1998, AJ, 116, 1009
- Ruiz-Lapuente et al. (2005) Ruiz-Lapuente, P., Balastegui, A., Sainton, G., Pascoal, R., & Amanullah, R. 2005, IAU Circ., 7406, 1
- Sainton (2004) Sainton, G. 2004, PhD thesis, Université Claude Bernard, Lyon 1
- Sako et al. (2005a) Sako, M., Barentine, J., Bassett, J., et al. 2005a, in Bulletin of the American Astronomical Society, 1408
- Sako et al. (2005b) Sako, M., Romani, R., Frieman, J., et al. 2005b, astro-ph, 0504455
- Schlegel et al. (1998) Schlegel, D. J., Finkbeiner, D. P., & Davis, M. 1998, ApJ, 500, 525
- Sullivan et al. (2003) Sullivan, M., Ellis, R. S., Aldering, G., et al. 2003, MNRAS, 340, 1057
- Turatto et al. (2003) Turatto, M., Benetti, S., & Cappellaro, E. 2003, in From Twilight to Highlight: The Physics of Supernovae, ed. W. Hillebrandt & B. Leibundgut, 200
- Walton et al. (1999) Walton, N. A., Irwin, M., McMahon, R., & Lewis, J. R. 1999, The Newsletter of the Isaac Newton Group of Telescopes (ING Newsl.), issue no. 1, p. 3-5, 1, 3


[l]llccccccc
Log of Spectroscopic Observations (WHT+ISIS)
SN R.A. (2000.0) Dec. (2000.0) Date g’ Date of JD Exposure time (s) Resolution
hh mm ss o ’ ” of Discovery (2002) mag Spectroscopy +2400000 Blue/Red ()
\endfirsthead2002li 15:59:03.08 +54:18:16.0 Jun. 4 20.6 Jun. 10 52436.6 3900 8.3
2002lj 16:19:19.65 +53:09:54.2 Jun. 5 19.7 Jun. 11 52437.4 2900 7.2
2002lk (a) 16:06:55.92 +55:28:18.2 Jun. 6 18.3 Jun. 10 52436.4 300+600 8.4
2002lk (b) Jun. 11 52437.4 600 8.2
2002ln 16:39:24.93 41:47:29.0 Jun. 6 22.5 Jun. 10 52436.6 2900 8.4
2002lo 16:39:56.42 +42:19:20.5 Jun. 6 21.9 Jun. 11 52437.6 2900 7.1
2002lp 16:40:11.45 +42:28:30.2 Jun. 6 20.4 Jun. 10 52436.5 2900 8.3
2002lq 16:40:28.83 +41:14:09.1 Jun. 6 21.9 Jun. 10 52436.4 2900 8.4
2002lr 22:33:12.59 +01:05:56.7 Jun. 6 20.8 Jun. 10 52436.7 2900 8.3
Notes:
† Approximate magnitude at discovery
‡ Full width at half maximum of [OI] night-sky line at 5577
[c]lccccccc
Results from -fit
SN Best fit SN % (host)† Spectroscopic Reduced d.o.f.∗
name template (reference) phase‡
2002li 03du (Anupama et al. 2005) 50(Sa) 0.327 0.328 -7 1.21 827
2002lj 92A (Kirshner et al. 1993) 13(Sa) 0.181 0.183 +7 2.57 1217
2002lk (Jun. 10) 86G (Phillips et al. 1987) 35(S0) 0.023 0.033 +2 6.83 999
2002lk (Jun. 11) 86G (Phillips et al. 1987) 26(S0) 0.024 0.033 +2 3.26 954
2002lk (dereddened)∗∗ 99by (Garnavich et al. 2004) 19(S0) 0.022 0.033 -4 8.16 1205
2002ln 99em (Hamuy et al. 2001) 38(Sb) 0.144 0.143 +23∗∗∗ 0.954 1486
2002lo 99em (Hamuy et al. 2001)55(Sa) 0.144 0.136 +13∗∗∗ 1.29 1030
2002lp 92A (Kirshner et al. 1993) 46(S0) 0.146 0.137 +3 2.59 1135
2002lq 94D (Patat et al. 1996) 37(Sa) 0.275 0.274 -11 0.81 859
2002lr 92A (Kirshner et al. 1993) 42(Sa) 0.256 0.258 +9 0.83 908
Notes:
† %(host) = (see text)
‡ Typical error is days
∗ Number of degrees of freedom
∗∗ Spectrum dereddened using Howarth (1983) law and E(B-V)=0.9; see text
∗∗∗ With respect to explosion date
[c]lccc
SN expansion velocities
SN Name Phase
2002li -7 -16900 -13000
2002lj +7 -13300 -10000
2002lk (Jun. 10) +2 -13550
2002lp +3 -13800 -10400
2002lq -11 -22950
2002lr +9 -12200 -8600
Notes:
a Ca H& K in km/s; typical error is 500 km/s
b Si ii in km/s; typical error is 200 km/s
[c]ccccccccc
Results from-fit using peculiar SN Ia templates
SN Peculiar
Normal
F-test
—————————————— —————————– probability (%)
Best-fit Phase d.o.f. Phase d.o.f.
2002li 99aa1 -7 1.16 811 -7 1.21 827 0.34
2002lj 99aa +14 2.99 1276 +7 2.57 1217 1.1
2002lp 99by2 -5 3.38 1251 +3 2.59 1135 4.4
2002lq 99aa -7 0.84 896 -11 0.81 859 0.30
2002lr 91T3 -12 1.03 988 +9 0.83 908 6.2
Notes:
1 Spectral template from Garavini et al. (2004)
2 Spectral template from Garnavich et al.(2004)
3 Spectral template from Mazzali et al. (1995)
[c]lcc
Spectroscopic and light-curve dates of maximum for the five photometrically followed-up SN Ia
SN Date of B max. (restframe) Maximum date
2002li 13/06 17/06
2002lj 31/05 03/06
2002lk (Jun. 10) 13/06 14/06
2002lo 25/05 02/06
2002lp 13/06 07/06
2002lq 21/06 21/06
2002lr 28/05 01/06
Notes:
Date estimated from the date of
spectroscopic observation corrected for the best-fit spectroscopic phase
[c]ccccc
SN host spectral classification.
SN Indicators∗ Comments Host Spectral
-fit
type†
2002li s. [OII], s. [OIII], s. B4000, Ca H&K, s. H, NaD early spiral 1 Sa
2002lj w. [OII], w. H, ? very weak gal. features 1 ? Sa
2002lk s. NaD, H, [NII] early spiral on detection images 1 S0
2002ln H very few features 1 Sb
2002lo H, H, H, H, [OII], [OIII], NaD spiral 1 Sa
2002lp H?, w. [OII], w. [OIII] weak features 0 S0
2002lq H, H, s. [OII], s. [OIII] early spiral 2 Sa
2002lr [OII], [OIII], H ? spiral 1 Sa
Notes:
† Type 0: spheroidal (E/S0); Type 1: early-type spiral (Sa/Sb); Type 2: late-type spiral (Sc/Starburst)
∗ B4000=4000Å break, s.=strong, w.=weak
[c]cccccc
Host galaxy SDSS colors corrected for Milky-Way extinction†
SN E(B-V) B-V g’-r’ u’-g’ Color-based host type
2002li 0.011 1.09 0.91 0.69 1
2002ln 0.008 1.55 1.39 -0.55 1
2002lo 0.011 0.70 0.50 0.98 2
2002lp 0.011 1.08 0.90 1.75 0
2002lq 0.008 0.93 0.75 0.92 2
2002lr 0.09 1.07 0.89 0.72 1
Note:
Computations based on magnitudes from SDSS query page. No information on SN 2002lj or SN 2002lk has been found.