Magnetoacoustic shocks as driver of quiet Sun mottles
Abstract
We present high spatial and high temporal resolution observations of the quiet Sun in H obtained with the Swedish 1-m Solar Telescope on La Palma. We observe that many mottles, jet-like features in the quiet Sun, display clear up- and downward motions along their main axis. In addition, many mottles show vigorous transverse displacements. Unique identification of the mottles throughout their lifetime is much harder than for their active region counterpart, dynamic fibrils. This is because many seem to lack a sharply defined edge at their top, and significant fading often occurs throughout their lifetime. For those mottles that can be reliably tracked, we find that the mottle tops often undergo parabolic paths. We find a linear correlation between the deceleration these mottles undergo and the maximum velocity they reach, similar to what was found earlier for dynamic fibrils. Combined with an analysis of oscillatory properties, we conclude that at least part of the quiet Sun mottles are driven by magnetoacoustic shocks. In addition, the mixed polarity environment and vigorous dynamics suggest that reconnection may play a significant role in the formation of some quiet Sun jets.
1 Introduction
The solar chromosphere in magnetically enhanced regions is dominated by jet-like features. At the limb, they are referred to as spicules, in active region plage as dynamic fibrils (DFs), and as mottles in the quiet Sun, where they appear in close vicinity of small flux concentrations in the magnetic network. No consensus has been reached on how these phenomena are related (Grossmann-Doerth & Schmidt, 1992; Sterling, 2000) although it has been suspected for a long time that dark mottles observed on the disk are the counterparts of the limb spicules, and that the driving mechanism of these jets have the same origin (Tsiropoula et al., 1994; Suematsu et al., 1995; Christopoulou et al., 2001).
One of the main obstacles for a solid interpretation has been the difficulty to observationally resolve these less than 1″ wide and short-lived features (3–10 min) that reach heights between 3 and 10 Mm, with quiet Sun jets typically higher than those in active regions. Major progress has been made through the use of advanced image processing in combination with adaptive optics on the Swedish 1-m Solar Telescope. Near diffraction-limited (120 km) time series in H at extremely high temporal resolution (1 s) have clearly resolved the dominant temporal and spatial evolution of DFs (Hansteen et al., 2006; De Pontieu et al., 2007a).
These time series were compared to advanced radiative MHD simulations and it was demonstrated that the formation of magneto-acoustic shocks drives the dynamical evolution of fibrils. The simulations of Hansteen et al. (2006) and De Pontieu et al. (2007a) expand on the work of De Pontieu et al. (2004) who proposed that photospheric oscillations and convective flows can leak into the chromosphere, where they shock and drive jets upwards.
The same observational techniques have been exploited to obtain high quality time series of quiet Sun mottles. The combination of high spatial resolution and high temporal cadence is instrumental to firmly establish the dynamical properties of mottles. As it turns out, this observational requirement could be even more crucial for quiet Sun mottles than for active regions DFs.
2 Quiet Sun observations
The observations were obtained with the Swedish 1-m Solar Telescope (SST, Scharmer et al., 2003a) on La Palma, using the adaptive optics system (AO, Scharmer et al., 2003b) in combination with the Multi-Object Multi-Frame Blind Deconvolution (MOMFBD, van Noort et al., 2005) image restoration method. The Solar Optical Universal Polarimeter (SOUP, Title & Rosenberg, 1981) provided narrow band images in the H line. The FOV was about 65″ 65″ with a pixel scale of 065 (the SST diffraction limit at 656.3 nm is 0165 or 120 km). More details on the optical setup and data processing can be found in De Pontieu et al. (2007a). Sets of 37 exposures were included in the restorations, resulting in several near-diffraction limited H line core time series with 1 s cadence: here we analyse a 48 min series from 18-Jun-2006 (observing angle , or ), and 16 min from a 46 min series further towards the limb () from 21-Jun-2006. In addition, from the same target area of 21-Jun-2006, we obtained a 54 min Doppler series, with SOUP alternating between the blue and red wings at pm from the line core at a cadence of 18.4 s. Both target areas covered quiet Sun, each featuring at least one prominent rosette structure that hosts several dark mottles at any moment. Such rosettes are associated with magnetic network that consists of strong flux concentrations in the photosphere (see H sample images in Fig. 1).
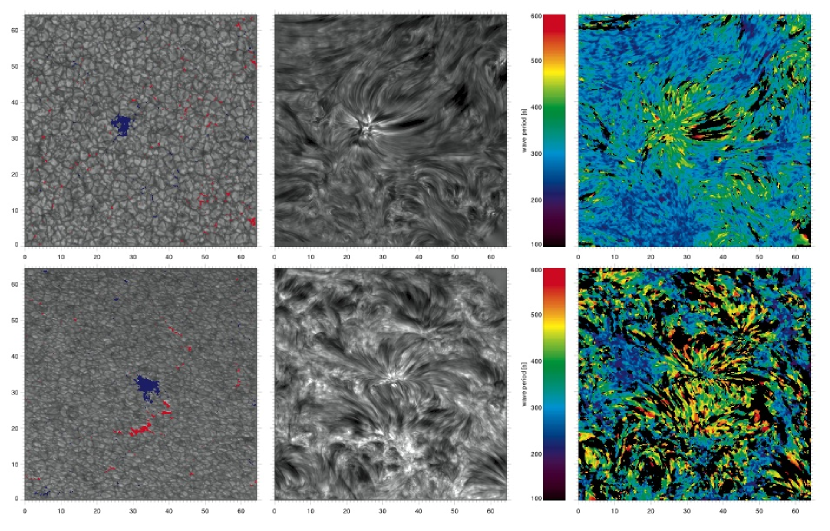
Before and after the H sequences, Fe I 630.2 nm Stokes V magnetograms were recorded with SOUP to provide context information about the magnetic field topology. The predominantly mixed polarity magnetic fields (see left panels of Fig. 1) lead to a very diverse appearance of dark and bright features in both regions, which seem to have more complex structuring than in active regions. Active regions are dominated by both long, horizontal and relatively stable fibrils, and short dynamic fibrils. The quiet Sun has equivalent features: long horizontal dark mottles and short dynamic mottles, both connecting to the stronger field concentrations in the network. In addition, quiet Sun shows many short, highly curved and highly dynamic features that do not seem to be associated with network, but mostly appear in the internetwork. An example of such region can be seen in the lower right part of top-center panel of Fig. 1. These internetwork features can often be seen underneath the canopy-like long horizontal mottles, so they seem to be formed at lower heights. This suggests that their dynamics might be associated with the underlying granular dynamics.
3 Analysis and results
It is generally more difficult to track quiet Sun mottles during their lifetime than dynamic fibrils, their active region counterparts. An important reason for this difficulty is that many mottles lack the sharply defined edge at the “top” end that characterizes the appearance of DFs in active regions. In addition, during their lifetime, some mottles display significant fading that appears to be induced by changing opacity. Furthermore, most mottles undergo not only up and downward motions along the direction of the magnetic field, but also significant transverse motions. All these factors often contribute to line-of-sight superposition, which renders unique identification throughout the lifetime of the mottle quite challenging.
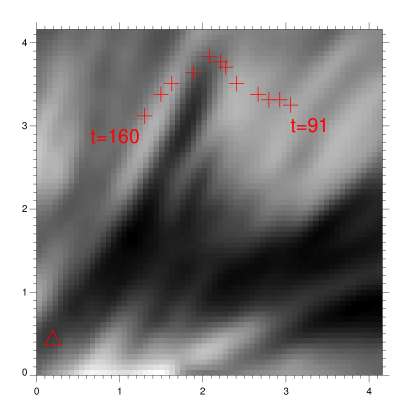
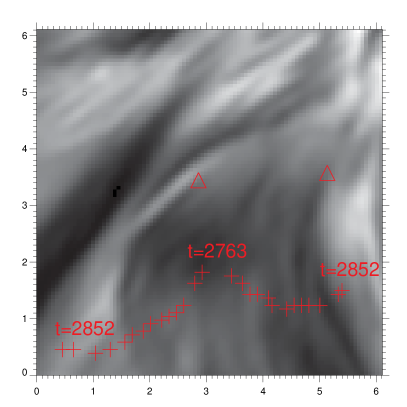
Figure 2 shows some examples of the motion of dark mottles. In the left panel, the speed transverse to the mottle axis exceeds 20 km s-1 and the transverse displacement is over 2″ during 70 s. The 2 mottles in the right panel display similar speeds and displacements. Many mottles generally undergo some transverse motion, with typical velocities between 5 and 30 km s-1, although larger apparent velocities are also present. We should also note that visual inspection of movies indicates that what appears as a transverse motion may sometimes be an artifact of complicated radiative transfer effects combined with coherent wave-driven motion with phase delay between neighboring (parallel) field lines. Such coherence and phase delays have also been observed in active region fibrils (Hansteen et al., 2006; De Pontieu et al., 2007a).
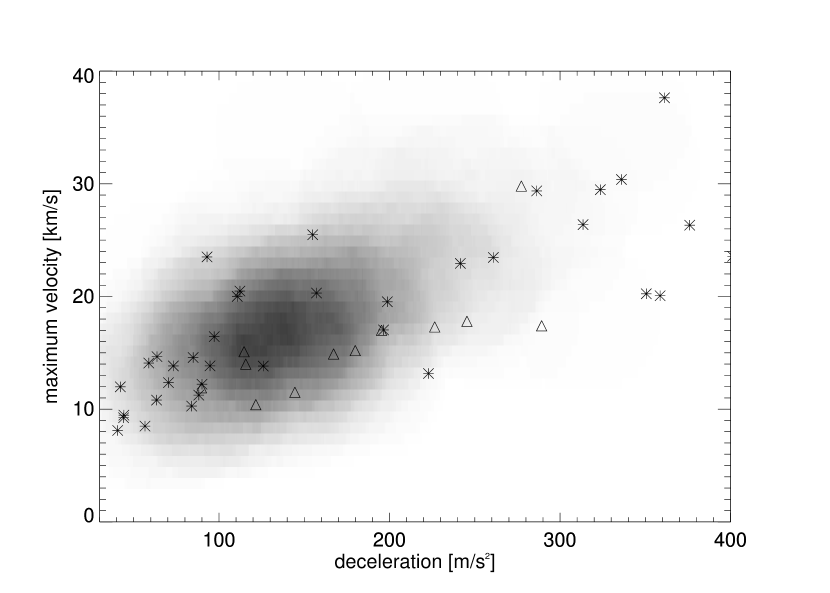
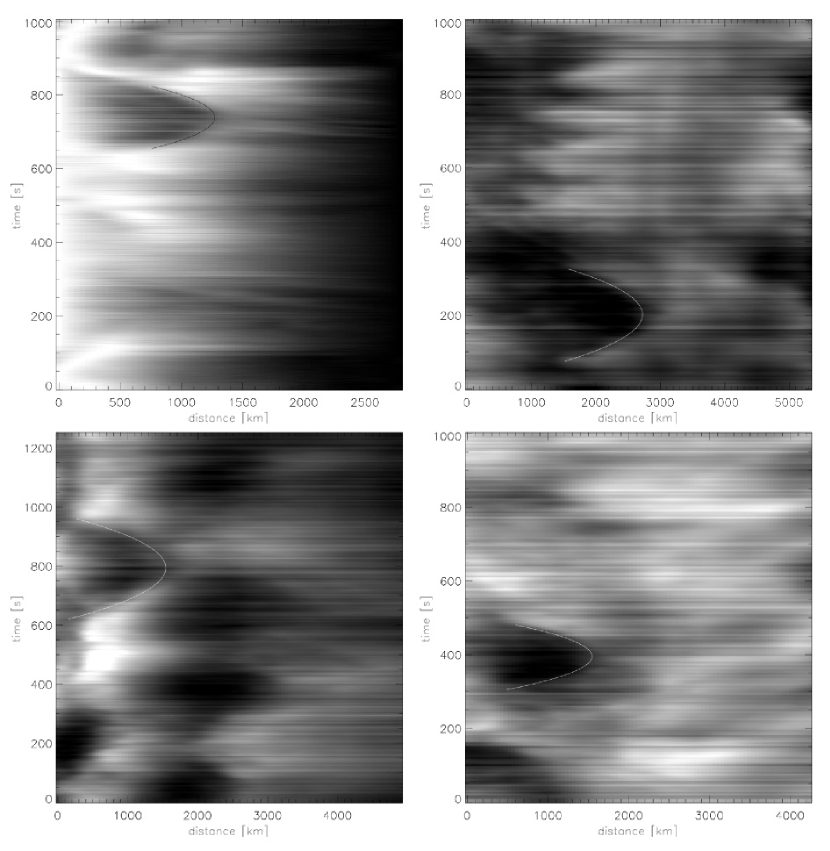
Despite the general difficulty with tracing individual mottles, some mottles have a sharply-defined top end and do not show as much transverse motion, so that space-time cuts along the mottle axis can be extracted. In such cases, we find that the mottle top often undergoes a parabolic path, similar to active region fibrils. Parabolic paths had earlier been suggested by Suematsu et al. (1995) who used H data with much lower resolution than used here. The unprecedented temporal and spatial resolution of our data for the first time resolves the parabolic paths of mottles, as shown in Fig. 3. Following Hansteen et al. (2006) and De Pontieu et al. (2007a), we calculate decelerations and maximum velocities for the parabolic paths of 49 quiet Sun mottles in our data. Figure 4 shows that the deceleration and maximum velocity of these mottles is linearly correlated. This correlation and the slope between deceleration and maximum velocity is similar to the one found for DFs, as can be seen in Fig. 4 (grey-scale background). Note that the range of decelerations and maximum velocities extends to somewhat higher values than for DFs. This could be caused by the fact that the viewing geometry of quiet Sun mottles is more diverse, leading to fewer systematic projection effects, so that relatively more mottles are oriented perpendicular to the line-of-sight. The similarity of mottles and fibrils in the range of values of maximum velocity and deceleration, and their linear correlation strongly suggests that these features have a similar driving mechanism. Jets with similar properties have also been found in recent numerical simulations (Hansteen et al., 2006; De Pontieu et al., 2007a, b). This work showed that the correlation between deceleration and maximum velocity is a clear sign that these jets are driven by single slow-mode magnetoacoustic shocks. The correlation is a natural consequence of ”N”-shaped shocks (see Fig. 4 of De Pontieu et al., 2007b). Such a shock wave driving mechanism is also supported by the observational finding that there are no mottles (or fibrils) with maximum velocities lower than 8 km/s, the chromospheric speed of sound. Additional support comes from the finding of a number of mottles that have significantly higher deceleration than solar surface gravity (274 m s-2). The deceleration is not related to gravity, but completely determined by shock wave physics, i.e., the initial pressure pulse, and the subsequent pressure gradient (Heggland et al., 2007). As a result decelerations larger than solar gravity can occur for fibrils driven by shock waves with large amplitude and short periods.
A wavelet analysis of the dominant oscillatory behavior (Torrence & Compo, 1998) was performed on the line-core sequence of 18-Jun-2006 and the inner-wing sequence of 21-Jun-2006. The map of dominant wave power of the line-core series (upper right panel of Fig. 1) shows significant wavelet power for at least two wave periods. The mottles and loops emanating from the network region around (25″, 30″) are all dominated by oscillatory behaviour with periods around 5–7 minutes, with some of the longer and lower-lying loops dominated by periods of up to 10 minutes. This finding is compatible with the idea that leakage of global oscillations from the photosphere (with dominant periods around 5 minutes) are important in the formation and dynamics of network-associated mottles. The internetwork regions, such as the lower left region, show periods that are closer to 3 minutes. This suggests that internetwork regions (where the field is not as dominant) are dominated by waves with periods around the chromospheric acoustic cutoff period of 3 minutes. It is interesting to note that the 3 min power is also often visible in regions where the long, low-lying loops, e.g. around (45″, 45″), that are typically dominated by longer periods, start to become transparent. This suggests that in such regions lower opacity of the overlying loops allows glimpses of the internetwork dynamics and oscillations underneath.
A similar picture emerges from the H pm summed time series shown in the lower right panel of Fig. 1. The network-associated loops are dominated by periods of 5 min or longer (e.g., around 35″, 35″), whereas the internetwork regions (e.g., around 15″, 40″) are dominated by 3 minute oscillations. This again strongly suggests that leakage of photospheric oscillations into the chromosphere dominates much of the dynamics of the quiet network chromosphere. There is a hint that right at the center of the network regions, periods closer to 3 minutes appear to occur more often (e.g., at 33″, 35″). This is presumably where the field is more vertical, so that the acoustic cutoff period reverts to its nominal 3 min value (similar to the dense plage region in Hansteen et al., 2006). We also see slightly longer periods dominating the loops connecting two opposite polarity network regions (one centered at 35″, 32″, and one at 30″, 18″). These longer periods are reminiscent of the periods that are seen in low-lying long fibrils that originate in sunspots or strong plage (De Pontieu et al., 2007a). This may not be a coincidence, as the quiet network regions shown here actually contain a stronger than usual amount of magnetic flux (some tiny pores are even visible in the continuum images).
4 Conclusions
The parabolic paths, correlation between deceleration and maximum velocity and oscillatory properties of quiet Sun mottles strongly suggest that the mechanism that drives active region dynamic fibrils is also responsible for the formation of at least a subset of quiet Sun mottles. This is not surprising, since all of the ingredients of the fibril mechanism are also present in quiet Sun: global oscillations and convective flows that are guided into the chromosphere along magnetic field lines. How is this mechanism modified under quiet Sun conditions? The generally weaker magnetic fields of the quiet Sun imply that the height of the plasma surface is generally higher than in active region plage. That means that the field is less rigid at these heights: chromospheric flows and waves can influence the motion of magnetic field lines up to larger heights. A less rigid field would lead to a much more dynamic magnetic field at upper chromospheric heights, with significantly more transverse motions. This is exactly what we observe in our quiet Sun data. Mode coupling between different wave modes at the plasma surface can also be expected to play a large role in this magnetic environment (Bogdan et al., 2003). In fact, the 2D radiative MHD simulations of Hansteen et al. (2006) and De Pontieu et al. (2007a) clearly show that under weaker field conditions than found in active region plage, fast magnetoacoustic waves play a significant role in the dynamics of fibril-like jets. These fast modes propagate perpendicular to the fibril-axis, and can lead to a significant transverse motion of the whole fibril-like jet. More advanced 3D simulations will be necessary to determine the role of Alfvén waves in explaining transverse motions of mottles.
While we have focused on relatively “well-behaved” mottles here, our observations also show many examples where significant reorganizations of the magnetic field occur, with apparent (un?)twisting and motions at Alfvénic speeds. Such reorganizations are most probably signs of magnetic reconnection caused by the dynamic magneto-convective driving of mixed polarity fields in the quiet Sun. Given these observations and the evidence presented in the above for a fibril-like driving mechanism for quiet Sun mottles, it seems quite probable that both reconnection and chromospheric shock waves play a role in jet formation in quiet Sun. The presence of multiple driving mechanisms may well be the main reason why the spicule problem has been so difficult to resolve.
References
- Bogdan et al. (2003) Bogdan, T. J., et al. 2003, ApJ, 599, 626
- Christopoulou et al. (2001) Christopoulou, E., Georgakilas, A. A., & Koutchmy, S. 2001, Sol. Phys., 199, 61
- De Pontieu et al. (2004) De Pontieu, B., Erdélyi, R., & James, S. P. 2004, Nature, 430, 536
- De Pontieu et al. (2007a) De Pontieu, B., Hansteen, V. H., Rouppe van der Voort, L., van Noort, M., & Carlsson, M. 2007a, ApJ, 655, 624
- De Pontieu et al. (2007b) De Pontieu, B., Hansteen, V. H., Rouppe van der Voort, L., van Noort, M., & Carlsson, M. 2007b, in ASP Conf. Ser. 354 ed. P. Heinzel, I. Dorotovic & R.J. Rutten, in press
- Grossmann-Doerth & Schmidt (1992) Grossmann-Doerth, U. & Schmidt, W. 1992, A&A, 264, 236
- Hansteen et al. (2006) Hansteen, V. H., De Pontieu, B., Rouppe van der Voort, L., van Noort, M., & Carlsson, M. 2006, ApJ, 647, L73
- Heggland et al. (2007) Heggland, L., de Pontieu, B., & Hansteen, V. 2007, ApJ, submitted
- Scharmer et al. (2003a) Scharmer, G., Bjelksjö, K., Korhonen, T., Lindberg, B., & Petterson, B. 2003a, in Proc. SPIE., Vol. 4853, 341
- Scharmer et al. (2003b) Scharmer, G. B., Dettori, P. M., Löfdahl, M. G., & Shand, M. 2003b, in Proc. SPIE., Vol. 4853, 370
- Sterling (2000) Sterling, A. C. 2000, Sol. Phys., 196, 79
- Suematsu et al. (1995) Suematsu, Y., Wang, H., & Zirin, H. 1995, ApJ, 450, 411
- Title & Rosenberg (1981) Title, A. & Rosenberg. W. 1981, Optical Engineering, 20, 815
- Torrence & Compo (1998) Torrence, C. & Compo, G. 1998, Bull. Amer. Meteor. Soc., 79, 61
- Tsiropoula et al. (1994) Tsiropoula, G., Alissandrakis, C., & Schmieder, B. 1994, A&A, 290, 285
- van Noort et al. (2005) van Noort, M., Rouppe van der Voort, L., & Löfdahl, M. 2005, Sol. Phys., 228, 191