The SAURON project – IX. A kinematic classification for early-type galaxies.
Abstract
Two-dimensional stellar kinematics of 48 representative E and S0 galaxies obtained with the SAURON integral-field spectrograph reveal that early-type galaxies appear in two broad flavours, depending on whether they exhibit clear large-scale rotation or not. We define a new parameter , which involves luminosity weighted averages over the full two-dimensional kinematic field, as a proxy to quantify the observed projected stellar angular momentum per unit mass. We use it as a basis for a new kinematic classification: early-type galaxies are separated into slow and fast rotators, depending on whether they have values within their effective radius below or above 0.1, respectively. Slow and fast rotators are shown to be physically distinct classes of galaxies, a result which cannot simply be the consequence of a biased viewing angle. Fast rotators tend to be relatively low luminosity galaxies with . Slow rotators tend to be brighter and more massive galaxies, but are still spread over a wide range of absolute magnitude. Three slow rotators of our sample, among the most massive ones, are consistent with zero rotation. Remarkably, all other slow rotators (besides the atypical case of NGC 4550) contain a large kpc-scale kinematically decoupled core (KDC). All fast rotators (except one galaxy with well-known irregular shells) show well aligned photometric and kinemetric axes, and small velocity twists, in contrast with most slow rotators which exhibit significant misalignments and velocity twists. These results are supported by a supplement of 18 additional early-type galaxies observed with SAURON. In a companion paper (Paper X), we also show that fast and slow rotators are distinct classes in terms of their orbital distribution. We suggest that gas is a key ingredient in the formation and evolution of fast rotators, and that the slowest rotators are the extreme evolutionary end point reached deep in gravitational potential wells where dissipationless mergers had a major role in the evolution, and for which most of the baryonic angular momentum was expelled outwards. Detailed numerical simulations in a cosmological context are required to understand how to form large-scale kinematically decoupled cores within slow rotators, and more generally to explain the distribution of values within early-type galaxies and the distinction between fast and slow rotators.
keywords:
galaxies: elliptical and lenticular, cD – galaxies: evolution – galaxies: formation – galaxies: kinematics and dynamics – galaxies: structure1 Introduction
The origin of the classification fork for galaxies can be found in an early paper by Jeans (1929), with the S0s as a class being introduced by Hubble36 to account for the important population of flattened objects in nearby clusters (SB51). In a recent debate on galaxy classification, Sandage04 mentioned that the simplest definition of an S0 galaxy remains “a disc galaxy more flattened than an E6 elliptical but with no trace of spiral arms or recent star formation”. Elliptical (E) and lenticular (S0) galaxies are usually gathered into the so-called early-type category, and are recognised to share a number of global properties (RC3) such as their relatively low dust and interstellar gas content and their overall red colours. The Hubble sequence is however seen as a continuous one between ellipticals and spirals, with the S0s occupying the transition region with typical bulge to disc ratios of . S0s are thus considered disc-dominated galaxies, while Es are spheroid-dominated.
Such contrived galaxy types may be misleading, most evidently because “the sequence E0-E6 is one of apparent flattening” (KB96, hereafter KB96). A modern classification scheme should go beyond a purely descriptive tool, and should therefore encompass part of our knowledge of the physical properties of these objects111For the written transcript of a debate on this issue, see Sandage04 and the panel discussion in the same Proceedings.. This was advocated by KB96 who wished to update the Hubble sequence by sorting ellipticals in terms of the importance of rotation for their stellar dynamical state. They used the disciness or boxiness of the isophotes to quantify anisotropy and to define refined types: E(d) galaxies (for discy ellipticals) making the link between S0s and E(b) galaxies (for boxy ellipticals). The disciness (or boxiness) was then provided by a measure of the now classical normalised term (see BDM88, for details): positive and negative terms correspond to discy and boxy deviations from ellipses, respectively.
This extension of the Hubble types has the merit of upgrading our view of Es and S0s via some easily accessible observable parameter, and it follows the philosophy that a mature classification scheme should include some physics into the sorting criteria. It does, however, use a photometric indicator as an attempt to quantify the dynamical state of the galaxy, which may be unreliable. More importantly, it conserves the dichotomy between S0s and Es, relying on the old (and ambiguous) definition of an S0.
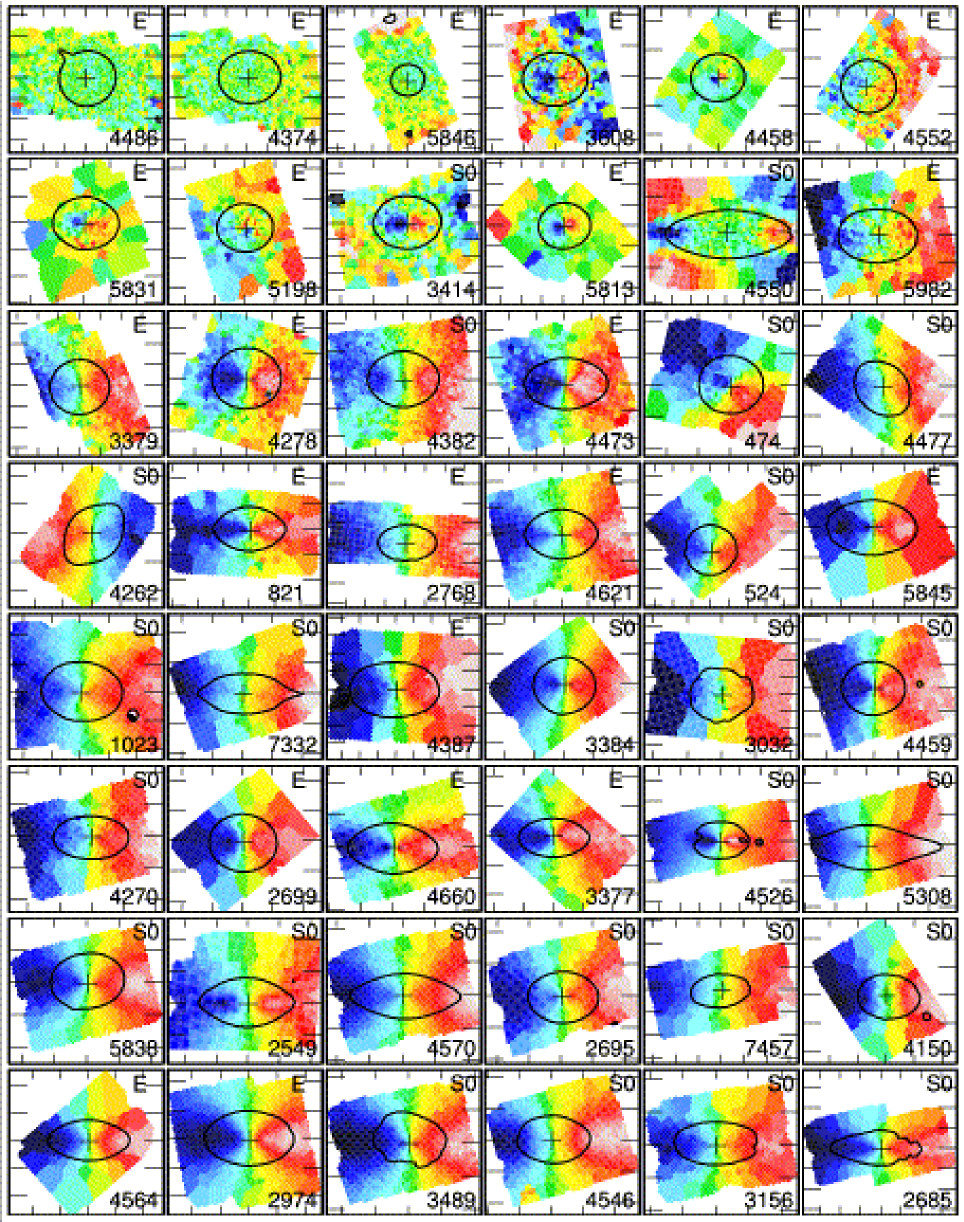
We have recently conducted a survey of 72 early-type (E, S0, Sa) galaxies using the integral-field spectrograph SAURON mounted on the William Herschel Telescope in La Palma (Bacon+01, hereafter Paper I; PaperII, hereafter Paper II). This allowed us to map the stellar and gas kinematics as well as a number of stellar absorption line indices up to about one effective radius for most of the galaxies in the sample. The two-dimensional stellar kinematics for the 48 E and S0 galaxies (Emsellem+04, hereafter Paper III) show a wide variety of features such as kinematically decoupled or counter-rotating cores, central discs and velocity twists. More importantly, there seem to be two broad classes of observed stellar velocity fields, with galaxies in one class exhibiting a clear large-scale rotation pattern and those in the other showing no significant rotation (Fig. 1). The existence of these two classes must be linked to the formation and evolution of early-type galaxies, and is in any case a key to understand their dynamical state (see also PaperIV, hereafter Paper IV).
Using the unique data set obtained in the course of the SAURON project, we here revisit the early-type galaxy classification issues mentioned above, using the available full two-dimensional kinematic information. A companion paper (PaperX, hereafter Paper X) examines in more detail the orbital anisotropy of elliptical and lenticular galaxies using the same data set. After a brief presentation of the data set and methods (Sect. 2), we define a new parameter as a proxy to robustly quantify the angular momentum of galaxies (Sect. 3). In Section 4, we examine how this parameter relates both to more standard photometric classification schemes including de Vaucouleurs morphological classification of Es and S0s (RC3), or the revision of the Hubble sequence by KB96, and kinemetric properties of early-type galaxies (Sect. 4.4). We then briefly discuss the implications of our results on the potential scenarios for the formation and evolution of these galaxies (Sect. 5), and conclude in Section 6.
2 Data and methods
2.1 The SAURON sample of E and S0s
The SAURON sample has been designed as a representative sample of 72 nearby () early-type galaxies in the plane of ellipticity versus absolute band magnitude . We restricted the sample to 24 objects for each of the E, S0 and Sa classes, with 12 ‘cluster’ and 12 ‘field’ targets in each group. Although this sample is itself not a complete one, it has been drawn in a homogeneous way from a complete sample of more than 300 galaxies (see Paper II for more details about the full SAURON sample). We will therefore solely focus on the SAURON ES0 sample (which thus contains 48 galaxies) for conducting our analysis in Sections 2 to 4. An additional set of 18 ES0 galaxies has been independently observed with a similar SAURON setup in the course of various other projects. These objects will be treated as “specials”, most having features which motivated a specific observation, and will be only briefly mentioned in Sect. 5 to confront the obtained results.
2.2 Photometry
Ground-based photometric MDM Observatory data (Falcón-Barroso et al. in preparation) were obtained for all galaxies of the SAURON sample. We also made use of additional Hubble Space Telescope WFPC2 data which are available for 42 galaxies out of the 48 E/S0. SAURON reconstructed images were used as well to directly derive a global ellipticity via moments of the surface brightness images as:
| (1) |
where and are the sky coordinates along the photometric major and minor axes respectively (see Paper X for details). The brackets correspond to a flux weighted sky average as in:
| (2) |
where the sums extends over a predefined region on the sky, with the number of pixels, and the flux value within the pixel. In the following Sections, we denote and as the global ellipticity computed from the SAURON data within 1 and or restricted to the equivalent effective aperture of the SAURON field of view, whichever is smaller. These will be used in Sect. 3, where we examine kinematic quantities derived from SAURON data as a function of the flux weighted global ellipticity.
We also obtained radial profiles for the ellipticity and (with the ellipse semi major-axis) parameters from the MDM and HST/WFPC2 photometric data sets using the GALPHOT package (Franx+89). We then derived and , the mean ellipticity and values within 1 , by taking the flux weighted average of the GALPHOT profiles taking into account the corresponding sky area. More specifically, the mean of a quantity within 1 derived from its radial profile, where is the semi major-axis radius, is defined as (see e.g. Ryden+99)
| (3) |
where and are respectively the best-fit ellipse axis ratio and surface brightness profiles. Using the sampled radial profiles, we approximate this with
| (4) |
where and correspond to the inner and outer radii of the annulus. The values for , and are provided in Table 1. Observed differences between and values are almost always smaller than 0.1, and due to their respective luminosity weighting. is measured directly from the SAURON data, and will therefore be confronted with other quantities measured from the same data set, while being derived from one-dimensional radial profiles can serve in comparison with previous works. For both and , the overall agreement between our values and published ones (BSG94) is excellent (see Paper X for a detailed comparison).
Results from fitting Sersic and Sersic-core laws (Trujillo04+; ACSVI) to the radial luminosity profiles will be presented in detail in a subsequent paper of this series (Falcón-Barroso et al., in preparation). In the present paper, we will only mention trends (Sect. 4.3), considering the Sersic index (where corresponds to an exponential luminosity profile, and to a de Vaucouleurs law), as well as the classification of the central photometric profiles with either shallow or steep inner cusps, labelled respectively as “cores” and “power-laws” (Faber+97; Rest+01; Ravindranath+01; Lauer+05).
2.3 The SAURON data
SAURON is an integral-field spectrograph built at Lyon Observatory and mounted since February 1999 at the Cassegrain focus of the William Herschel Telescope. It is based on the TIGER concept (Bacon+95), using a microlens array to sample the field of view. Details of the instrument can be found in Paper I and II. All 48 E and S0 galaxies were observed with the low resolution mode of SAURON which covers a field of view of about 33′′41′′with 094094 per square lens. Mosaicing was used to cover up to a radius of 1 . Only for the two galaxies with the largest (NGC 4486 and NGC 5846), do we reach a radius of only.
All data reduction was performed using the dedicated XSauron software wrapped in a scripted pipeline (Paper II). For each target, individual datacubes were merged and analysed as described in Paper III, ensuring a minimum signal-to-noise ratio of 60 per pixel using the binning scheme developed by CC03. The SAURON stellar kinematics were derived using a penalised pixel fitting routine (CE04), which provides parametric estimates of the line-of-sight velocity distribution (hereafter LOSVD) for each spaxel. In Paper III, we have presented the corresponding maps, which include the mean velocity , the velocity dispersion and the Gauss-Hermite moments and , for the 48 E and S0 SAURON galaxies.
As mentioned in Paper III, these quantities were measured fitting all , , and simultaneously: this ensures an optimal representation of the corresponding LOSVD. In the present paper, we focus on the first two true velocity moments, and , which are sometimes estimated by use of the Gauss-Hermite expansion of the LOSVD (vdMF93). As emphasised in Paper IV, the second order velocity moment is very sensitive to the details of the high velocity wings, which can rarely be accurately measured. We therefore decided to rely on a simpler but more robust single gaussian fit (excluding higher order velocity moments), and used the gaussian mean and standard deviation to approximate the first and second velocity moments.
2.4 Kinemetry
Following Krajnovic+06 who recently advocated the use of a method generalising the isophotal-shape tools (Lauer85; Jedr87; BM87), we employ kinemetry as a quantitative approach to analyse the SAURON stellar kinematic maps. Applying kinemetry on a velocity map provides radial profiles for the kinematic position angle PAkin, axis ratio , and Fourier kinemetry terms, the dominant term representing the velocity amplitude. We define a kinematic component to have constant or slowly varying PAkin and radial profiles (taking into account the derived error bars). We then identify two separate components when we observe an abrupt change either with , or PA, or a double-hump in with a local minimum in between. The transition between the two radial ranges is often emphasised by a peak in the higher order Fourier term, which thus serves as an additional signature for such a change (Krajnovic+06). Velocity maps which exhibit the presence of at least two stellar velocity components are tagged as Multiple Component (MC), as opposed to Single Component (SC).
We use a number of terms to represent some basic properties of the individual kinematic components via quantitative criteria, following the definitions provided in Krajnovic+06 :
-
•
Low-level velocity (LV): defined when the maximum velocity amplitude is lower than 15 . Note that when the velocity amplitude is constant over the field, PAkin and are ill-defined. When the central kinematical component is LV, we label the galaxy as a central low-level velocity (CLV) system.
-
•
Kinematic misalignment (KM): defined when the absolute difference between the photometric and kinemetric position angles (PAphot and PAkin) is larger than 10°.
-
•
Kinematic twist (KT): defined by a smooth variation of the kinematic position angle PAkin with an amplitude of at least 10° within the extent of the kinematic component.
A kinematically decoupled component (KDC) is defined as an MC having either an abrupt change in PAkin, with a difference larger than 20° between two adjacent components, or an outer LV kinematic component (which prevents that component to have a robust PAkin measurement). This definition roughly corresponds to the more standard appellation of KDC used in the past (Bender88), although the two-dimensional coverage provided by integral-field spectrographs allows a more sensitive detection procedure. These kinemetric groups will be examined in Sect. 4.4.
3 Quantifying the angular momentum
The velocity fields presented in Paper III revealed a wealth of structures such as decoupled cores, velocity twists, misalignments, cylindrical or disc-like rotation (see also Section 4.4). It is difficult to disentangle the relative contributions of a true variation in the internal dynamical state and the effect of projection. A first examination of the stellar velocity maps for the 48 SAURON E/S0 galaxies (Fig. 1, where velocity cuts have been adjusted as to properly emphasise the observed velocity structures) suggests that early-type galaxies come in two broad flavours: one which exhibits a clear large-scale and rather regular rotation pattern, and another which shows perturbed velocity structures (e.g. strong velocity twists) or central kinematically decoupled components with little rotation in the outer regions. One way to constrain the internal dynamics for a specific galaxy is to build a detailed model using all available observables. This was successfully achieved in Paper IV on a subsample of 24 galaxies, for which accurate distances and high spatial resolution photometry are available, and where no strong signature of non-axisymmetry is observed. From these models, a considerable amount of detail on the orbital structure was derived (see also Paper X). We, however, also need a simple measurable parameter which quantifies the (apparent) global dynamical state of a galaxy, and which is applicable to all galaxies in our representative sample of Es and S0s: this is the purpose of this section.
3.1 From to : a new kinematic parameter
The relation of versus mean ellipticity (hereafter the anisotropy diagram) was often used in the past to confront the apparent flattening with the observed amount of rotation (Illingworth77; Binney78; Davies+83). In the now classical treatment of the anisotropy diagram, the maximum observed rotational velocity and the central dispersion are generally used as surrogates for the mass-weighted mean of the square rotation speed and the random velocity. This was mostly constrained by the fact that stellar kinematics were available along at most a few axes via long-slit spectroscopy. Binney05 has recently revisited this diagram to design a more robust diagnostic of the velocity anisotropy in galaxies using two-dimensional kinematic information. Starting from the Tensor Virial Theorem, Binney reformulated the ratio of ordered versus random motions in terms of integrated quantities observable with integral-field spectrographs such as SAURON, namely and , where and denote respectively the observed stellar velocity and velocity dispersion, and the brackets correspond to a sky averaging weighted by the surface brightness (see Eq. 2).
The SAURON data provide us with a unique opportunity to derive for the first time a robust measurement of for a sample of local early-type galaxies. We have therefore derived and up to , the resulting values for the 48 SAURON E and S0 galaxies being given in Table 1. S0s and Es tend to have on average relatively high and low , respectively. A very significant overlap of the two types still exists, S0s reaching values of as low as 0.1, and Es as high as 0.7: as expected, the Hubble type can obviously not serve as a proxy for the galaxy kinematics (see the distribution of Hubble types in Fig. 1).
The availability of two-dimensional stellar kinematics makes a useful tool to examine the dynamical status of early-type galaxies (see Paper X). It fails, however, to provide us with a way to differentiate mean stellar velocity structures as different as those of NGC 3379 and NGC 5813 (see Fig. 1). These two galaxies both have , and ellipticities in the same range (0.08 and 0.15, respectively), but their stellar velocity fields are qualitatively and quantitatively very different: NGC 3379 displays a regular and large-scale rotation pattern with a maximum amplitude of about 60 , whereas NGC 5813 exhibits clear central KDC with a peak velocity amplitude of and a mean stellar velocity consistent with zero outside a radius of . The derivation of includes a luminosity weighting that amplifies the presence of the KDC in NGC 5813. As a consequence, NGC 3379 with its global rotation and NGC 5813 with its spatially confined non-zero velocities end up with a similar .
We therefore need to design a new practical way to quantify the global velocity structure of galaxies using the two-dimensional spatial information provided by integral-field units. The ideal tool would be a physical parameter which captures the spatial information included in the kinematic maps. Since we wish to assess the level of rotation in galaxies, this parameter should follow the nature of the classic : ordered versus random motion. A measure of the averaged angular momentum , could play the role of , and should be able to discriminate between large-scale rotation (NGC 3379) and little or no rotation (NGC 5813). Such a quantity, however, depends on the determination of the angular momentum vector direction, which is not an easily measured quantity. We therefore use a more robust and measurable quantity , where is the observed distance to the galactic centre, as a surrogate for , and the brackets correspond to a luminosity weighted sky average (see Eq. 2). We can then naturally define a dimensionless parameter, after normalising by e.g. mass, which leads to a proxy for the baryon projected specific angular momentum as:
| (5) |
and measured via two-dimensional spectroscopy as:
| (6) |
where is the flux inside the bin, its distance to the centre, and and the corresponding mean stellar velocity and velocity dispersion. The normalisation by the second velocity moment implies that goes to unity when the mean stellar rotation () dominates, with being a reasonable proxy for mass (see Appendix A). The use of higher order moments of either or the spatial weighting would make this parameter more strongly dependent on the aperture and presence of noise in the data. obviously depends on the spatial extent over which the sums in Eq. 6 are achieved. In practice, we measure within regions defined by the photometric best fit ellipses, where is the mean radius of that ellipse (, with its semi-major axis and its ellipticity), the area of the corresponding aperture being thus , the area of a circle with a radius of . When our SAURON kinematic measurements do not fully sample the defined ellipse, we instead set the radius as that of a circular aperture with the same area on the sky actually covered by the SAURON data inside that aperture (see Paper IV). For a specific galaxy, we measure up to the radius for which we reach a maximum difference of 15% between and : this guarantees that the SAURON kinematic data still properly fill up the elliptic aperture defined by the photometry.
3.2 Rotators and
Values of , within 1 or the largest radius allowed by our SAURON data, whichever is smaller, are provided in Table 1 for the 48 E/S0 galaxies. As expected, NGC 3379 and NGC 5813 which have similar values (see Fig. 1 and Sect. 3.1) but qualitatively different velocity structures, are now quantitatively distinguished with values of 0.14 and 0.06, respectively. This difference is significant because the formal uncertainty in the derivation of due to the presence of noise in the data is almost always negligible, and anyway smaller than 0.02 for galaxies such as NGC 3379 and NGC 5813 (Appendix B): this can be understood because includes averages over a large area. There is, however, a systematic (positive) bias which obviously increases as the the velocity amplitudes in the galaxy decrease, and can reach up to about in the measurement of . This bias is therefore dominant for the three galaxies with very low (), the mean stellar velocities being in fact consistent with zero values everywhere in the field of view.
As we go from galaxies with low to high values, the overall velocity amplitude naturally tends to increase. More importantly, there seems to be a qualitative change in the observed stellar velocity structures. This is already illustrated in Fig. 1, where the 48 SAURON stellar velocity fields are ordered, from left to right, top to bottom, by increasing value of . Rotators with exhibit low stellar mean velocities at large radii, with very perturbed stellar kinematics and large-scale kinematically decoupled components (this point will be further examined in Sect. 4.4).
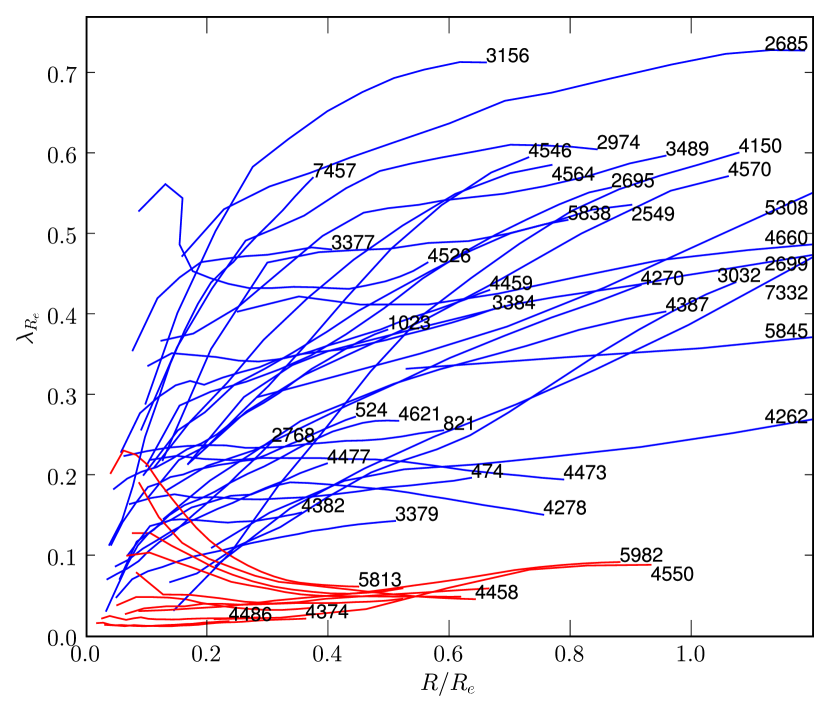
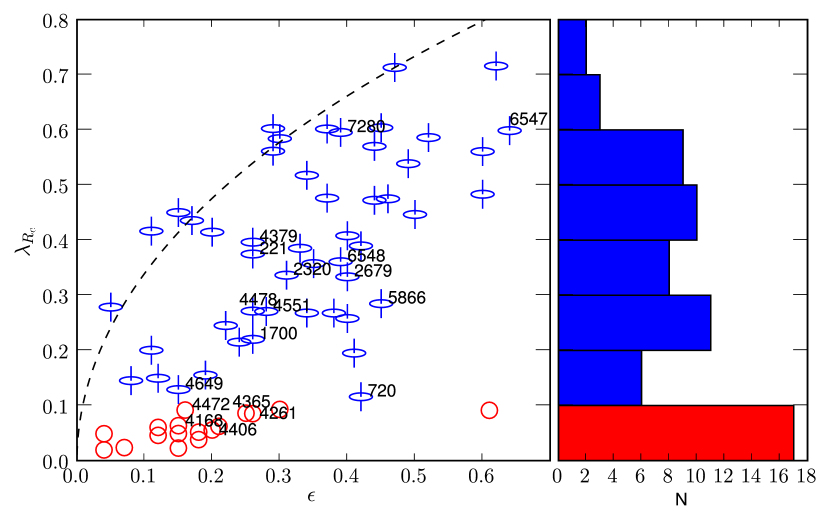
This qualitative change is nicely illustrated in Fig. 2 where we show the radial profiles. Galaxies with below and above 0.1 exhibit qualitatively very different profiles: the former have either decreasing or nearly flat (and small amplitude) profiles, while the latter preferentially exhibit significantly increasing radial profiles. Observed gradients are therefore negative or rather small within 1 for galaxies with , and we will label them as “slow rotators”. This contrasts with the significantly rising profiles for galaxies with , which all exhibit clear large-scale and relatively regular rotation patterns, and which we label, by opposition, as “fast rotators”: the fact that this class includes both mild and very fast rotators is discussed in Sect. 3.4.
As mentioned, Table 1 includes values derived using the SAURON two-dimensional kinematic maps available and a default equivalent aperture of 1 . This aperture is in fact covered by the SAURON datacubes for 17 galaxies out of the 48 in the SAURON E/S0 sample (see Paper IV), with two galaxies being mapped only to (NGC 4486 and NGC 5846). Galaxies with the narrowest relative spatial coverage (with the largest : NGC 4486, NGC 5846) are among the slowest rotators of our sample: these two galaxies are in fact known not to exhibit any significant rotation within 1 (see Sembach96+), even though NGC 4486 (M 87) is in fact flattened at very large radii (see Kissler98+, and references therein). This implies that only a few galaxies near the threshold (NGC 5982, NGC 4550, NGC 4278) could cross that threshold if we were to have a complete coverage up to 1 .
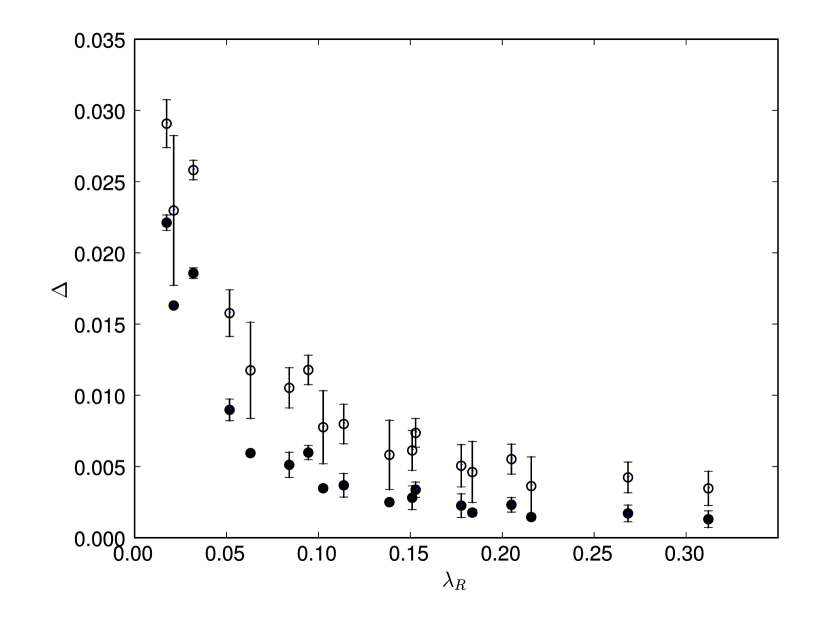
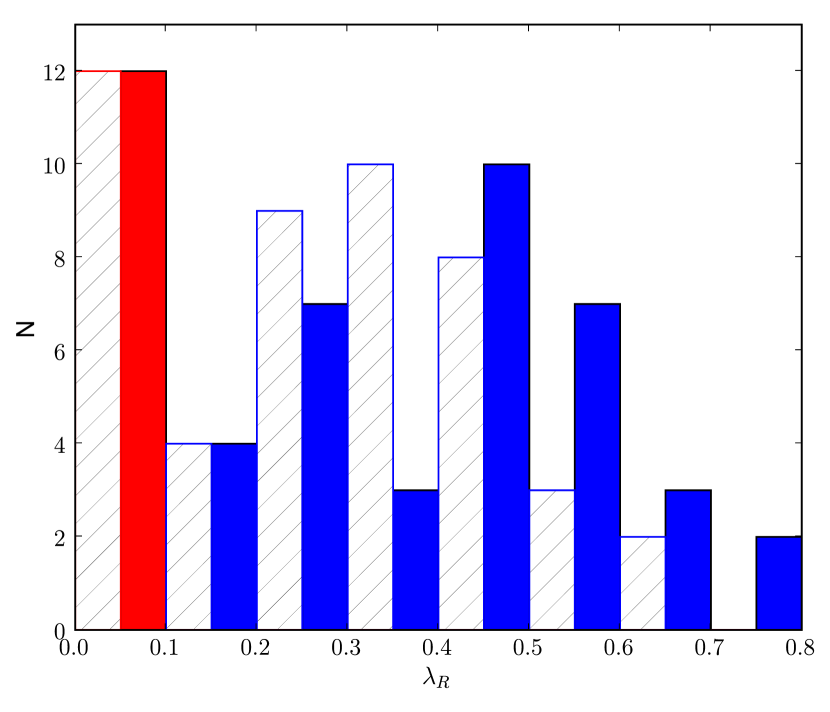
This is also illustrated in Fig. 3 which shows that histograms of for radii of 1 and (or restricted to the equivalent effective aperture of the SAURON field of view, whichever is smaller) have the same fraction of slow and fast rotators. The overall distribution of values is similar for and , although tends to increase significantly from to for fast rotators (see also the solid straight lines in Fig. 5), an obvious implication of the observed rising profiles in Fig. 2. There are 36 fast rotators and 12 slow rotators (75% and 25% of the total sample), their median values being and respectively. Within the class of slow rotators, three galaxies have significantly below 0.03 (their mean stellar velocity maps being consistent with zero rotation everywhere, as mentioned above). These are among the brightest galaxies of our sample, namely NGC 4486, NGC 4374 and NGC 5846.
3.3 Misalignments and twists
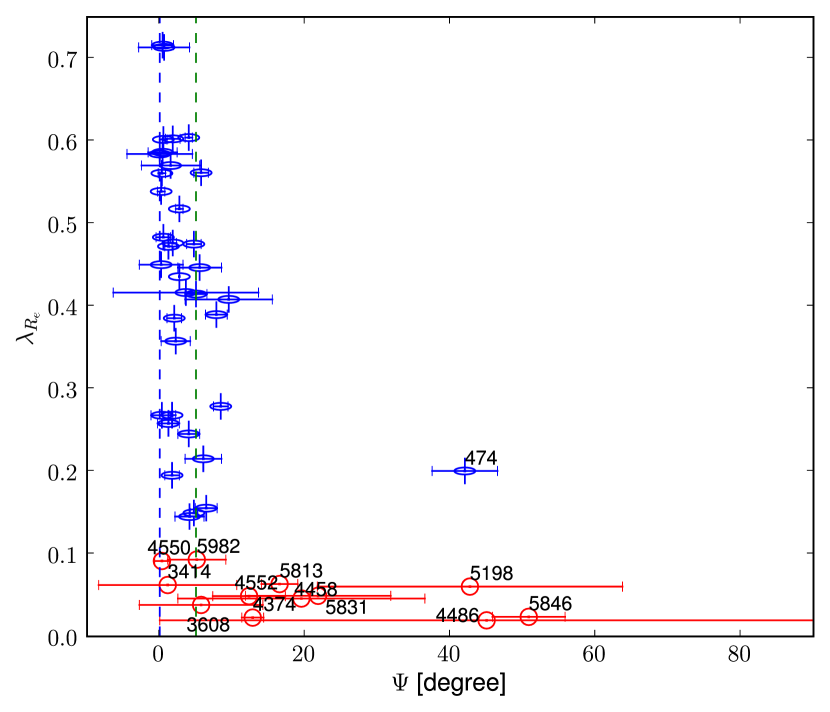
The fact that slow and fast rotators exhibit distinct kinematics can be demonstrated by considering the global alignment (or misalignment) between photometry and kinemetry. Fig. 4 illustrates this by showing the kinematic misalignment for all 48 E and S0 galaxies in the SAURON sample. Note that the photometric PA is derived using the large-scale MDM data, but the kinematic PA via a global measurement on the SAURON velocity maps as described in Appendix C of Krajnovic+06. All fast rotators, except one, have misalignments below 10°. The only exception is NGC 474 which is an interacting galaxy with well-know irregular shells (Turnbull+99). In fact, the few galaxies which have (NGC 3377, NGC 3384, NGC 4382, NGC 4477, NGC 7332) are almost certainly barred. Even the two relatively face-on galaxies NGC 4262 and NGC 4477, the photometry of which shows the signature of a strong bar within the SAURON field of view, have their outer photometric PA well aligned with the measured kinematic PA. In contrast, more than half of all slow rotators have , and none of these exhibit any hint of a bar. This difference in the misalignment values of slow and fast rotators cannot be entirely due to the effect of inclination, not only because of the argument mentioned in Sect. 4.2, but also because even the roundest fast rotators do not exhibit large misalignment values (see Sect. 5.1 in Paper X).
Another remarkable feature comes from the observed velocity twists in the SAURON kinematic maps: only 6 galaxies out of 48 exhibit strong velocity twists larger than 30° outside the inner 3′′, namely NGC 3414, 3608, 4550, 4552, 5198, and 5982, with 3 out of these 6 having large-scale counter-rotating stellar components (NGC 3414, 3608, and 4550). All these galaxies are in fact slow rotators. This implies that only fast rotators have a relatively well defined (apparent) kinematic major-axis, which in addition is roughly aligned with the photometric major-axis.
There is a close link between and the (apparent) specific angular momentum (see Appendix A). is therefore a continuous parameter which provides a quantitative assessment of the apparent mean stellar rotation. As emphasised in this Section, slow and fast rotators exhibit quantitatively but also qualitatively different stellar kinematics. This strongly suggests that slow rotators as a class cannot simply be scaled-down versions of galaxies with .
3.4 Inclination effects
Obviously, is derived from projected quantities and therefore also significantly depends on the viewing angles. Can slow rotators be face-on versions of fast rotators? Assuming roughly follows the behaviour of with the inclination angle (Appendix B), a galaxy with a measured , typical of observed slow rotators, would require to be at a nearly face-on inclination of to reach an intrinsic (edge-on) value of , the smallest value for all observed fast rotators in our sample. The probability that slow rotators are truly fast rotators seen face-on is therefore small, and cannot explain the 25% population of slow rotators observed in the histogram (Fig. 3).
As emphasised above, the measured values are most probably lower limits because we observe galaxies away from edge-on. An illustrative example is provided by the case of NGC 524. According to Paper IV, NGC 524 is viewed with an inclination of 19°: still, NGC 524 exhibits a regular velocity pattern, and is a fast rotator with . There is also some evidence that the three fast rotators with the lowest values in our sample, namely NGC 3379, NGC 4278 and NGC 4382, are significantly inclined galaxies (Statler01; Papers III, IV and PaperV, hereafter Paper V; Fisher97). This illustrates the fact that the apparent distribution of within the fast rotator class may not fully reflect the intrinsic distribution with galaxies viewed edge-on. It is, however, impossible to estimate the “edge-on” distribution for fast rotators as this would require ad minima an accurate measurement of their inclination. Although the fast rotator class may probably include truly mild as well as very fast rotators (as expected from the continuous nature of ), all galaxies with exhibit a global and regular rotation pattern, with a clear sense of rotation and a significant amount of specific stellar angular momentum. This, to us, justifies the use of the label “fast rotators” for these galaxies. Further discussions of the true nature of fast rotators as a class has to wait for a larger and complete sample.
| Galaxy | Type | Group | Rotator | |||||||||||
|---|---|---|---|---|---|---|---|---|---|---|---|---|---|---|
| (NGC) | (mag) | (mag) | (arcsec) | (km/s) | ||||||||||
| (1) | (2) | (3) | (4) | (5) | (6) | (7) | (8) | (9) | (10) | (11) | (12) | (13) | (14) | (15) |
| 474 | S00(s) | -2.0 | 32.56 | -20.42 | 29 | 150 | 0.11 | 0.11 | 0.13 | -0.14 | 0.21 | 0.200 | MC | F |
| 524 | S0+(rs) | -1.2 | 31.84 | -21.40 | 51 | 235 | 0.05 | 0.05 | 0.04 | -0.16 | 0.29 | 0.278 | SC | F |
| 821 | E6? | -4.8 | 31.85 | -20.44 | 39 | 189 | 0.40 | 0.40 | 0.35 | 1.43 | 0.26 | 0.258 | SC | F |
| 1023 | SB0-(rs) | -2.7 | 30.23 | -20.42 | 48 | 182 | 0.33 | 0.33 | 0.36 | 0.54 | 0.35 | 0.385 | SC | F |
| 2549 | S00(r) sp | -2.0 | 30.44 | -19.36 | 20 | 145 | 0.47 | 0.49 | 0.49 | 2.86 | 0.56 | 0.539 | MC | F |
| 2685 | (R)SB0+pec | -1.1 | 31.15 | -19.05 | 20 | 96 | 0.56 | 0.62 | 0.59 | 2.93 | 0.88 | 0.716 | SC | F |
| 2695 | SAB00(s) | -2.1 | 32.49 | -19.38 | 21 | 188 | 0.27 | 0.29 | 0.21 | 0.36 | 0.54 | 0.561 | MC | F |
| 2699 | E: | -5.0 | 32.09 | -18.85 | 14 | 124 | 0.16 | 0.15 | 0.19 | 1.04 | 0.43 | 0.450 | MC | F |
| 2768 | E6: | -4.3 | 31.69 | -21.15 | 71 | 216 | 0.38 | 0.38 | 0.46 | 0.12 | 0.24 | 0.268 | SC | F |
| 2974 | E4 | -4.7 | 31.60 | -20.32 | 24 | 233 | 0.38 | 0.37 | 0.37 | 0.64 | 0.70 | 0.602 | SC | F |
| 3032 | SAB00(r) | -1.8 | 31.65 | -18.77 | 17 | 90 | 0.15 | 0.11 | 0.17 | 0.44 | 0.27 | 0.416 | CLV | F |
| 3156 | S0: | -2.4 | 31.69 | -18.08 | 25 | 65 | 0.49 | 0.47 | 0.47 | -0.04 | 0.88 | 0.713 | SC | F |
| 3377 | E5-6 | -4.8 | 30.19 | -19.24 | 38 | 138 | 0.46 | 0.46 | 0.50 | 0.94 | 0.49 | 0.475 | SC | F |
| 3379 | E1 | -4.8 | 30.06 | -20.16 | 42 | 201 | 0.08 | 0.08 | 0.11 | 0.16 | 0.14 | 0.145 | SC | F |
| 3384 | SB0-(s): | -2.7 | 30.27 | -19.56 | 27 | 145 | 0.20 | 0.20 | 0.20 | 1.13 | 0.44 | 0.414 | MC | F |
| 3414 | S0 pec | -2.1 | 31.95 | -19.78 | 33 | 205 | 0.21 | 0.21 | 0.23 | 1.80 | 0.09 | 0.062 | KDC | S |
| 3489 | SAB0+(rs) | -1.3 | 30.35 | -19.32 | 19 | 98 | 0.28 | 0.29 | 0.29 | -0.61 | 0.67 | 0.602 | MC | F |
| 3608 | E2 | -4.8 | 31.74 | -19.54 | 41 | 178 | 0.18 | 0.18 | 0.20 | -0.21 | 0.05 | 0.038 | KDC | S |
| 4150 | S00(r)? | -2.1 | 30.64 | -18.48 | 15 | 77 | 0.25 | 0.30 | 0.28 | -0.32 | 0.58 | 0.584 | CLV | F |
| 4262 | SB0-(s) | -2.7 | 31.23 | -18.88 | 10 | 172 | 0.08 | 0.22 | 0.11 | 1.28 | 0.24 | 0.245 | MC | F |
| 4270 | S0 | -1.9 | 32.83 | -18.28 | 18 | 122 | 0.41 | 0.50 | 0.44 | -0.64 | 0.40 | 0.446 | MC | F |
| 4278 | E1-2 | -4.8 | 30.97 | -19.93 | 32 | 231 | 0.12 | 0.12 | 0.13 | -0.15 | 0.18 | 0.149 | MC | F |
| 4374 | E1 | -4.2 | 31.27 | -21.23 | 71 | 278 | 0.15 | 0.15 | 0.13 | -0.40 | 0.03 | 0.023 | SC | S |
| 4382 | S0+(s)pec | -1.3 | 31.27 | -21.28 | 67 | 196 | 0.19 | 0.19 | 0.22 | 0.59 | 0.16 | 0.155 | CLV | F |
| 4387 | E | -4.8 | 31.59 | -18.34 | 17 | 98 | 0.35 | 0.40 | 0.32 | -0.76 | 0.39 | 0.408 | SC | F |
| 4458 | E0-1 | -4.8 | 31.12 | -18.42 | 27 | 85 | 0.12 | 0.12 | 0.14 | 0.41 | 0.12 | 0.046 | KDC | S |
| 4459 | S0+(r) | -1.4 | 30.98 | -19.99 | 38 | 168 | 0.18 | 0.17 | 0.17 | 0.22 | 0.45 | 0.436 | MC | F |
| 4473 | E5 | -4.7 | 30.92 | -20.26 | 27 | 192 | 0.39 | 0.41 | 0.43 | 1.03 | 0.22 | 0.195 | MC | F |
| 4477 | SB0(s):? | -1.9 | 31.07 | -19.96 | 47 | 162 | 0.24 | 0.24 | 0.23 | 2.04 | 0.21 | 0.215 | SC | F |
| 4486 | E0-1+pec | -4.3 | 30.97 | -21.79 | 105 | 298 | 0.04 | 0.04 | 0.07 | -0.07 | 0.02 | 0.019 | SC | S |
| 4526 | SAB00(s): | -1.9 | 31.08 | -20.68 | 40 | 222 | 0.36 | 0.37 | 0.41 | -1.92 | 0.54 | 0.476 | MC | F |
| 4546 | SB0-(s): | -2.7 | 30.69 | -19.98 | 22 | 194 | 0.39 | 0.45 | 0.36 | 0.69 | 0.60 | 0.604 | MC | F |
| 4550 | SB00:sp | -2.0 | 30.94 | -18.83 | 14 | 110 | 0.58 | 0.61 | 0.62 | 2.36 | 0.10 | 0.091 | MC | S |
| 4552 | E0-1 | -4.6 | 30.86 | -20.58 | 32 | 252 | 0.04 | 0.04 | 0.06 | 0.00 | 0.05 | 0.049 | KDC | S |
| 4564 | E | -4.8 | 30.82 | -19.39 | 21 | 155 | 0.47 | 0.52 | 0.43 | 1.33 | 0.58 | 0.586 | SC | F |
| 4570 | S0 sp | -2.0 | 31.23 | -19.54 | 14 | 173 | 0.41 | 0.60 | 0.44 | 1.90 | 0.53 | 0.561 | MC | F |
| 4621 | E5 | -4.8 | 31.25 | -20.64 | 46 | 211 | 0.34 | 0.34 | 0.35 | 1.66 | 0.25 | 0.268 | KDC | F |
| 4660 | E | -4.7 | 30.48 | -19.22 | 11 | 185 | 0.33 | 0.44 | 0.41 | 0.66 | 0.49 | 0.472 | MC | F |
| 5198 | E1-2: | -4.7 | 33.06 | -20.38 | 25 | 179 | 0.14 | 0.12 | 0.14 | -0.17 | 0.07 | 0.060 | KDC | S |
| 5308 | S0- sp | -2.0 | 32.65 | -20.27 | 10 | 208 | 0.32 | 0.60 | 0.53 | 4.74 | 0.45 | 0.483 | MC | F |
| 5813 | E1-2 | -4.8 | 32.38 | -20.99 | 52 | 230 | 0.15 | 0.15 | 0.17 | -0.03 | 0.14 | 0.063 | KDC | S |
| 5831 | E3 | -4.8 | 32.11 | -19.73 | 35 | 151 | 0.15 | 0.15 | 0.20 | 0.46 | 0.08 | 0.049 | KDC | S |
| 5838 | S0- | -2.7 | 32.37 | -19.87 | 23 | 240 | 0.27 | 0.34 | 0.28 | 0.34 | 0.51 | 0.518 | MC | F |
| 5845 | E: | -4.8 | 32.01 | -18.58 | 4 | 239 | 0.35 | 0.35 | 0.31 | 0.63 | 0.36 | 0.357 | MC | F |
| 5846 | E0-1 | -4.7 | 31.92 | -21.24 | 81 | 238 | 0.07 | 0.07 | 0.07 | -0.38 | 0.03 | 0.024 | SC | S |
| 5982 | E3 | -4.8 | 33.15 | -21.46 | 27 | 229 | 0.30 | 0.30 | 0.28 | -0.92 | 0.08 | 0.093 | KDC | S |
| 7332 | S0 pec sp | -2.0 | 31.40 | -19.93 | 11 | 125 | 0.40 | 0.42 | 0.39 | 1.35 | 0.32 | 0.390 | KDC | F |
| 7457 | S0-(rs)? | -2.6 | 30.55 | -18.81 | 65 | 78 | 0.44 | 0.44 | 0.43 | 0.20 | 0.62 | 0.570 | CLV | F |
Notes: (1) Galaxy identifier (NGC number). (2) Hubble type (NED). (3) Numerical morphological type (LEDA Patu03). (4) Galaxy distance modulus from Tonry+01; Tully88, (corrected by subtracting 0.06 mag, see Mei+05), or from the LEDA database assuming a Hubble flow with km s-1 Mpc-1. (5) Absolute magnitude (Paper II). (6) Effective radius, in arcsec. (7) Velocity dispersion derived using the luminosity-weighted spectrum within or within the SAURON field, whichever is smaller. (8) and (9) Global ellipticity within and (from SAURON), or within the SAURON field, whichever is smaller. (10) Mean ellipticity within 1 , derived from the GALPHOT radial profile. (11) Mean isophote shape parameter (in %) within 1 . (12) and (13) (see Paper X) and within 1 . (14) Kinemetry group (see Sect. 2.4). (15) Rotator class: Ffast, Sslow.
4 Other classifications
In this Section, we examine in more detail other galaxy properties, including photometry and kinemetry, to determine if these could help in defining kinematic classes, and their potential link with .
4.1 Hubble Classification
There is a clear overlap of Es and S0s in the fast rotator class, with most of the corresponding galaxies having ellipticities higher than 0.2. This illustrates the fact that many Es have kinematic characteristics similar to S0s (Bender88; RixWhite90). Some galaxies classified as ellipticals also show photometric signatures of embedded discs, quantified as a positive , and were classified as “discy” ellipticals or E(d) by KB96. It seems difficult, however, to distinguish between a so-called E(d) and an S0 galaxy from the photometric properties or the anisotropy diagram alone. KB96 argued that E(d)s are objects intermediate between S0s and boxy ellipticals or E(b)s (ellipticals with boxy isophotes, i.e. negative ). In principle, the Ed-S0-Sa sequence is one of decreasing bulge-to-total light ratio (), with S0s having in the B band (FAlven04). is, however, a fairly difficult quantity to measure in early-type galaxies, as it depends on the adopted model for the surface brightness distribution of the disc and bulge components. As emphasised by deJong+04, the kinematic information is critical in assessing the rotational support of both components.
Consider two galaxies of our sample, NGC 3377 and NGC 2549, which both have similar , the former being classified as a discy elliptical, the latter as a lenticular. Both have very similar total luminosity, colour (Tonry+01) and gas content (Paper V). Their SAURON stellar kinematic maps are also quite similar (Paper III), with large-scale disc-like rotation, a centrally peaked stellar velocity dispersion and a significant term, anti-correlated with the mean velocity. Finally, there is evidence that NGC 3377 contains a bar, with its velocity map exhibiting a stellar kinematical misalignment and a spiral-like ionised gas distribution (Paper V). This therefore strongly argues for NGC 3377 to be a misclassified barred S0 (SAB0). Many authors (e.g. vdB90; Michard94; JorgensenFranx94, and KB96) indeed suggested that many Es are in fact misclassified S0s, mostly on the basis of photometry alone. Considering the kinematic properties of the observed SAURON early-type galaxies, we suspect that most and possibly all of the 13 Es which are fast rotators are in fact misclassified S0 galaxies, a conclusion also supported by the results of Paper X via the use of state-of-the-art dynamical models.
4.2 Isophote shapes
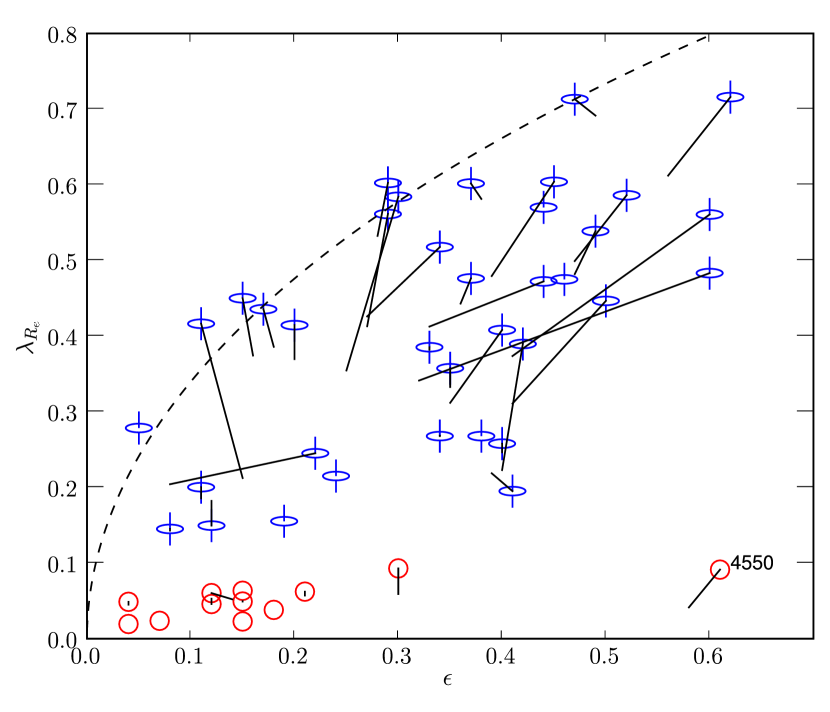
Figure 5 shows versus the global ellipticity for the 48 SAURON E and S0s, measured using an aperture of 1 (or including the full SAURON field of view for galaxies with large , see Sect. 3.2). All galaxies in Fig. 5 lie close to or below the curve expected for isotropic oblate rotators viewed edge-on (see Appendix B and Binney05). Fast rotators, which have velocity maps with significant large-scale rotation, have ellipticities ranging up to about 0.6. Apart from the atypical case of NGC 4550, slow rotators show little or spatially confined rotation and all have ellipticities . NGC 4550 is in fact a nearly edge-on galaxy with two co-spatial counter-rotating stellar discs, each contributing for about 50% of the total luminosity, and should therefore be regarded as an atypical case where a high ellipticity is accompanied by a relatively low mean stellar velocity in the equatorial plane (Rix+92; Rubin+92, and see Paper X for a detailed discussion).
KB96 mention that can be used as a reasonably reliable way to measure velocity anisotropy. They first observe, using ( normalised to the value expected for an isotropic edge-on oblate system), that discy galaxies () seem consistent with near isotropy, whereas boxy galaxies () spread over a large range of values. However, as emphasised by Binney05 and in Paper X, is not a good indicator of anisotropy: the relation between and the anisotropy of a galaxy strongly depends on its flattening, as well as on its inclination (BN05). More flattened galaxies will thus tend to lie closer to the curve, which explains in part why galaxies with discy and boxy isophotes seem to extend over different ranges of , the former being then incorrectly interpreted as near-isotropic systems. This suggests we should avoid using at all, and leads us to examine more directly the orbital anisotropy of galaxies (see Binney05). This is achieved in Paper X, in which a trend between the anisotropy parameter in the meridional plane and the average intrinsic ellipticity is revealed (see their Fig. 7), intrinsically more flattened galaxies tending to be more anisotropic. This contradicts the view that discy galaxies are nearly isotropic, and we should therefore reexamine the relation between the isophotal shape as measured by and the kinematic status of early-type galaxies.
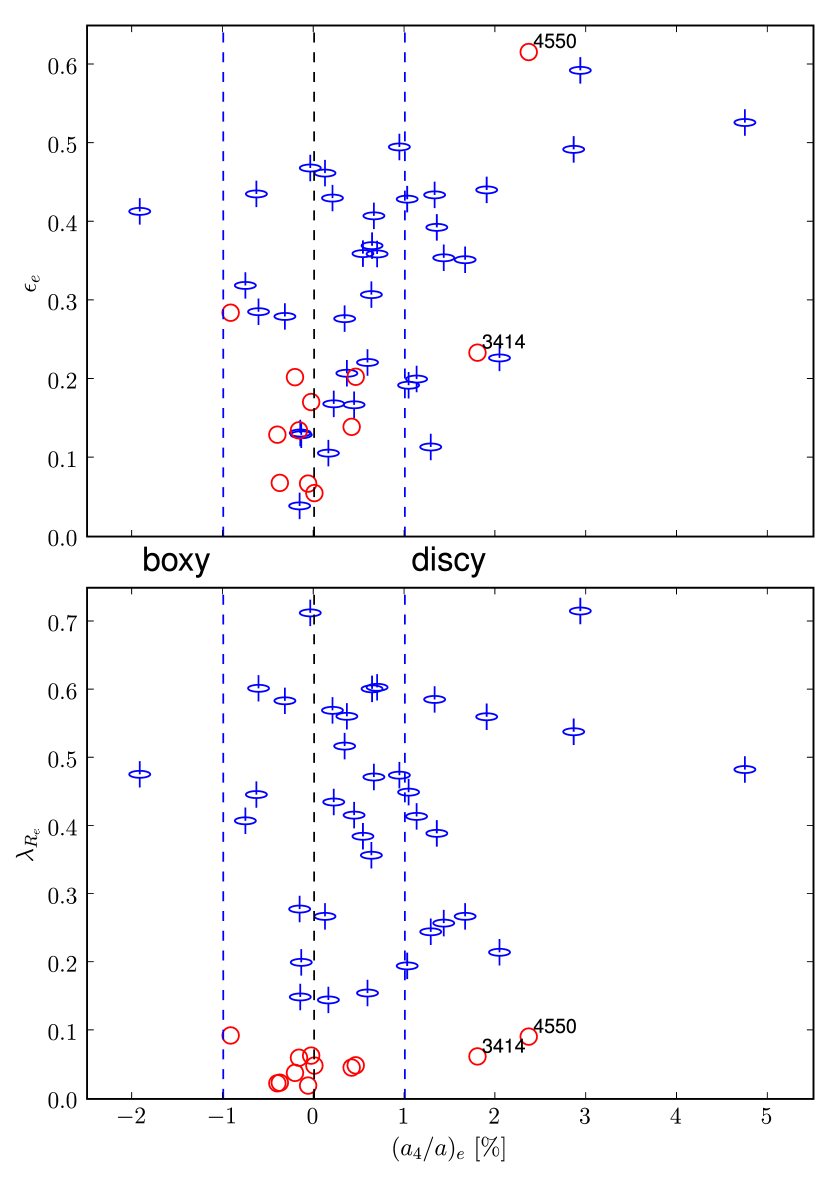
KB96 presented a fairly significant correlation between the mean ellipticity and for their sample of early-type galaxies (their Fig. 3). They mentioned that galaxies in a versus diagram exhibit a V-shaped distribution. The authors therefore pointed out that this remarkable correlation implies that early-type galaxies with nearly elliptical isophotes are also nearly round, and galaxies with the most extreme values are also the most flattened (see also Hao06+). We confirm this result using our photometric data on the SAURON sample as shown in Fig. 6 (upper panel). As mentioned above, all slow rotators with the exception of NGC 4550 have ellipticities lower than 0.3, and our expectation that these galaxies should have isophotes close to pure ellipses is verified: 10 out of 11 have (with 9 out of 11 having ), the exception being NGC 3414, for which the relatively large positive value comes from the remarkable polar-ring structure (vanDriel00+).
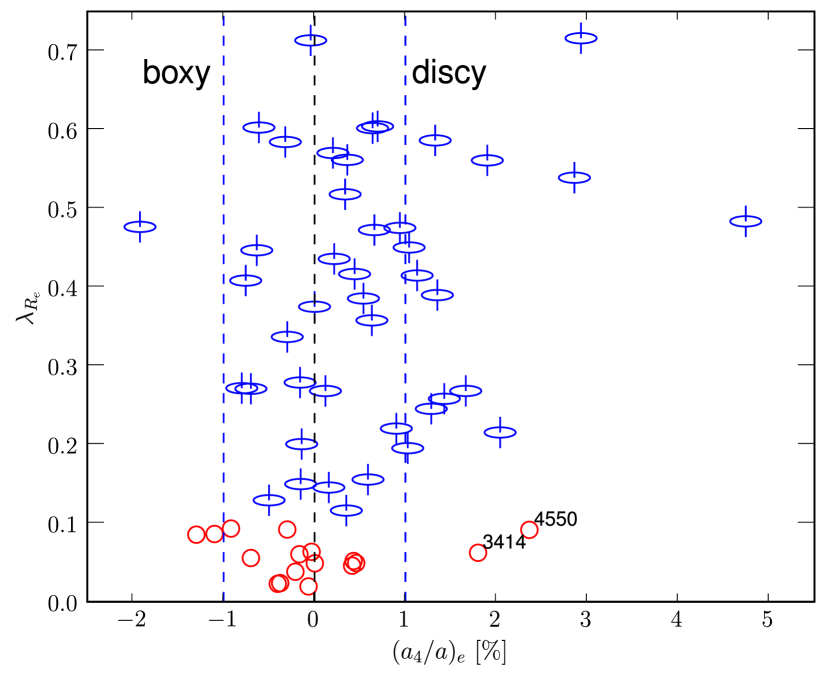
In fact, most fast rotators have a maximum absolute value within 1 larger than 2%, whereas most slow rotators (with the exceptions again of NGC 3414 and NGC 4550) have maximum absolute values less than 2%. This means that most fast rotators in the SAURON sample of E and S0 galaxies exhibit significantly non-elliptical isophotes, but most slow rotators do not. There is a tendency for the fast rotators to have positive (discy isophotes), and most slow rotators (7 out of 12) have negative (boxy isophotes) We do not detect any global and significant correlation between the boxiness and the angular momentum per unit mass as quantified by in the galaxies of our sample, so that is clearly not a good proxy for rotation or angular momentum. This seems partly in contradiction with the claim by KB96 that rotation is dynamically less important in boxy than in discy early-type galaxies. The latter result probably originated from the combination of two observed facts: firstly boxy galaxies are on average less flattened (extremely flattened galaxies are very discy), and secondly the use of as a proxy for the amount of organised rotation in the stellar component, which tends to underestimate the rotational support for less flattened galaxies.
4.3 Luminosity and mass
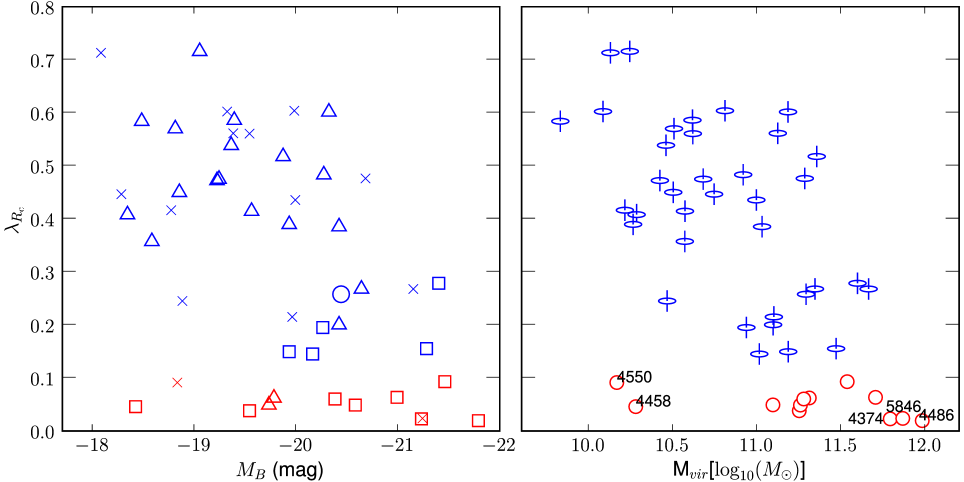
In the left panel of Fig. 7, we show the distribution of as a function of absolute magnitude for the 48 SAURON E/S0 galaxies. The three slowest rotators (NGC 4486, NGC 4374, NGC 5846) are among the brightest galaxies in our sample with mag. Other slow rotators tend to be bright but are spread over a wide range of absolute magnitude going from the relatively faint NGC 4458, to brighter objects such as NGC 5813. The bright and faint end of slow rotators can be distinguished by the shapes of their isophotes: slow rotators brighter than mag all exhibit mildly boxy isophotes (negative with amplitude less than 1%) while the four discy slow rotators are all fainter than mag, following the known correlation between the isophote shapes and the total luminosity of early-type galaxies (BBF92). Most fast rotators are fainter than mag.
Going from total luminosity to mass, we have estimated the latter by approximating it with the virial mass Mvir derived from the best-fitting relation obtained in Paper IV, namely M, where is the luminosity weighted second velocity moment within 1 (see Paper IV for details). The calculation of Mvir from observables depends on the distance of the object, which we obtained from different sources for the galaxies in our sample (in order of priority, from Tonry+01; Tully88, and from the LEDA database assuming a Hubble flow with km s-1 Mpc-1). A trend of tending to be lower for more massive galaxies clearly emerges if we now use this estimate of the virial mass Mvir (right panel of Fig. 7), as expected from the one observed with absolute magnitude (left panel of Fig. 7). The three slowest rotators are in the high range of Mvir with values above M⊙. There is a clear overlap in mass between fast and slow rotators for Mvir between and M⊙. However, all slow rotators, besides NGC 4458 and NGC 4550, have M M⊙, whereas most fast rotators have M M⊙, lower masses being reached as the value of increases. It is worth pointing out that the absolute magnitude in the band, , very nicely correlates with Mvir (significantly better than with ), so that the trend observed between and Mvir is also present if we were to examine the relation between and .
Out of the 48 SAURON galaxies, 33 have published cusp slope classification, distinguishing “core” and “power-law” galaxies (Faber+97; Rest+01; Ravindranath+01; Lauer+05). As illustrated in the left panel of Fig. 7, we find that most slow rotators are core galaxies, and most fast rotators are power-law galaxies (note that NGC 821 has an and is specified as an “intermediate” object between a core and power-law in Lauer+05). There are yet no core galaxies with , although the inclined galaxy NGC 524 (see Paper IV) would have a very high value if seen edge-on. These results are expected as there is a known trend between the central luminosity gradient and the total luminosity of early-type galaxies, bright members tending to be core galaxies, and lower luminosity ones to have power-law profiles (Faber+97). All galaxies with have indeed and conversely none have M M⊙. This is, however, not a one-to-one correspondence since we find both power-law in slow rotators (NGC 3414 and NGC 5813), and core-like fast rotator (e.g., NGC 524). There is also a domain in mass and luminosity where both cusp and cores are found, namely for between and M⊙, or correspondingly for from to . Another interesting result is found when examining the larger-scale luminosity profiles of galaxies in our sample via the representation by a Sersic law. Besides the atypical case of NGC 4550, all slow rotators have Sersic index : again, this is expected since galaxies with larger Sersic shape index tend to be brighter (Caon+93; GrahamGuzman03). Finally, galaxies with the lowest Sersic values are also among the fastest rotators. A more detailed account regarding these issues will be provided in Falcón-Barroso et al. (in preparation).
4.4 Kinemetry groups
We now turn to the kinemetric profiles (see Sect. 2.4) of the 48 SAURON galaxies, which allow us to determine the number of observed kinematic components and their individual characteristics. We thus make use of the average photometric and kinematic position angles and axis ratio (PAphot and PAkin, and ), and the average and maximum of the velocity amplitude .
The kinemetric groups of the observed 48 SAURON velocity maps, defined in Sect. 2.4, are provided in Table 1. Out of 48 galaxies in this sample, 33 (69%) exhibit multiple components (MC), including 10 kinematically decoupled components (KDCs; 21%) and 4 objects with central low-level velocity (CLVs; namely NGC 3032, NGC 4150, NGC 4382, and NGC 7457). Two more galaxies with KDCs are in fact at the limit of being CLVs (NGC 4621 and NGC 7332) with a maximum velocity for their inner component around 20 at the SAURON resolution. The latter two galaxies as well as the CLVs have in fact all been shown to harbour small counter-rotating stellar systems (WEC02; Falcon+04; PaperVIII, hereafter Paper VIII): it is the lower spatial resolution of the SAURON data which produces the low central velocity gradient. If we therefore count CLVs as galaxies with KDCs, this would result in a total of 14 KDC (29%) early-type objects. Among the KDCs, 5 galaxies (NGC 3414, NGC 3608, NGC 4458, NGC 5813, NGC 5831) have outer LV components. Kinematic misalignments are observed in 12 galaxies (25%), and 6 galaxies have individual kinematic components which have kinematical twists (KTs, 2 of them also having kinematical misalignments - KM). Considering the difficulty of detecting these structures at certain viewing angles or low spatial resolution, the number of such detected velocity structures is a lower limit.
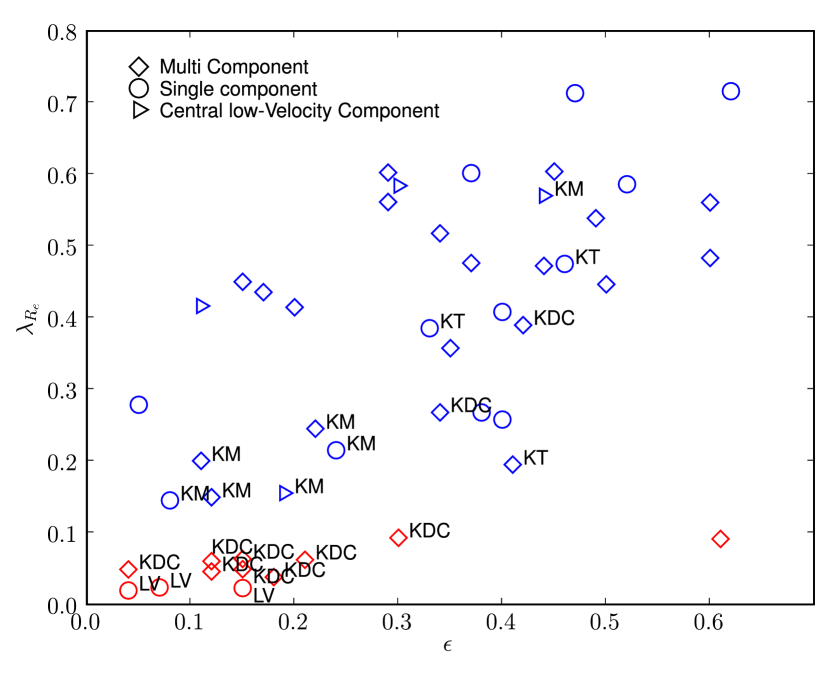
In Fig. 8 we show the diagram (as in Fig. 5), now with the characteristic velocity structures detected via kinemetry. The three slowest rotators are obviously tagged as low-velocity (LV) systems. As mentioned above, these three galaxies are giant (bright and massive) roundish ellipticals with . Apart from these three and the atypical case of NGC 4550, all other slow rotators harbour KDCs, the central kinematic component having a typical size of 1 kpc or larger (see Paper VIII). This contrasts with KDCs and CLVs in fast rotators (NGC 3032, NGC 4150, NGC 7332, NGC 7457), where the size of the central (counter-rotating) stellar component is only a few arcseconds in radius, corresponding to significantly less than pc (Paper VIII).
A number of fast rotators show kinematic misalignments (KM) and twists (KT), most of these being relatively small in contrast with the ones found in slow rotators (see Sect. 3.3). The four fastest rotators with a KT, KM, or KDC, namely NGC 1023, NGC 3377, NGC 7332 and NGC 7457, are all barred galaxies. Most of the galaxies with multi-components but no specific velocity structures are among the fastest rotators. This result may be partly understood if these objects tend to be close to edge-on, which renders the detection of such velocity structures harder, but the detection of multiple components easier.
5 Discussion
The fast rotators are mostly discy galaxies exhibiting multiple components in their stellar velocity fields. Contrarily to slow rotators, the main stellar kinematic axis in fast rotators is relatively well aligned with the photometric major-axis, except for one galaxy (NGC 474) known to harbour irregular shells. This result together with the fact that the profiles are qualitatively different for slow and fast rotators clearly show that slow rotators are not velocity scaled-down versions of fast rotators. The small number of galaxies in our sample, as well as our biased representation of the galaxy luminosity function, reminds us that a larger and complete sample is required to reveal the true distribution in early-type galaxies.
We therefore first briefly discuss here the results obtained so far, this time including 18 additional early-type galaxies (“specials”) observed with SAURON within the course of other specific projects. For these additional targets, we had to retrieve the main photometric parameters (e.g., , , ) from the literature (e.g. BDM88; Faber+97), the kinematic measurements (, ) being derived from the available SAURON data as for the 48 E/S0 galaxies of the main sample (only 12 galaxies out of the 18 specials have available measurements). Adding these 18 galaxies does not change the overall distribution of fast and slow rotators in a versus diagram, as shown in Fig. 9. The fraction of slow rotators (17 out of 66) is still %. We also confirm that most slow rotators have relatively small ellipticities (), in contrast with fast rotators which span a wide range of flattening. The most remarkable fact lies in the confirmation that within these 18 extra targets, there are 5 slow rotators (NGC 4168, NGC 4406, NGC 4472, NGC 4261, NGC 4365), and they all contain large (kpc) scale KDCs. Similarly, in Fig. 10 we confirm the lack of a global significant correlation between and as shown in Fig. 6. Again, about two thirds of the slow rotators are boxy (5 out of 17 are discy, and 1 has ), and very discy galaxies tend to be fast rotators with high values. However, is clearly not a good proxy for angular momentum. We then show in Fig. 11 the relation between and Mvir with an additional 17 “specials” (excluding the compact galaxy NGC 221 [M 32] which would stretch the plot unnecessarily). Most slow rotators are massive galaxies with M M⊙, with still only two exceptions (NGC 4550 and NGC 4458), reinforcing the results from Fig. 11. The trend for more massive galaxies to have lower values is still observed, with an overlap of fast and slow rotators in the range M⊙. The fast rotator NGC 2320 seems to have a rather large for its virial mass (being in fact the most massive galaxy out of the 66). NGC 2320 is the most distant galaxy of this set (with Mpc), and has a rather unusual molecular gas content for an early-type galaxy: it exhibits an asymmetric molecular gas disc with a mass of about M⊙, interpreted as a sign of recent accretion or dynamical perturbation (Young+05).
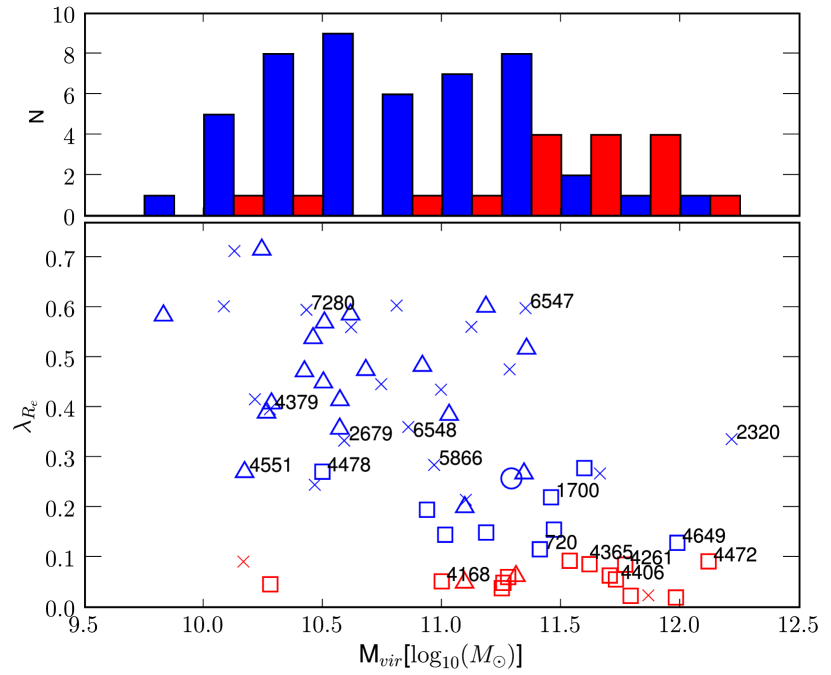
In Fig. 11, we also show the “cusp / core” classification as in Sect. 4.3. Most fast rotators are still galaxies with cusps, and most slow rotators are core galaxies. Conversely, massive galaxies tend to have cores, and smaller ones tend to exhibit cuspy central luminosity profiles: in fact all galaxies with M M⊙ have cores. There is a transition region, in the range M⊙ where we find both cusp and core galaxies. More interestingly, all core galaxies still have . However, a galaxy like NGC 524 is almost certainly very inclined (see Paper IV), its corresponding “edge-on” value being then much larger than 0.75. It would thus be interesting to understand if an edge-on version of NGC 524 would still have a core-like central luminosity profile. We also observe a few galaxies with cusps and rather low values (NGC 5831) which cannot be reconciled with inclined fast rotators. We may therefore only discriminate cusp and core galaxies combining both their mass and their values: massive galaxies (M M⊙) with are indeed all core galaxies, while smaller galaxies (M M⊙) with seem to all be galaxies with cusps. The fact that we observe very few massive (M M⊙) galaxies with high values implies that either our sample is biased against them (e.g. we only observed close to face-on massive galaxies), or these galaxies are rare. Since it is difficult to understand how such a bias could affect our sample, we need to conclude that indeed massive galaxies tend to have little or no baryonic angular momentum within one effective radius, and that the trend observed in Fig. 11 is real (see e.g., the upper panel with the histogram of Mvir).
Interpreting the measured kinematic parameter as a proxy for the amount of stellar angular momentum per unit mass in the central region of early-type galaxies (see Appendix A), we can then discuss the origin of this angular momentum. The standard scenario for the formation of galaxy structures includes hierarchical clustering of cold dark matter halos within which gas is cooling (Peebles69; Dor70; White84). The angular momentum of the dark matter halos is thought to originate in cosmological torques and major mergers (e.g. Vivitska02+), this hypothesis providing a reasonable frame for the formation of disc galaxies. If major mergers produce a significant increase in the specific angular momentum of the dark matter halos at large radii (Vivitska02+), minor mergers seem to just preserve or only slightly increase it with time (Donghia02). But little is known on the expected distribution of the angular momentum of the baryons (vdB02+; deJong04), and even less if we focus on the central regions of galaxies (within a few effective radii). In fact, discs formed in numerical simulations are generally an order of magnitude too small (but see Dutton+06, for a possible solution).
Numerical simulations, whether they include a dissipative component or not, have helped us to understand how mergers influence the rotational support of the baryonic component in galaxies (see e.g. Barnes98; Somerville+99; Cole+00; Bournaud05+; Naab06+). Stellar discs are cold and fragile systems, thus easily destroyed during major mergers which often lead to elliptical-like remnants even in the presence of a moderate amount of gas (NJB06). Intermediate to minor mergers preserve part of the disc better, but in most cases a merger leads to a redistribution of the angular momentum of the central stellar component outwards (Bournaud04+).
In this context, fast rotators have either preserved or regained their specific angular momentum in the central part. Since both very gas-rich major and minor mergers seem to produce fast (disc-dominated) rotators (Robertson+06b; Cox+06), this requires either the absence of a major dry merger which would expel most of the angular momentum outwards, or the rebuilding of a disc-like system via gas accretion. At high redshift (), gas was abundant, and very gas-rich mergers should have therefore been common. Robertson+06a in fact claim that progenitors of early-type galaxies must be gas-rich (gas fraction %) to produce the tilt of the fundamental plane (FP). Dry major mergers are therefore expected to occur preferentially at lower , with fast rotators not having suffered from such events. In the picture of the hierarchical formation of structures, minor mergers are more common than major mergers and we can thus expect galaxies (slow and fast rotators) to have suffered from more than one of these events up to .
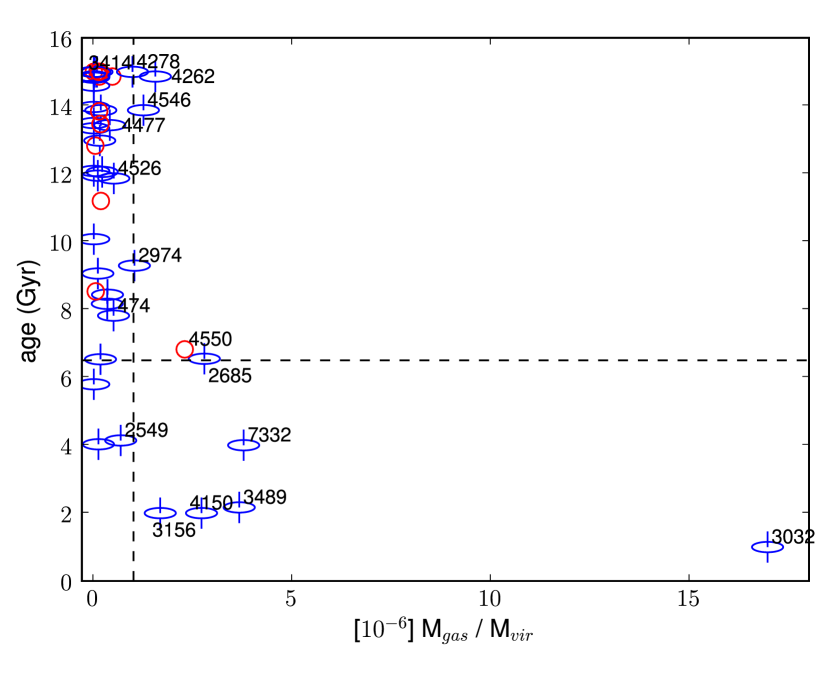
The resulting specific angular momentum of fast rotators, as quantified by , is therefore expected to result mostly from a competition between (i) gas-rich minor mergers or other inflow of external gas that causes a gradual increase of (in the inner parts), and (ii) dissipationless dry minor mergers triggering disc instability and heating, and resulting in the transformation of disc material into a more spheroidal component, lowering (in the inner parts). The scenario described here follows the idea previously sketched by many authors (e.g. BBF92; KB96; Faber+97; NJB06) that dissipation is important in the formation process of fast rotating early-type galaxies. The ‘heating’ of the disc via star formation leads to an increase in the vertical dispersion, more isotropic and rounder galaxies, and therefore moving the galaxies along the anisotropy–ellipticity trend (Paper X) towards the slow rotators. A sudden removal of the gas (e.g., due to AGN feedback or ram pressure stripping) might have ‘quenched’ this process, and quickly moved the galaxy from the ‘blue cloud’ to the ‘red sequence’ (Faber06). Some galaxies may still have recently accreted some gas (e.g. via interaction with a companion, see Falcon+04), and sometimes show the presence of a younger stellar population (such as NGC 3032, NGC 3489, NGC 4150, see PaperVI, Paper VI, and see also Paper VIII). In fact all SAURON E/S0 galaxies which have luminosity weighted ages of their stellar component lower than Gyr () are fast rotators (Fig. 12; see also Kuntschner et al. in preparation). Among the 11 galaxies in our sample with a high ionised gas content (), only one is a slow rotator, namely the atypical disc galaxy NGC 4550. The slow rotator with the second highest gas content is the polar-ring galaxy NGC 3414 (Mgas/M), NGC 4550 and NGC 3414 being in fact the two galaxies having deviant values with respect to all other slow rotators (see Sect. 4.2).
Following the same line of argument, slow rotators need to have expelled most of their angular momentum within one effective radius outwards. This would require a significant fraction of the mass to be accreted during mergers with relatively gas-poor content. As emphasised above, all slow rotators with (thus excluding the three slowest rotators which are consistent with zero rotation) have stellar kpc-size KDCs. Opposite to the smaller-scale KDCs in fast rotators (Sect. 4.4), the latter have a similar old stellar population as the rest of the galaxy (Paper VIII), and thus were formed long ago when gas was more abundant than today. Indeed, numerical simulations of the formation of such structures seem to require the presence of some gas during the merger process followed by subsequent star formation, either in equal-mass mergers (NJB06) or in multiple intermediate or minor mergers (Bournaud, PhD Thesis, Paris). Fig. 12 reveals that most slow rotators have a relatively modest fraction of ionised gas and are in fact older than Gyr (). The only two exceptions are, again, NGC 4550 which is very probably the result of the rare encounter of two disc galaxies with nearly exactly opposite spins (see Paper X), and NGC 3414 which shows the “rudiments of a disc” (Carnegie94), and photometric structures reminiscent of polar-ring galaxies (vanDriel00+) presumably formed via a tidal gas accretion event (Bournaud+03). These results are consistent with the suggestion that slow rotators did not suffer from significant (in mass) recent dry mergers which may destroy or diffuse the large-scale KDCs. Minor mergers may still have recently occurred, and as above result in a competition of (slightly) lowering and increasing .
The three slowest rotators (NGC 4374, NGC 4486, and NGC 5846) may then correspond to the extreme end point of early-type galaxy evolution where dry mergers had a major role in the evolution, allowing to reach values consistent with zero in the central region. These galaxies are found in rather dense galactic environment and are expected to have experienced a significant number of mergers with galaxies which were themselves gas-depleted (due to ram-pressure stripping, due to efficient AGN feedback, or due to earlier mergers), preferentially on radial orbits along the cosmological filaments (Boylan+06). As for the other slow-rotators, the initial mergers will have been gas-rich to place them on the fundamental plane, but later-on dry mergers are expected to be frequent as galaxies fall into the cluster potential well. The insignificant role of star formation in the late history of these galaxies is reflected in both their low specific gas content and old luminosity weighted ages (Fig. 12). Overall, the trend we observe for early-type galaxies to have lower with increasing mass (Fig. 7) is consistent with the gradually more important role of (gas-poor) mergers when going from fast rotators, to slow rotators.
Is this also consistent with the observed trend between , Mvir and the cusp slope described above? Cores are thought to be the result of the scouring via a binary supermassive black hole (Faber+97; Merritt06, and references therein), the potential consequence of a merger. After a core is formed, a subsequent central accretion of gaseous material (from external or internal sources) followed by an episode of star formation could rejuvenate a cuspy luminosity profile, most probably in the form of an inner disc. If this scenario is correct, there should be a relation between the presence of a core and . The observation that massive slow rotators, thought to have significantly suffered from dissipationless mergers, all exhibit cores, and that small galaxies with high all contain cusps does indeed fit into this scenario. However, the fact that minor gas-free mergers may only remove part of the baryonic angular momentum, and that gas can be accreted from e.g., external sources or stellar mass loss, implies that there should not be a one-to-one relation, as indeed observed. Intriguingly, the two slow rotators with cusps (NGC 3414, NGC 5813) both show the presence of a decoupled stellar disc-like component in their central few hundreds of parsecs (as witnessed by the amplitude of the associated parameter, see Paper III). These may illustrate again the competition between gas-poor mergers and gas accreting processes in the making of galaxy structures.
6 Conclusions
Using two-dimensional stellar kinematics, we have argued that early-type galaxies can be divided into two broad dynamical classes. We have devised a new parameter to quantify the specific angular momentum in the stellar component of galaxies. This parameter, as applied within one effective radius to the E and S0 galaxies of our SAURON sample, allowed us to disentangle the two classes of fast and slow rotators with a threshold value of . As emphasised in Sect. 3.2, fast and slow rotators exhibit qualitatively and quantitatively different stellar kinematics (see also Paper X). Galaxies with form a distinct class characterised by little or no large-scale rotation, by the presence of kinematically decoupled cores, and by significant kinematic misalignments and/or velocity twists. This contrasts with galaxies for which , which display global rotation along a well defined apparent kinematic major-axis that is nearly aligned with the photometric major-axis. We have also shown that slow and fast rotators exhibit qualitatively different radial profiles and that slow-rotators are unlikely to be face-on versions of fast-rotators.
Beside the obvious difference in their angular momentum content, the main properties of the fast and slow rotators are as follows:
-
(i)
75% of the galaxies in our sample are fast rotators, 25% are slow rotators. Most of the slow rotators are classified as Es, while fast rotators include a mix of Es and S0s.
-
(ii)
Within the slow rotators, three early-type galaxies have velocity fields consistent with near zero rotation. These three objects (NGC 4374M 84, NGC 4486M 87 and NGC 5846) are bright and massive, nearly round galaxies.
-
(iii)
Fast rotators have ellipticities up to , in contrast to slow rotators which are relatively round systems with .
-
(iv)
Fast rotators tend to be relatively low-luminosity objects with . Slow rotators cover almost the full range of absolute magnitude of our sample, from faint discy galaxies such as NGC 4458 to bright slightly boxy galaxies such as NGC 5813, although they on average tend to be brighter than fast rotators. All slow rotators have Sersic index larger than 4, except the atypical galaxy NGC 4550.
-
(v)
More than 70% of the galaxies in our sample exhibit multi-component kinematic systems. As mentioned above, fast rotators have nearly aligned photometric and kinematic components, except for NGC 474 which exhibits obvious irregular shells. This contrasts with slow rotators which have significant kinematic misalignments and/or velocity twists.
-
(vi)
All slow rotators, besides the three slowest rotators (for which stellar velocities are consistent with zero everywhere), exhibit a kiloparcsec-scale stellar KDC (see also Paper VIII).
These results are confirmed when including 18 additional galaxies observed with SAURON. Although our sample of 48 early-type galaxies is not a good representation of the galaxy luminosity distribution in the nearby Universe, it is the first to provide such a constraint for numerical simulations of galaxy formation and evolution. It is clear that a significantly larger and unbiased sample is required to probe the true distribution of in early-type galaxies and the fraction of slow and fast rotators. Even so, our sample should serve as a reference point for detailed numerical simulations of galactic systems in a cosmological context.
Acknowledgements
EE warmly thank Frank van den Bosch for insightful discussions. The SAURON project is made possible through grants 614.13.003, 781.74.203, 614.000.301 and 614.031.015 from the Nederlandse Organisatie voor WettenSchappelijk OnderzoekNetherlands (NWO) and financial contributions from the Institut National des Sciences de l’Univers, the Université Lyon I, the Universities of Durham, Leiden, and Oxford, the Programme National Galaxies, the British Council, PPARC grant ‘Observational Astrophysics at Oxford 2002–2006’ and support from Christ Church Oxford, and the Netherlands Research School for Astronomy NOVA. RLD is grateful for the award of a PPARC Senior Fellowship (PPA/Y/S/1999/00854) and postdoctoral support through PPARC grant PPA/G/S/2000/00729. The PPARC Visitors grant (PPA/V/S/2002/00553) to Oxford also supported this work. MC acknowledges support from a VENI award (639.041.203) by NWO and a PPARC Advanced Fellowship (PP/D005574/1) GvdV acknowledges support provided by NASA through grant NNG04GL47G and through Hubble Fellowship grant HST-HF-01202.01-A awarded by the Space Telescope Science Institute, which is operated by the Association of Universities for Research in Astronomy, Inc., for NASA, under contract NAS 5-26555. JFB acknowledges support from the Euro3D Research Training Network, funded by the EC under contract HPRN-CT-2002-00305. This paper is based on observations obtained at the William Herschel Telescope, operated by the Isaac Newton Group in the Spanish Observatorio del Roque de los Muchachos of the Instituto de Astrofísica de Canarias. This project made use of the HyperLeda (http://leda.univ-lyon1.fr), and NED databases. Part of this work is based on data obtained from the ESO/ST-ECF Science Archive Facility. Photometric data were obtained (in part) using the 1.3m McGraw-Hill Telescope of the MDM Observatory.
Appendix A The angular momentum of galaxies and
The criterion we wish to define should clearly separate the slow and fast rotators. The first guess is to take something equivalent to the total angular momentum, which should be expressed as something like where is the distance to the spin axis. To avoid having to determine that axis, we chose , where is the distance to the centre. The absolute value of is used as we are interested in the presence of local streaming motion (e.g. see NGC 4550). This is then naturally normalised by where is the second order velocity moment.
Another route would be to get closer to some physical quantity such as the angular momentum per unit mass. This can be represented via the spin parameter (e.g. Peebles69):
| (7) |
where , , and are the total angular momentum, energy and mass, and is Newton’s constant of gravity. The derivation of in principle requires an accurate distance for each galaxy. Since we wish to stay close to our SAURON measurements we need to define something which can be readily evaluated. This is possible by first rewriting as:
| (8) |
For two-dimensional integral-field data, we can approximate the spin parameter by using the scalar virial relations and sky averaging over the field-of-view, weighted with the surface brightness. The scalar virial relations are , with the total kinetic and potential energy related to the mean-square speed of the system’s stars respectively as and . Here, is the gravitational radius, which can be related to the half-mass radius given the mass model of the stellar system. For e.g. a spherical symmetric Jaffe83 model, we have .
When relating (or ) to the observed effective radius , we have to take into account the projection as a function of the viewing angle of the stellar system which in general is not spherical. Furthermore, while and are related to the mass distribution, depends on the light distribution. Therefore, given the conversion factor is a function of the mass model, viewing direction and mass-to-light ratio. In a similar way a conversion factor is needed in the approximation of the total angular momentum by the observed radius times velocity: (see Franx88). Furthermore, while is the total mean-square speed, we only observe velocity moments projected along the line-of-sight, e.g. and . In order to retrieve , we should therefore allow multiplying factors and associated with the corresponding observed and (in the case of an isothermal sphere, and ).
We thus find the following expressions:
| (9) |
| (10) |
| (11) |
resulting in an approximate spin parameter
| (12) |
For simplicity, we will use the observed second order velocity moment , so that both and , and thus define as:
| (13) |
We finally approximate with by writing
| (14) |
When deriving both the values of and for the 48 E and S0 SAURON galaxies, we indeed find a tight relation:
| (15) |
This relation is in fact also valid for the two-integral models as derived in Appendix B, so that we expect to be roughly equal to (though slightly smaller than) . For typical values of the conversion factors, , , we therefore find that .
An alternative to is the unbounded . In the context of early-type galaxies we favour which includes a mass-like normalisation by the second order velocity moment . For isotropic (two-integral) models, this implies . For slow rotators , since these galaxies have by definition small mean stellar velocities.
Appendix B Two-integral models
In order to examine the behaviour of in more detail, we constructed two-integral dynamical Jeans models for 7 SAURON galaxies using the MGE formalism, namely NGC 524, 3377, 4459, 4486, 4552, 4621, and 5813. Details on the assumptions and resulting mass models for these galaxies can be found in Paper IV. For each galaxy, we assumed 8 different inclinations (5, 15, 25, 35, 50, 65, 80, and 90°, the latter corresponding to an edge-on view), and derived the first two line-of-sight velocity moments up to 1 .
These models were used to obtain measurements of , and , to determine whether these three quantities behave similarly with respect to basic parameters such as the inclination or anisotropy parameter. We first obtain that , a correlation very similar to what was found for the observed 48 SAURON galaxies (see Appendix A). The variation of with inclination follows that of within better than 10% for two-integral models. These results do not depend on the global anisotropy, as long as the internal dynamics of the model is fixed before changing the viewing angle. A radial variation in the anisotropy profile can, however, significantly change this situation, as includes an additional explicit dependence on radius. Assuming isotropy for all 7 MGE Jeans models, we observe a tight correlation between and . A simple approximation for the relation between and can then be obtained by introducing a scaling factor :
| (16) |
Using our two-integral models we find a best fit relation with , slightly higher than but still consistent with the best fit value obtained using our 48 SAURON Es and S0s. We can in fact directly solve for in Eq. (16) in terms of the values of and measured for individual two-integral models: there is in fact a rather large spread in the values of , which ranges from 1 and 1.4, depending on the galaxy. This shows that non-homology is an important driver of changes in at constant .
Another important issue when deriving and comes from the presence of noise in the measurements. When is sufficiently large, the random errors in the kinematic measurements will affect both and randomly. As becomes small in absolute value, and become increasingly biased (being artificially increased), which affects estimates of and . In Fig. 13, we show the effect of a random error of 10 in both and (typical in the outer part of SAURON kinematic maps; see Paper III) on both and , in terms of . is the difference between the measured value (with noise) and the expected one (noiseless) and is plotted with respect to the true value. The effect is in general relatively small, of the order of 7% on and almost 15% on , for . When is close to zero everywhere, as is the case for the three SAURON galaxies with the lowest values, the presence of noise yields an overestimate of about 0.02 in (depending on the velocity dispersion values), an effect consistent with the observed values for these galaxies (see Fig. 5). As expected, Fig. 13 also shows that is in general about a factor of two less sensitive to errors in the kinematic measurements than .