Butterfly Diagram and Activity Cycles in HR 1099
Abstract
We analyze photometric data of the active RS CVn–type star HR 1099 for the years 1975–2006 with an inversion technique and reveal the nature of two activity cycles of 15–16 yr and 5.30.1 yr duration. The 16 yr cycle is related to variations of the total spot area and is coupled with the differential rotation, while the 5.3 yr cycle is caused by the symmetric redistribution of the spotted area between the opposite stellar hemispheres (flip-flop cycle). We recover long-lived active regions comprising two active longitudes that migrate in the orbital reference frame with a variable rate because of the differential rotation along with changes in the mean spot latitudes. The migration pattern is periodic with the 16 yr cycle. Combining the longitudinal migration of the active regions with a previously measured differential rotation law, we recover the first stellar butterfly diagram without an assumption about spot shapes. We find that mean latitudes of active regions at opposite longitudes change antisymmetrically in the course of the 16 yr cycle: while one active region migrates to the pole, the other approaches the equator. This suggests a precession of the global magnetic field with respect to the stellar rotational axis.
1 Introduction
HR 1099 (= V711 Tau) is the most extensively studied RS CVn system, consisting of a K1 IV primary and a G5 IV secondary in a 2.8 day orbit. The primary, being the faster rotator, is the first cool active star whose surface was mapped with the Doppler imaging (DI) technique (Vogt & Penrod, 1983). It has a record 46 surface maps obtained between 1981 and the present (Donati et al., 1992, 2003; Donati, 1999; Vogt et al., 1999; Strassmeier & Bartus, 2000; García-Alvarez et al., 2003; Petit et al., 2004). Almost all images of the star feature a prominent, cool, polar cap along with a variety of high- and low-latitude spots. The area of the polar spot and its extensions may vary cyclically and correlate with the mean brightness of the system (Vogt et al., 1999).
The photometric variability of HR 1099 was discovered in 1975 by Landis & Hall (1976) and has been followed regularly for more than 30 years. The data before 1993 were collected and analyzed by Henry et al. (1995). They found periodicities of 5.50.3 and 161 yr, respectively, in the star’s mean and maximum brightness, suggesting the presence of activity cycles. Using a model with two circular spots, they identified 15 different dark spots within the 18 yr span of the data with lifetimes averaging between 1.5 and 2.0 yr. The spot rotation periods ranged from 2.8245 to 2.8412 days and bracketed the orbital period by 0.47% to +0.12% days, implying significant differential rotation. Vogt et al. (1999) measured the differential rotation from DI and found that it is of opposite sign and about a factor of 56 less than for the Sun. With newer stellar images, however, Petit et al. (2004) argued that the differential rotation law for HR 1099 is of the same sign as the Sun and a factor of 2 larger than determined by Vogt et al. (1999). The range of polar and equatorial periods determined by Petit et al. (2004) encompasses all periods derived from the photometry of Henry et al. (1995).
Mohin & Raveendran (1993) interpreted the photometric variability of HR 1099 as the result of two active longitude regions migrating in the orbital reference frame with constant but very different rates. Two active longitudes (ALs) separated by about 180° and locked in synchronism with the orbital period have been surmised by Henry et al. (1995). In comparison with other RS CVn–type stars, however, the ALs on HR 1099 appeared very broad, 110°–140°, implying smearing by differential rotation.
In the present Letter we analyze all photometric data collected up to date for HR 1099, previously published and newly obtained. Employing a technique based on inversions of stellar light curves into images of the spot filling factor (Berdyugina et al., 2002), we recover locations of active regions and search for long-lived ALs. Taking into account the effect of differential rotation, we are able to recover a stellar butterfly diagram, which, in contrast to previous studies (e.g., Katsova et al., 2003), does not involve assumptions about spot distributions, shapes, and numbers.
2 Observations
We have analyzed the Johnson photometric observations collected earlier from the literature and from the T1 0.25 m and T3 0.40 m automatic photometric telescopes (APTs) by Henry et al. (1995), that span the years 1975–1993. We have also included new observations for the years 1994–2006, acquired with the T3 APT. The T1 and T3 APTs, along with several others, are housed at Fairborn Observatory in southern Arizona. Further details on the operation of the APTs and the reduction of the data can be found in Henry (1995a, b) and Eaton et al. (2003). The complete set of Johnson differential magnitudes is listed in Table 1 and plotted in Fig. 1. The differential magnitudes have been converted to apparent magnitudes in Fig. 1 with a magnitude of 4.28 for the comparison star 10 Tau (= HR 1101). The faint, close, visual companion of HR 1099 was always included in the photometer diaphragm and so is included in the light of HR 1099.
The observations were divided into 109 subsets within which the light curve was observed to be stable over each time interval. The average length of each subinterval was 40 days. Julian Dates of the observations were converted to orbital phases with the ephemeris
| (1) |
adopted from Fekel (1983), where zero phase corresponds to the conjunction with the K1 star closest to the Earth. The error in the period of 10-5 days results in a phase uncertainty of only 0.04 after 30 years. According to the Fourier analysis of Henry et al. (1995), the star exhibits the presence of a small ellipticity effect with a full amplitude of 0.016 mag in . This effect was removed from each data set before the light-curve inversions were performed.
3 Activity cycles and active longitudes
For each of the 109 light curves, we measure the maximum, mean, and minimum magnitudes as well as the peak-to-peak amplitude in . Period analysis of these values confirms the cycles found by Henry et al. (1995). The mean brightness variations show a cycle of 15 years (Fig. 1), and similar cycle lengths of 15–16 years are seen in the maximum and minimum magnitudes. The peak-to-peak amplitude in varies with a cycle of 5.30.1 yr (Fig. 1). This cycle also has an influence on variations in the maximum, mean, and minimum magnitudes. Similarly, the 16 yr cycle also influences the amplitude variations, as the largest amplitude of 0.2 mag was observed at the maxima of the spottedness in 1979 and 1994.
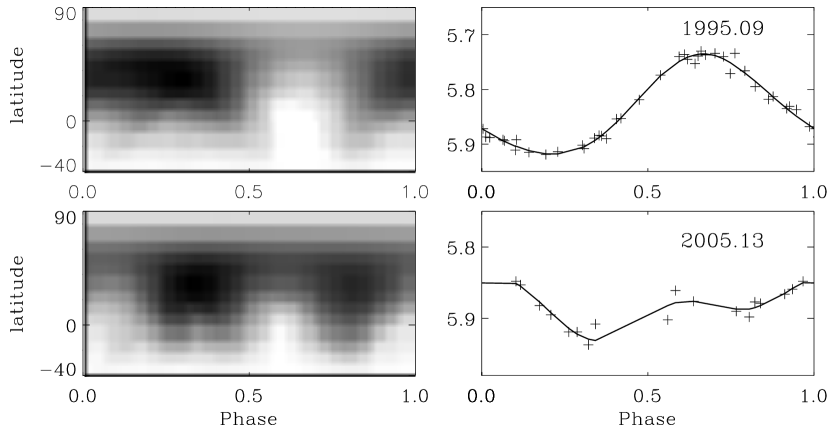
To determine the large-scale spot distribution on HR 1099, we apply an inversion technique to the light curves using a two-temperature approximation (Berdyugina et al., 2002). The inversion of the light curve results in the distribution of the spot filling factor over the stellar surface, i.e., a stellar image (Fig. 2). We adopted values of 4700 and 3500 K for the photosphere and spot temperatures, respectively, following Hatzes et al. (1996). Also, we assumed that the star is spotless at mag, which is about 0.05 mag brighter than the brightest magnitude observed for HR 1099. The inclination of the rotational axis to the line of sight is chosen to be 40∘; inclinations in the range of 33°–45° have been used for the previous DI mentioned above.
From the stellar images, we recover spot longitudes with the maximum spot filling factor (see details in Berdyugina et al., 2002). The accuracy of the spot longitudes depends on the broadness of the light curve minimum and is on average 0.05 in phase. When two minima are seen in the light curves, two spot concentrations are recovered in the images. The time dependence of the spot phases is shown in Fig. 1 (the data are available on request). Our derived spot phases constitute two sequences that represent two migrating active longitude regions separated on average by 180∘, similar to the previous studies of HR 1099 (Mohin & Raveendran, 1993; Henry et al., 1995; Lanza et al., 2006) and to other RS CVn–type stars (Berdyugina & Tuominen, 1998; Fekel & Henry, 2005). Lanza et al. (2006) related the long-term trend in the migration of the ALs with binary orbital period variations.
We notice that the two active regions regularly approach each other and merge into a large single region. Subsequently, the single region divides back into two spot regions. Thus, we are seeing the crossing of the migration paths of the two ALs. In the presence of differential rotation, such behavior suggests variations in mean spot latitudes. Three intersections were clearly observed in 1979, 1990, and 1995. At the same times, the amplitude of the brightness variations reached a maximum (Fig. 1), which implies a rearrangement of spots onto one stellar hemisphere and supports the idea of merging active regions and crossing ALs. The intersections in 1979 and 1990 are also seen in the reconstruction by Lanza et al. (2006). However, they missed the one in 1995 due to lack of data. The shorter (5 yr) and longer (11 yr) time intervals between the intersections comprise the 16 yr cycle.
In Fig. 1, the two migration paths are plotted with two fits to the observed phases. The fits are obtained with a two-harmonic Fourier series and a long-term trend, which together are able to reproduce the nonsymmetric shapes of the curves. The assignment of the active regions to one or the other AL has been done under the assumption that the active region continues its migration with the same rate after the intersection of the ALs, which is natural in the presence of differential rotation. Although the fits have been calculated separately for the two ALs, both reveal similar shapes that are mirrored with respect to each other in phase. The migration patterns appear to be periodic with a 163 yr cycle. The standard deviation of the fits is as small as 0.06 phase units. An extrapolation of the fits suggests that the next crossing of the active longitudes will occur in 2007. Observation of the ALs crossing in 2007 with an increase in photometric amplitude will be a good test for the present model.
In addition to the migration patterns and their intersections, abrupt switches of the dominant activity between the ALs occurred in 1988, 1992–1993, 1998–1999, and 2005, all at the times when the amplitude of the light curve was near the minimum. Such events periodically occur in RS CVn– and FK Com–type stars and are known as flip-flop cycles (Berdyugina & Tuominen, 1998; Korhonen et al., 2002). In HR 1099, the flip-flops occurred when the active regions at opposite longitudes became about the same size; that reduced the amplitude of the light curve, and the dominate activity switched to the opposite longitude. Thus, flip-flops in HR 1099 are apparently governed by the 5.3 yr cycle but appear to be disturbed by the differential rotation and intersections of the active longitudes.
4 The butterfly diagram
The shape of the spot migration curves for HR 1099 is reminiscent of the solar ALs (Berdyugina & Usoskin, 2003). On the Sun, such a migration pattern is determined by changes of the mean spot latitudes along with the surface differential rotation. Assuming that a similar relation holds for HR 1099, we can recover mean spot latitudes on its surface, i.e., create butterfly diagrams for the active longitudes in the stellar hemisphere visible above the stellar equator. For this purpose we use the differential rotation law:
| (2) |
with the parameters estimated by Petit et al. (2004) from DI of HR 1099 for the year 2002, having the smallest variances: =2.22410.0004 rad day-1 and =15.20.8 mrad day-1. By observing a phase shift of the ALs during a given time interval, we can determine an instant angular velocity , and, using Eq. (2), we can find the corresponding latitude . To increase accuracy, we determine phase shifts from the harmonic fits to the migration paths. The results are shown as solid and dashed lines in Fig. 3 & . As expected, mean spot latitudes vary with the 16 yr cycle for both active longitudes.
The extent and shape of the butterfly diagram recovered from the AL migration can be compared with the measurements of spot latitudes from DI. From the 46 published images, we measured latitude extents of the recovered spots and calculated weighted mean latitudes for each of the two opposite ALs. These are shown in Fig. 3 & . The mean DI latitudes and the curves obtained from the AL migration are in good agreement, thus supporting our interpretation of the photometry. To estimate a possible range of the parameters in Eq. (2), we searched for the best fit (via minimization) to the mean DI latitudes combined with the angular velocity measured from the AL migration. The result is shown in Fig. 4. It reveals a very elongated error ellipsoid encompassing measurements by Petit et al. (2004) for different years. Our best-fit parameters, =2.2300.003 rad day-1 and =224 mrad day-1, indicate a somewhat stronger differential rotation on HR 1099 than the best parameters by Petit et al. (2004), although the two measurements appear to be statistically equivalent.
The shape of the butterfly diagram for HR 1099 is reminiscent of the Sun’s. The direction of the latitude migration, however, is different for the two ALs. For the active region shown in Fig. 1c with a solid line, preferred spot appearances first move relatively rapidly (for 5 years) to higher latitudes, up to 70∘, and then slowly (for 11 years) move back to mid latitudes, down to 40∘ (Fig. 3). For the other active region (shown in Fig. 1 with a dashed line), the behavior of the spot latitudes is just the opposite. The latitude shifts are therefore always opposite for the two ALs. During 1982–1987, both ALs were at about the same latitude, and the migration rate remained constant. In 1988–1993, one active longitude was occupied by large high-latitude (polar) spots, while low-latitude spots appeared around the opposite active longitude. After 1997, the dominant active regions again moved to about the same latitude, thus completing the 16 yr cycle. The opposite latitudinal migration of the two long-lived regions could be responsible for the contradictory measurements of the differential rotation by Vogt et al. (1999) and Petit et al. (2004).
5 Discussion
As noted by Henry et al. (1995), if the 16 yr cycle is akin to the 11 yr sunspot cycle, one might anticipate other signatures of such a cycle. Indeed, the 16 and 5.3 yr activity cycles in HR 1099 are similar to the sunspot cycles of 11 and 3.7 yr (Berdyugina & Usoskin, 2003) and the cycles observed on young solar analogs (Berdyugina & Järvinen, 2005). The longer cycle in HR 1099 reflects the variation of the total spottedness and is coupled with the differential rotation. This cycle may be associated with an oscillating axisymmetric dynamo mode in which global polarity reversals occur in cycles of 22 years on the Sun or 32 years on HR 1099. No reversals have yet been observed on HR 1099 despite 12 years of spectropolarimetric observations (Donati et al., 2003). Comparing the butterfly diagrams of the Sun and HR 1099, we suppose that a global polarity reversal on HR 1099 could have happened around 1990, just before the regular spectropolarimetric observations by Donati et al. began. The next one can be expected in 2007.
The shorter activity cycle on HR 1099 is related to the flip-flop phenomenon; i.e., it reflects symmetrical redistribution of the spotted area between opposite stellar hemispheres. In the light curves, the flip-flops are seen as a strengthening of the secondary minima and a diminishing of the primary one. In the Doppler images of HR 1099 obtained by Donati (1999) and Donati et al. (2003), the flip-flop in 1992–1993 is seen as an abrupt change of the phase towards which the polar spot is tilted by about half a rotational period, while the flip-flop in 1998–1999 appears as a progressive shift of the polar spot extension to the opposite longitude. The flip-flop cycles can be associated with a non-axisymmetric dynamo mode, which gives rise to ALs (Fluri & Berdyugina, 2004). Similar to the Sun and young solar analogs, the flip-flop cycle on HR 1099 is about one-third of the length of the cycle regulating the total spottedness, which implies a certain relation between the non- and axisymmetric dynamo modes.
The fact that the butterfly diagrams for the two ALs are antisymmetric, i.e., that latitude shifts are always opposite in the opposite stellar hemispheres, implies that the axis perpendicular to the line connecting the ALs changes its direction with respect to the rotational axis by about 15° during the 16 yr cycle. Thus, the two axes are separated the most in 1990–1991 and 1995–1996 and aligned in 1982–1987 and 1998–2003, suggesting the precession of the nonaxisymmetric dynamo mode during the 16 yr cycle. Such a precession of the magnetic field was also suspected in the Zeeman-Doppler images of HR 1099 obtained by Donati et al. (2003), who noticed that the rings of the azimuthal field got progressively better centered in 2000–2002, while the fraction of the magnetic energy attributed to the meridional field component was regularly increasing in 1992–1997 and decreasing starting from 1998 up to now. They assumed that such behavior suggests that the main axis of symmetry of the azimuthal field component is varying in orientation with time on the timescale of at least one decade, which is in agreement with our findings.
Our results suggest that a few interesting events in the magnetic activity of HR 1099 may happen in 2007. For instance, an extrapolation of the fits to the ALs predicts their next crossing to happen during this time. Also, we can expect the mean spot latitude of the dominant active region to be different again and the rings of the azimuthal field to be decentered. In addition, a global polarity reversal may finally be observed. The detection of such events would be of great importance for understanding stellar magnetic cycles and their underlying dynamo processes.
We thank Lou Boyd at Fairborn for making our automated photometry possible. This research at Tennessee State University was supported by NASA grant NCC5-511 and NSF grant HRD-9706268. SVB acknowledges the EURYI (European Young Investigator) Award provided by the European Science Foundation (see www.esf.org/euryi).
References
- Berdyugina & Järvinen (2005) Berdyugina, S. V., & Järvinen, S. P. 2005, Astron. Nachr., 326, 283
- Berdyugina et al. (2002) Berdyugina, S. V., Pelt, J., & Tuominen, I. 2002, A&A, 394, 505
- Berdyugina & Tuominen (1998) Berdyugina, S. V., & Tuominen, I. 1998, A&A, 336, L25
- Berdyugina & Usoskin (2003) Berdyugina, S. V., & Usoskin, I. G. 2003, A&A, 405, 1121
- Donati (1999) Donati, J.-F. 1999, MNRAS, 302, 457
- Donati et al. (1992) Donati, J.-F., Brown, S. F., Semel, M., Rees, D. E., Dempsey, R. C., Matthew, J. M., Henry, G. W., & Hall, D. S. 1992, A&A, 265, 682
- Donati et al. (2003) Donati, J.-F., et al. 2003, MNRAS, 345, 1145
- Eaton et al. (2003) Eaton, J. A., Henry, G. W., & Fekel, F. C. 2003, in The Future of Small Telescopes in the New Millennium, Volume II - The Telescopes We Use, ed. T. D. Oswalt (Dordrecht: Kluwer), 189
- Fekel (1983) Fekel, F. C. 1983, ApJ, 268, 274
- Fekel & Henry (2005) Fekel, F. C., & Henry, G. W. 2005, AJ, 129, 1669
- Fluri & Berdyugina (2004) Fluri, D. M., & Berdyugina, S. V. 2004, Sol. Phys., 224, 153
- García-Alvarez et al. (2003) García-Alvarez, D., Barnes, J. R., Collier Cameron, A., Doyle, J. G., Messina, S., Lanza, A. F., & Rodonò, M. 2003, A&A, 402, 1073
- Hatzes et al. (1996) Hatzes, A. P., Vogt, S. S., Ramseyer, T. F., & Misch, A. 1996, ApJ, 469, 808
- Henry (1995a) Henry, G. W. 1995a, in ASP Conf. Ser. 79, Robotic Telescopes: Current Capabilities, Present Developments, and Future Prospects for Automated Astronomy, ed. G. W. Henry & J. A. Eaton (San Francisco: ASP), 37
- Henry (1995b) Henry, G. W. 1995b, in ASP Conf. Ser. 79, Robotic Telescopes: Current Capabilities, Present Developments, and Future Prospects for Automated Astronomy, ed. G. W. Henry & J. A. Eaton (San Francisco: ASP), 44
- Henry et al. (1995) Henry, G. W., Eaton, J. A., Hamer, J., & Hall, D. S. 1995, ApJ, 97, 513
- Katsova et al. (2003) Katsova, M. M., Livshits, M. A., & Belvedere, G. 2003, Sol. Phys., 216, 353
- Korhonen et al. (2002) Korhonen, H., Berdyugina, S. V., & Tuominen, I. 2002, A&A, 390, 179
- Landis & Hall (1976) Landis, H. J., & Hall, D. S. 1976, Inf. Bull. Var. Stars, No. 1113
- Lanza et al. (2006) Lanza, A. F., Piluso, N., Rodon , M., Messina, S., & Cutispoto, G. 2006, A&A, 455, 595
- Mohin & Raveendran (1993) Mohin, S., & Raveendran, A. V. 1993, A&AS, 100, 331
- Petit et al. (2004) Petit, P., et al. 2004, MNRAS, 348, 1175
- Strassmeier & Bartus (2000) Strassmeier, K. G., & Bartus, J. 2000, A&A, 354, 537
- Vogt & Penrod (1983) Vogt, S. S., & Penrod, G. D. 1983, PASP, 95, 565
- Vogt et al. (1999) Vogt, S. S., Hatzes, A. P., Misch, A. A., & Kürster, M. 1999, ApJS, 121, 547


| HJD | V |
|---|---|
| 2,442,719.8650 | 1.600 |
| 2,442,720.9300 | 1.510 |
| 2,442,721.9050 | 1.570 |