Are magnetic hot stars intrinsic X-ray sources ?
Abstract
Context. X-ray surveys carried out with the Einstein and ROSAT satellites have resulted in rather unexpected detections of X-ray emission from late B-type and early A-type stars. These stars possess neither winds like early-type stars nor convective envelopes as late-type stars, so that the origin and production mechanism of this X-emission is unclear.
Aims. We investigate whether the presence of large magnetic fields is related to the observed X-ray emission.
Methods. We carried out Chandra high-angular resolution observations of a sample of late B-type and A-type stars with measured magnetic fields in the range from kG. Out of the selected sample stars, objects had been previously detected as X-ray sources, some of them, however, with high positional uncertainty and a low signal-to-noise ratio, while of our sample stars do have large magnetic fields but no previous detections of X-ray emission.
Results. Our Chandra data confirm all previous ROSAT detections with an extremely high significance, and the limits of the offsets between X-ray and optical positions are greatly improved. In particular, HD 215441, known as Babcock’s star with the strongest magnetic field by far (17 kG) of our sample stars, a rather faint and somewhat marginal ROSAT source, can clearly be detected. However, none of the ROSAT non-detections could be detected with the new Chandra observations.
Conclusions. The pure existence of a magnetic field of kiloGauss strength on a late B-type or A-type star is therefore not necessarily a prerequisite for finding X-ray emission among these stars. Understanding the observed X-ray emission from Babcock’s star is a challenge for observational and theoretical astrophysics.
Key Words.:
stars: early-type, magnetic fields, activity – X-ray: stars1 Introduction
One of the fundamental discoveries in stellar X-ray astronomy is that X-ray emission is found for almost all stars located on the main sequence. Early-type stars emit X-rays in proportion to their bolometric luminosities, and the X-ray emission is thought to be due to instabilities in these stars’ radiatively-driven winds. Cool stars with outer convective envelopes produce X-rays following the rotation-activity paradigm, with the ultimate cause of the observed X-ray emission thought to be a magnetic dynamo operating in the interiors of these stars. According to this standard paradigm, X-ray emission is not predicted for A-type and late B-type stars, since these stars neither possess convection zones, which support the turbulent motions required for dynamo action, nor do they have strong winds to produce the shocks needed to explain the X-ray emission observed from early-type stars.
Despite these expectations, X-ray emission has been found from late B-type and A-type stars. For example, within the framework of the ROSAT all-sky survey a fraction of 15 % of all bright ( 6.5) A-type stars can be identified with a soft X-ray source. A popular hypothesis to explain this “unexpected” X-ray emission is to invoke unresolved faint companions as the source of the observed X-ray emission. These faint companions can be either white dwarfs, as in the case of the well-known binary Sirius AB or the less well-known binary Crt (Fleming et al. 1991), or low-mass late-type companions or even post T Tauri stars, as in the large majority of the cases. Already Golub et al. (1983) pointed out that A-type stars are fairly young by necessity, thus causing any late-type companions to be quite X-ray luminous.
Since A-type stars are rather bright optically, it is easy to “hide” low mass stars in their vicinity. Yet in a number of cases the “binary hypothesis” can be tested directly. For example, for the totally eclipsing binary CrB (consisting of an A0 and a G5V type star), Schmitt & Kürster (1993) were the first to discover a total X-ray eclipse during the optical secondary minimum of the system, thus demonstrating that essentially all of the system’s X-ray flux does indeed come from the late-type companion, as expected in the context of the “binary hypothesis”. Infrared high-resolution imaging observations of B-type stars detected as X-ray sources in the ROSAT all-sky survey yielded a high fraction of new and close companions. X-ray emission from such companions was searched for by Stelzer et al. (2006) in a sample of X-ray bright late B-type stars with known, close companions, but was previously spatially-unresolved at X-ray wavelengths. Stelzer et al. (2006) did detect X-ray emission from the low-mass companion in out of cases; however, in a surprisingly large number of cases ( out of ), X-ray emission was also found at the position of the primary late B-type star with X-ray luminosity levels of L erg/s. Therefore, these primaries must either be intrinsic X-ray sources or, alternatively, members of at least triple or higher multiplicity systems. While a fraction of % of the high multiplicity systems among X-ray detected late B-type stars appears high, Stelzer et al. (2006) argue that multiplicity studies among known spectroscopic binary stars of HgMn type (e.g. Isobe 1991) reveal a compatible fraction of high multiplicity systems. Similar conclusions have previously been arrived at by Schmitt et al. (1993) using ROSAT HRI data. Finally, Kouwenhoven et al. (2005) studied multiplicity among late B-type and A-type Hipparcos members of the Sco OB2 association – containing of our sample objects – and showed that at least % of the observed stars are members of multiple systems. Kouwenhoven et al. (2005) conclude that at least % of all Hipparcos members of the Sco OB2 association show multiplicity and that this fraction still constitutes a lower limit due to observational biases.
In recent years, magnetic field detections have been obtained for more and more early-type stars. Also, X-ray emission phenomena have been connected to the presence of magnetic fields in early-type stars. For example, Gagné et al. (1997) find a dependence of the X-ray flux of the oblique magnetic rotator Ori C on rotation, and flaring has been observed for Eri (Smith et al. 1993) and the magnetic star Ori E (Groote & Schmitt 2004). The rigidly rotating magnetosphere model, developed by Townsend & Owocki (2005) and applied to Ori E (Townsend et al. 2005), provides a possible explanation for the observed strength and variability of the observed quiescence radiation. Furthermore, the simulations carried out by Ud-Doula et al. (2006) may provide an explanation of the flaring in the context of the same theoretical framework without the involvement of a late-type companion. Of course, the interpretation of the flares as magnetic phenomena associated with the early type star is a controversial issue (Sanz-Forcada et al. 2004). Finally, Schmitt et al. (2004) report a weak, and somewhat marginal, (2 ) detection of X-ray emission from Babcock’s star (HD 215441), the main sequence star with the largest known magnetic field. Therefore, the question arises as to what extent the presence of a magnetic field is a prerequisite for the detection of X-ray emission from stars without convective envelopes and without strong winds.
In this paper we report on the Chandra observations of a sample of B- and A-type stars with large magnetic fields. Our paper is structured as follows. In Sect. 2 we provide basic information on our target stars and the new Chandra observations; we also describe our data analysis, and first results derived from the new X-ray data. In Sect. 3 spectral analysis and further properties of our sample objects are discussed. Finally, Sect. 5 and Sect. 6 present a discussion and a summary of our findings and put them into the context of our current understanding of stellar X-ray emission. In particular our results are discussed in view of binarity and the magnetically confined wind-shock model introduced by Babel & Montmerle (1997).
2 Observations and data analysis
Our stellar sample comprises stars in the spectral range of B to A. All targets are known to possess strong magnetic fields as listed in the Bychkov catalog of averaged stellar effective magnetic fields (Bychkov et al. 2003) and were observed with Chandra’s ACIS-S instrument with exposure times between and kiloseconds. In Tables 1 and 2 we list some basic information about the observed target stars and the Chandra observations. Specifically we list the HD number, spectral type, and parallax of our target stars, as well as sequence numbers and exposure times of our Chandra observations in Table 1, while Table 2 lists more information about magnetic fields and previous observations of X-ray emission with the ROSAT satellite.
| HD | seq.num.11footnotemark: 1 | sp.type | [mas] | obs.time [ks] | |
|---|---|---|---|---|---|
| 12767 | 200326 | B9.5sp | 3 | ||
| 15144 | 200327 | A6Vsp | 3 | ||
| 143473 | 200320 | B9 | 15 | ||
| 144334 | 200328 | B8V | 3 | ||
| 146001 | 200329 | B8V | 3 | ||
| 147010 | 200321 | B9II/III | 8 | 15 | |
| 184905 | 200322 | A0p | 15 | ||
| 208095 | 200323 | B6IV-V | 15 | ||
| 215441 | 200324 | A0p | 20 | ||
| 217833 | 200325 | B9IIIwe | 15 | ||
1 the Chandra sequence number
| HD | v | magn.field [G]111The magnetic field measurements, as well as the method used to obtain the field strength are taken from the Bychkov catalog of averaged stellar effective magnetic fields (Bychkov et al. 2003). | Methoda | ROSAT 222A -sign marks applicable properties. The paper showing the assignments to ROSAT X-ray sources is in preparation. | ||
| [km/s] | det. | |||||
| 12767 | 87 | 242.1 | 93.9 | H1 | ||
| 15144 | 14 | 802.5 | 216.4 | Met | ||
| 143473 | - | 4292.5 | 362.0 | all | - | |
| - | 4775.3 | 416.7 | Hl | |||
| 144334 | 44 | 783.2 | 257.7 | H1 | ||
| 146001 | 181 | 647.2 | 381.9 | Hl | ||
| 147010 | - | 4032.1 | 402.7 | all | - | |
| - | 4050.7 | 466.5 | Met | |||
| - | 3594.4 | 379.8 | Met | |||
| - | 5096.0 | 324.0 | Hl | |||
| 184905 | - | 5051.6 | 3039.4 | Met | - | |
| 208095 | 120 | 7636.9 | 3206.3 | all | ||
| 215441 | - | 19437.3 | 2086.5 | all | ||
| - | 17543.2 | 572.2 | Met | |||
| - | 15555.9 | 2032.1 | Hl | |||
| 217833 | - | 3648.7 | 697.5 | all | ||
| - | 4105.5 | 768.2 | Met | |||
| - | 748.9 | 336.5 | Hl | |||
2.1 General procedures and X-ray detections
Analysis of the Chandra X-ray data was carried out using the CIAO package (version ) and is based on the photon event files provided by the Chandra pipeline. As a first step in the analysis, the event files were screened for photons with energies higher than keV to exclude low-energy background photons. Thermal X-ray spectra with typical coronal temperatures provide most of the flux above the limit of keV. We then examined those count events originating in the vicinity of the anticipated optical positions of our sample stars, which were taken from the SIMBAD data base and appropriately corrected for proper motion. Around the thus defined positions we extracted all photons within a circular detect cell. The detect cell sizes were calculated from the point response functions for Chandra’s ACIS-S instrument as provided in the CIAO data base. We specifically used on-axis point response functions, with the energy of the contributing photons fixed to keV. From these simulations we deduced that % of the counts from a point-like source are contained in a circle with a arcsec radius. This circle defines our detect cell, within which we counted all registered events in the energy band from keV. We excluded events with energies above keV here (but not in the spectral analysis carried out in Sect. 3.1) to avoid losing sensitivity due to high-energy background. The effective background was estimated from nearby regions in the X-ray images in an annulus between to arcsec around the central position (containing no obvious X-ray sources) and scaled to the chosen detect cell size. In all of our observations the estimated background per detect cell was found to be less than unity.
The results of this first step in the analysis of our Chandra data are summarized in Table 3. As is clear from Table 3, clear detections were obtained for 6 out of 10 target stars; a comparison of the extracted detect cell counts with the expected detect cell backgrounds shows our detections to be extremely significant, so we refrain from a formal statistical analysis (the probability of misidentifying the target stars with spurious sources is well below ). We mention in passing that in those cases we actually computed the center of gravity of the observed photon distribution, determined its sky coordinates, and computed the offset between X-ray and optical positions, which are also listed in Table 3; and the extracted detect cell counts refer to the center of the observed photon distribution. An inspection of the offsets shows most offsets to be small (i.e., 0.5 arcsec) and on the order of the pixel size; the two outliers HD 146001 and HD 217833 will be discussed below.
We searched for short-term variability in the X-ray light curves and especially for flare signatures, but no significant variations were found.
| HD111See Sect. 3.2.1 for the case of HD . | offset222The offset refers to the angular distance between X-ray and optical position. | detect cell333Detect cell as well as background counts listed in the table refer to the keV energy band. | expected bg.c |
| [as] | counts | counts | |
| Detections | |||
| 12767 | 0.05 | 122 | 0.012 |
| 15144A | 0.25 | 359 | 0.014 |
| 15144B | 27 | 0.014 | |
| 144334 | 0.28 | 354 | 0.04 |
| 146001 | 0.53 | 25 | 0.015 |
| 215441 | 0.13 | 72 | 0.081 |
| 217833 | 0.69 | 69 | 0.068 |
| Non detections | |||
| source counts | |||
| upper limits | |||
| 143473 | - | 2.9 | 0.248 |
| 147010 | - | 3.1 | 0.052 |
| 184905 | - | 3.1 | 0.049 |
| 208095 | - | 3.1 | 0.028 |
2.2 Non-detections and upper limits
Inspection of Table 3 shows that four of our sample stars (HD 143473, HD 147010, HD 184905, and HD 208095) were not detected in our Chandra data. In the cases of HD 147010, HD 184905, and HD 208095, not a single photon was detected in the detect cell, and one event was detected in the detect cell around HD 143473; note that in these four cases the detect cells had to be placed on the nominal optical positions of the target stars rather than the centroid of the best X-ray position. The case of HD 143473 is discussed further in Sect. 3.2.5. For the other stars we computed the expected source count, , yielding a measurement of zero counts with a % probability assuming Poisson statistics. Specifically we solved the equation
| (1) |
where the factor of accounts for % of the total counts contained in the detect cell, and denotes the expected background count. The resulting upper limit count rate is therefore given by /obs.time (see Table 3).
3 Individual sources – spectra and additional information
In this section we discuss the Chandra data of our target stars individually. Starting with a spectral analysis in Sect. 3.1 we proceed to give additional information on the properties of our sample objects in Sect. 3.2.
3.1 Spectral analysis
We performed spectral analysis of our X-ray data for those sources with more than counts (cf. Table 3). The methods applied to determining the spectral parameters are discussed in the following sections and the results summarized in Table 4.
| HD | temperature | Lx 111refers to the (unabsorbed) keV band |
| [keV] | [ erg/s] | |
| One temperature fits | ||
| 12767 | ||
| 15144A | ||
| 215441 | ||
| Two temperature fits | ||
| 144334 | and | 31 |
| Luminosity estimates with standard assumptions | ||
| 15144B | - | |
| 146001 | - | |
| 217833 | - | |
| Upper limits for non-detections | ||
| 143473 | - | 0.014 |
| 147010 | - | 0.02 |
| 184905 | - | 0.027 |
| 208095 | - | 0.04 |
3.1.1 HD 12767, HD 15144A, HD 215144
The X-ray spectra of these stars can be fitted with an absorbed, one-temperature APEC model. Leaving all parameters – hydrogen column density, temperature, abundances, and normalization – free, yields good fits but poorly constrains estimates of hydrogen column density and abundances. Assuming a mean density of particle/cm3 in the interstellar medium and fixing the hydrogen column density to the thus-obtained value does not lead to significantly worse fits. Furthermore, fixing abundances to times solar abundances ( for HD 12767) still results in good fits. The fitted temperature values are not sensitive to the choice of the other fit parameters, and we note in passing that different combinations of hydrogen column density and abundance also result in good fits, so that these parameters remain basically undetermined. The obtained temperatures are listed in Table 4. Errors correspond to values calculated with fixed column density and abundances. In Table 4 we also give the X-ray luminosity derived from the spectral fits.
3.1.2 HD 144334
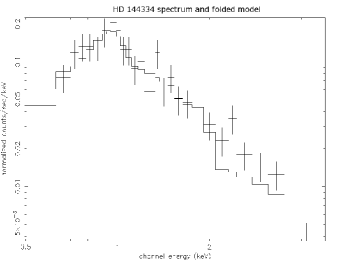
Figure 1 shows the spectrum of HD 144334 and a model fit to the spectrum. This spectrum cannot be fitted with a one-temperature model, so we instead use an absorbed, two-temperature APEC model to fit the data appropriately. Unfortunately the data quality is such that - again - well-defined constraints cannot be derived for most parameters. As in the cases discussed in Sect. 3.1.1, fixed values for hydrogen column density, according to the assumption of a mean interstellar density of particle/cm3 and times solar abundance, result in a good fit (see Fig. 1). Table 4 lists the temperatures of both spectral components and the X-ray luminosity obtained from the fit.
3.1.3 HD 15144B, HD 217833 and HD 146001
Reasonable spectral fits cannot be obtained for these stars due to insufficient count statistics. Although more than counts were registered from HD 217833, no temperature could be derived. Thus, we used standard assumptions to estimate the X-ray luminosity of these objects. In particular, we used a hydrogen column density according to particle/cm3 and a spectral energy distribution corresponding to a Raymond-Smith model at Log(T)= and times solar abundances (compatible with the results of the spectral fits carried out for the other objects). Applying these assumptions, we used the WebPIMMS tool to convert count rate into flux. The results are listed in Table 4
3.1.4 Non-detections
3.2 Comments on individual sources
3.2.1 HD 15144
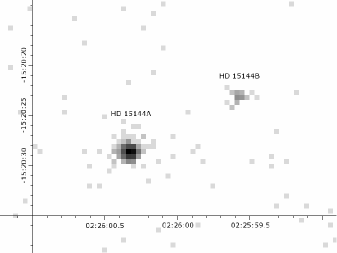
HD 15144 is an A6V star with a magnetic field of kG. With Hipparcos, HD 15144 was resolved into two components, separated by arcsec at a position angle of . Both components are clearly visible in our Chandra image (see Fig. 2). The two X-ray sources are separated by arcsec at a position angle of . In Table 3 we therefore list both HD 15144A (the more luminous component both in the optical and at X-rays) and HD 15144B. From the magnitude difference measured by Hipparcos we estimate a spectral type of G for the fainter companion, assuming it to be located on the main sequence. Furthermore, Leone & Catanzaro (1999) point out that HD 15144A is actually a spectroscopic binary, the close companion not being resolved by Chandra. Unfortunately, Leone & Catanzaro (1999) do not discuss the nature of the companion, HD 15144Ab, any further. They merely provide the mass function for this system. Assuming and a mass of 2.0 M⊙ for the primary, we derived a (minimum) mass of M 0.2 M⊙ for the secondary, and smaller inclinations lead to larger masses. If we go on to assume that the orbit period of days is also the rotation period of HD 15144Ab, then HD 15144Ab is clearly a very plausible candidate for the observed X-ray emission at the position of HD 15144A.
3.2.2 HD 215441 - Babcock’s star
Babcock’s star (=HD 215441; spectral type A0p) is the star with the strongest magnetic field in our sample and in fact in the whole Bychkov catalog. Our Chandra observations (72 source counts) provide the first unambiguous evidence for X-ray emission from this unusual object; X-ray emission had been previously reported by Schmitt et al. (2004) on the basis of a rather faint ROSAT-PSPC source. Unfortunately the parallax of Babcock’s star has a large error, the Hipparcos catalog gives a value of mas, and consequently the computed X-ray luminosity as given in Table 4 is also very uncertain. No companion to Babcock’s star is known.
3.2.3 HD 217833
The star HD 217833 is classified as B9III, and according to the Hipparcos data it is a double system. The angular separation of the optical components is given as arcsec at a position angle of 140∘. We clearly detect HD 217833 in our Chandra data (69 counts); however, the offset between the X-ray and optical positions is arcsec with a position angle of 145∘ (cf. Table 3). Obviously the positional agreement is very much improved if we consider HD 217833B as the dominant contributor to the X-ray emission from the HD 217833 system. Hipparcos does not reveal the nature of the companion but gives the magnitude difference between the primary and secondary components. From this we estimate a spectral type of F for the companion, assuming it to be located on the main sequence. Due to the short lifetime of the primary B-star, the system must be young and the companion may still be in a pre-main sequence phase. In both cases the companion is a plausible candidate for the observed X-ray emission.
3.2.4 HD 12767, HD 144334, HD 146001
The stars HD 12767, HD 144334, and HD 146001 have spectral types B9.5, B8V, and B8V respectively. All of these stars are clearly detected as X-ray sources with good agreement between the optical and X-ray positions. None of these stars is classified as a binary, therefore all are bona fide candidates for magnetic stars with X-ray emission. We note that Hipparcos indicates possible binarity for HD 144334, but an adaptive optics near-infrared survey (Kouwenhoven et al. 2005) shows no evidence of any stellar companion. Kouwenhoven et al. (2005) also find no signatures of any companion around HD 146001 (cf. Table 5). Interestingly, HD 144334 and HD 12767 show optical variability. HD 144334 is a variable of the SX Ari type with a period of days, HD 12767 is an Canum Venaticorum variable with a period of days, and both SX Ari and Canum Venaticorum type variables are rotational variables. The last refer to magnetic main sequence stars of spectral type F-B showing strong lines of silicon, strontium, chromium, and rare earths. The brightness and magnetic field both vary with rotational phase; amplitudes are mag. The SX Ari type variables show basically the same characteristics but are hotter (spectral types B-B). As for HD 215441, the stars HD 12767, HD 144334, and HD 146001 are the best candidates for intrinsic X-ray emission from late B-type stars.
3.2.5 HD~143473, HD 147010, HD 184905, and HD 208095
The stars HD 143473, HD 147010, HD 184905, and HD 208095 have spectral types B9, B9II/III, A0p, and B6IV-V, respectively. No photons were recorded from HD 147010, HD 184905, and HD 208095, and a single event was found within the detect cell around HD 143473 (referring to the keV band). Should this photon be attributed to HD 143473 and the star be considered an X-ray source? We first note that, with an expected background count of counts/detect cell, the probability of finding exactly one background photon is . In the cases of HD 147010, HD 184905, and HD 208095, the probability of finding no background photon within the detect cell is about . Assuming no intrinsic X-ray emission from these stars, the probability of recording no background photon in these four detect cells is about .
We next note that the photon in question was recorded at a distance of arcsec from the nominal source position. According to our point response modeling % of the source photons originating from a point source should be located at distances arcsec or farther from the center; in other words, by assuming the photon in question is a source photon, the probability of recording this photon at a distance of arcsec is . In conclusion, attributing the photon to the background is the simplest and in fact more probable hypothesis, and we therefore consider HD 143473 as a non-detection.
An infrared survey by Kouwenhoven et al. (2005) revealed no companions for HD 143473 and HD 147010. An object was found close ( arcsec) to the position of HD 143473 but is classified as a background star. Shatskii (1998) points out that HD 208095 is a triple system. From the given (B-V) colors and assuming all components to be located on the main sequence, we estimate that both A and B components are of late B-type or early A-type ((B-V) mag), and the third component has a late spectral type ((B-V) mag). For HD 184905, at least Hipparcos does not indicate binarity.
4 Comparison to ROSAT
For of the stars listed in Table 2, ROSAT detections and count rate measurements are available. In order to test whether the X-ray properties of these objects have significantly changed between the ROSAT and Chandra observations, we plot (in Fig. 3) the measured ROSAT-PSPC count rate vs. the Chandra count rate (referring to the keV band for Chandra). We apply the ROSAT count rates given in the RXS catalog for all stars apart from HD 215441, which is listed only in the RXP catalog (the paper presenting the assignment of the ROSAT sources is in preparation). Obviously, the ROSAT and Chandra count rates are correlated well and, given the substantial errors in some of the ROSAT count rates where most of these rates come from the all-sky survey, there appears to be no substantial variability between these X-ray observations that were taken typically more than ten years apart.

5 Discussion
5.1 Binarity of the sample stars
The information about binarity in our sample objects is summarized in Table 5. Seven of our stars do not possess a known companion and are considered as bona fide single stars in the following; star belongs to a binary system, and another stars are members of triple systems. Four of the single objects and of the multiple systems were detected as emitting X-rays.
| HD | known | single | X-ray | data |
| components | object11footnotemark: 1 | detection11footnotemark: 1 | origin | |
| 12767 | 1 | H | ||
| 15144 | 3 | - | H&CL | |
| 144334 | 1 | K | ||
| 146001 | 1 | K | ||
| 215441 | 1 | H | ||
| 217833 | 2 | - | H | |
| 143473 | 1 | - | K | |
| 147010 | 1 | - | K | |
| 184905 | 1 | - | H | |
| 208095 | 3 | - | - | S |
1 A -sign marks applicable properties
All of our sample stars that are also contained in the sample of Kouwenhoven et al. (2005) are classified as single stars. Two of these stars are detected in X-rays, while two are not. Assuming a KS magnitude of K mag (corresponding to spectral type M or brighter) in the near infrared for possible companions and a magnitude difference K for primary and secondary, the angular separation between primary and any companion cannot exceed arcsec; otherwise, the companion ought to show up in the survey. Note that Kouwenhoven et al. (2005) do detect companions with angular distances down to arcsec, but this accuracy can only be reached under advantageous circumstances.
5.2 Magnetic fields and X-ray luminosities
In Fig. 4 we plot magnetic field strength against X-ray luminosity Lx. The behavior of binary systems does not seem to differ from that of presumably single stars so that a different nature of these objects is not required. The upper limits derived for the non-detected stars are located more than an order of magnitude below the lowest observed X-ray luminosity, suggesting substantially different X-ray properties for these objects.

The behavior of the objects as illustrated in the plot is compatible with the companion hypothesis, assuming the non-detections to be single stars and the detected ones to be binaries with X-ray bright companions. The X-ray emission thus originates from otherwise unobserved late type or pre-main sequence companions. We note in passing that the cut off at erg/s below which no detection is found represents the ROSAT detection limit. Similar results are arrived at by Daniel et al. (2002) in an analysis of Pleiades member stars. Their results point to the existence two classes of late B to F-type stars: on the one hand, apparent X-ray emitters (L erg/s) and, on the other, X-ray dark objects with upper X-ray luminosity limits times lower than the values obtained for the apparent emitters. Daniel et al. (2002) also point out that indications for the presence of a late-type companion exist in every case a late B to F-type star is found to be X-ray bright.
5.3 Application of the magnetically confined wind-shock model
In the following we demonstrate that the observed X-ray emission can also - alternatively - be interpreted in the frame of the magnetically confined wind-shock model. This model was introduced by Babel & Montmerle (1997) as a possibility to explain the X-ray emission from magnetic late B-type and A-type stars, and was applied to the magnetic A0 star IQ Aur. It predicts X-ray emission as the result of the interplay of a radiatively driven stellar wind and the magnetic field; the interaction occurs because sufficiently strong magnetic fields force the wind particles to move along the magnetic field lines. In their calculations Babel & Montmerle (1997) assume a dipolar magnetic field structure, co-aligned with the rotation axis of IQ Aur, limiting the regions of wind outflow to the surroundings of the polar caps. The equations of motion of the trapped particles were solved along the field lines. In the equatorial plane, the trapped wind components originating on either of the stellar hemispheres collide and shock. In the shock region, kinetic wind energy is transformed and heats up the plasma, which subsequently radiatively cools through X-ray emission. Babel & Montmerle (1997) estimate the shock temperature, , assuming a strong adiabatic shock, the specific heat ratio of , and a mean molecular weight of for the shocked material from the Rankine-Hugoniot jump relation
| (2) |
Here denotes the velocity of the shock-forming wind components. From their calculations Babel & Montmerle (1997) derive a scaling law for the X-ray luminosity as a function of stellar magnetic field, , wind velocity, , and a mass loss rate, , of the form
| (3) | |||||
which makes the model applicable to a wide range of parameter values. For and , the values and are derived from the calculations. As discussed by Babel & Montmerle (1997), the observed X-ray luminosity of IQ Aur necessitates very effective transformation of kinetic energy in the shock region to be compatible with the mass loss rate inferred from radiative wind models.
Assuming then that at least some of the detected stars are indeed intrinsic X-ray emitters, we investigated to what extent the magnetically confined wind-shock model developed by Babel & Montmerle (1997) can be applied to interpret our data. We in particular assumed that the detected stars do possess radiatively driven winds and an approximately dipolar magnetic field configuration. Applying Eq. 2, we computed the wind velocities required to produce the temperatures indicated by our spectral analysis (see Table 4) and used Eq. 3 to derive the mass loss rates predicted by the model (we assume that ). The results of our calculations are listed in Table 6. For HD 144334 two parameter values are derived corresponding to the two spectral components needed to fit the spectrum – we note that the characteristics of the hotter component are only loosely determined. For IQ Aur, Babel & Montmerle (1997) determine wind velocities of km/s at the equator (where the shock occurs) and a mass loss rate of Myr. These values are compatible with those derived for our objects.
| HD | [km/s] | [ /yr] |
|---|---|---|
| 12767 | 895 | 0.2 |
| 15144A | 901 | 0.1 |
| 144334 | 934 / 2770 | 0.26 / 0.4 |
| 215441 | 860 | 0.2 |
We, thus, conclude that the magnetically confined wind-shock model is a possible explanation for the X-ray emission observed from our sample objects.
6 Summary and conclusion
In this paper we present Chandra observations of intermediate-mass stars with substantial magnetic fields between and kG. Six out of our sample of stars show X-ray emission. ROSAT detections are available for these stars although the ROSAT detection is somewhat marginal in the case of Babcock’s star. Two of the detected stars in our sample, HD 15144 and HD 217833, are visual binaries and were resolved with Chandra for the first time. In both cases the companions are of late-type. For HD 217833, the binary separation is quite close ( arcsec) and all of the observed X-ray emission can be attributed to HD 217833B. In the case of HD 15144 with a binary separation of 12 arcsec, two X-ray sources are clearly seen (cf. Fig 2); however, the primary component itself is a spectroscopic binary with a possible late-type companion. Significant short-term variability could not be detected for any of the sources.
The remaining four stars (HD 12767, HD 144334, HD 146001, HD 215441 = Babcock’s star) all possess large magnetic fields and are clear X-ray sources with X-ray positions in excellent agreement with their optical position. None of these stars is known to be binary. Crude spectral analysis can be carried out for some of the detected sources, and it indicates X-ray temperatures of 0.8 keV. With these numbers it is then possible to demonstrate that the detected X-ray emission can in principle be explained in terms of the magnetically confined wind-shock model. Therefore, a companion must not necessarily be held responsible for the X-ray emission.
However, our sample comprised stars with magnetic field strengths well above kG, but only (HD 215441 and HD 217833, the latter a binary) were detected as X-ray sources, suggesting that a large magnetic field strength need not necessarily lead to large X-ray emission and other parameters, such as wind speed, are more important. Obviously, the sample size necessitates extreme caution and prevents any firm conclusion. Clearly, in stars with such large magnetic fields as found, for example, in Babcock’s star, we expect any convective motions to be efficiently suppressed. Therefore a dynamo operation is rather hard to envisage. The X-ray emission from Babcock’s star can be interpreted in the framework of the confined wind-shock model, while in the binary scenario a companion would have to be held responsible for the detected X-ray emission. Therefore Babcock’s star represents a true challenge to our understanding of X-ray emission from stars without convective envelopes. It is certainly worthwhile carrying out deep searches for late-type companions, as well as searches for spectroscopic wind signatures.
References
- Babel & Montmerle (1997) Babel, J. & Montmerle, T. 1997, A&A, 323, 121
- Bychkov et al. (2003) Bychkov, V. D., Bychkova, L. V., & Madej, J. 2003, A&A, 407, 631
- Daniel et al. (2002) Daniel, K. J., Linsky, J. L., & Gagné, M. 2002, ApJ, 578, 486
- Fleming et al. (1991) Fleming, T. A., Schmitt, J. H. M. M., Barstow, M. A., & Mittaz, J. P. D. 1991, A&A, 246, L47
- Gagné et al. (1997) Gagné, M., Caillault, J.-P., Stauffer, J. R., & Linsky, J. L. 1997, ApJ, 478, L87+
- Golub et al. (1983) Golub, L., Harnden, F. R., Maxson, C. W., et al. 1983, ApJ, 271, 264
- Groote & Schmitt (2004) Groote, D. & Schmitt, J. H. M. M. 2004, A&A, 418, 235
- Isobe (1991) Isobe, S. 1991, Proceedings of the Astronomical Society of Australia, 9, 270
- Kouwenhoven et al. (2005) Kouwenhoven, M. B. N., Brown, A. G. A., Zinnecker, H., Kaper, L., & Portegies Zwart, S. F. 2005, A&A, 430, 137
- Leone & Catanzaro (1999) Leone, F. & Catanzaro, G. 1999, A&A, 343, 273
- Sanz-Forcada et al. (2004) Sanz-Forcada, J., Franciosini, E., & Pallavicini, R. 2004, A&A, 421, 715
- Schmitt et al. (2004) Schmitt, J., Groote, D., & Czesla, S. 2004, in Proceedings of the 13th Cambridge Workshop on Cool Stars, Stellar Systems and the Sun, held at Hamburg, Germany, July 5-9, 2004, Eds.: F. Favata, G.A.J. Hussain, B. Battrick, p. 943., ed. B. B. F. Favata, G.A.J. Hussain, 943
- Schmitt & Kürster (1993) Schmitt, J. H. M. M. & Kürster, M. 1993, Science, 262, 215
- Schmitt et al. (1993) Schmitt, J. H. M. M., Zinnecker, H., Cruddace, R., & Harnden, F. R. 1993, ApJ, 402, L13
- Shatskii (1998) Shatskii, N. I. 1998, Pis ma Astronomicheskii Zhurnal, 24, 307
- Smith et al. (1993) Smith, M. A., Grady, C. A., Peters, G. J., & Feigelson, E. D. 1993, ApJ, 409, L49
- Stelzer et al. (2006) Stelzer, B., Huélamo, N., Micela, G., & Hubrig, S. 2006, A&A, 452, 1001
- Townsend & Owocki (2005) Townsend, R. H. D. & Owocki, S. P. 2005, MNRAS, 357, 251
- Townsend et al. (2005) Townsend, R. H. D., Owocki, S. P., & Groote, D. 2005, ApJ, 630, L81
- Ud-Doula et al. (2006) Ud-Doula, A., Townsend, R. H. D., & Owocki, S. P. 2006, Cosmic Particle Acceleration, 26th meeting of the IAU, Joint Discussion 1, 16-17 August, 2006, Prague, Czech Republic, JD01, #29, 1