Evidence for Cold Accretion onto a Massive Galaxy at High Redshift?
Abstract
In this letter we report on the discovery of a =2.83 Lyman- Blob (LAB) found in our wide field narrow-band survey within the Spitzer First Look Survey region. The blob is extended over at least 95kpc and has a total Lyman- luminosity of 2.1 erg s-1. It is only the sixth LAB known of this scale ( 50 kpc), and is associated with an embedded continuum source in g’, R, i’, K & 4.5 m bands. The LAB’s optical spectrum shows clumpy structures and tantalising hints of a sharp red cut-off and shear within the Ly- emission line. Studies of the LAB’s surface brightness profile and of the continuum counterpart’s spectral energy distribution (SED) indicate that the profuse Lyman- emission is consistent with being powered by cold gas accreting onto a massive dark matter halo.
keywords:
Galaxies: High-Redshift, Galaxies: Haloes; Galaxies: Formation1 Introduction
Recently, much success has been gained in picking out high redshift galaxies using a narrow-band filter to scan their Lyman emission in a small redshift “slice” of the distant universe. Steidel et al. (2000 - hereafter S00), for example, discovered a ‘spike’ in the redshift distribution of a sample of LBGs at =3.09 and observed the region with a narrow-band filter tuned to pick out Lyman emitting galaxies at that redshift to confirm the presence of a proto-cluster. They not only found evidence of a proto-cluster, but also discovered two very extended ( 100kpc) and extremely luminous (L erg s-1) regions of Lyman emission with very faint continuum and no radio detections. They named these objects “Lyman Blobs” (LABs) on account of their almost monochromatic emission and amoebic appearance.
Perhaps the most mysterious aspect of LABs is the apparent lack of an obvious source of ionisation to power such profuse Lyman emission. A variety of models have been suggested to explain this apparent omission; three of the most plausible explanations are: (i) the Lyman- emission comes from a dust-enshrouded, extreme starburst galaxy with a large scale superwind (e.g. Taniguchi & Shioya 2000; Ohyama et al. 2003; Wilman et al. 2005), (ii) LABs contain hidden QSOs (e.g. Haiman & Rees 2001; Weidinger, Møller & Fynbo 2004; Weidinger et al. 2005) or (iii) that we are observing the cooling radiation of a collapsing proto-galaxy inside a dark matter halo’s gravitational potential (the so-called “cold accretion” model - e.g. Haiman, Spaans & Quataert, 2000, Fardal et al., 2001, Matsuda et al., 2004, Nilsson et al., 2006) .
Currently only 5 of the most extended (50kpc scale) LABs are known (see S00, Francis et al., 2001, Dey et al., 2005, Nilsson et al., 2006), and it is clear that more are required before we can pin down the source of ionization with any certainty, or explain the clustering or evolutionary aspects of LABs within the ever-increasing compendium of high redshift objects.
In the following sections, we present our wide field survey, give an account of the discovery of this new LAB, discuss our results & state the conclusions we have drawn. Throughout this letter the AB magnitude system is used (Oke & Gunn, 1983), and a standard cosmology is assumed in which = 71 km s-1, = 0.27 and = 0.73.
2 Our Survey
In an attempt to pick out a statistically meaningful sample of LABs, we have adopted a different approach from other narrow-band surveys which have tended to concentrate on covering a small or moderate sky area to large depth (e.g. Matsuda et al., 2004, Nilsson et al., 2006 and Saito et al., 2006). By exploiting the comparatively large field of view of the Wide Field Camera on the Isaac Newton Telescope (INT-WFC) our survey has concentrated on covering a very wide area ( 15 sq. degrees) to relatively modest flux limits. In this way we can compensate for the necessarily small co-moving volume probed by a narrow-band filter and as a result we are sensitive to the brightest, most extended and rarest LABs.
We have observed three areas of sky which allow us to take advantage of high quality public survey data. The fields we have observed are; the SWIRE region within the XMM Newton Large Scale Structure survey field (XMM-LSS) centred on 02h18 -05∘00 (see Lonsdale et al., 2003); the Lockman Hole (LH; 10h50 +57∘00; see Lonsdale et al., 2003) and the Spitzer First Look Survey (FLS; 17h18 +59∘30, see Lacy et al., 2005)
Our survey comprises observations from three different narrow-band filters, along with complementary observations over the same fields in Sloan g’ and i’ bands. The narrow-band filters used (HeII, Hb, and [OIII]r) come from the WFC filter set, and are centred on 4686, 4861 & 5008 Å, with full-width half maxima of 100, 170, & 100 Å, respectively. For the narrow-band observations discussed in this letter, we have used the HeII narrow-band filter; the data are found to be complete to HeII, g’, and i’ respectively (5), while the seeing in the narrow-, g’-, and i’-band data are 1.03′′, 1.25′′ and 1.17′′ respectively.
Our data were de-biassed, trimmed, flat-fielded, bad pixel- and gain-corrected, astrometrized, stacked and photometrically calibrated using the Cambridge Astronomical Survey Unit WFC pipeline (Irwin & Lewis, 2001). General catalogues were generated from matched pointings using SExtractor (Bertin & Arnouts, 1996) in double image mode. Sources of more than 5 adjacent pixels above 1 from the measured mean in a 4′′ aperture centred on the peak pixel are source extracted. LAB candidates are selected from our matched SExtracted g’ and HeII catalogues based on their Equivalent Widths (EWs), which are estimated from their photometry by defining an R parameter, where
| (1) |
(from Venemans et al., 2003). Here g’AB and HeIIAB represent the broad- and narrow-band magnitudes of a source. We can then estimate the observed equivalent widths () of each source using
| (2) |
where and are the widths of the narrow- and broad-band filters respectively. LAB candidates are then selected if they have an greater than 200Å and HeII. It should also be noted that Hayes & Östlin (2006) suggest that equivalent widths estimated in this manner may be a factor of 2 greater than the true value, however our follow-up observations do not show this discrepancy (see section 3).
Our narrow-band data are also sensitive to low-redshift line emitting galaxies. The main contaminant population will be [OII]3727 at 0.26. Thus, with our selection of line emitting galaxies at Å, any [OII] emission line would have to have a rest-frame equivalent width of 160 Å. Hogg et al.(1998) surveyed 375 [OII] emitters within a huge volume spanning 0.0 1.2, and found only two [OII] emitters with 100 Å and none with 120Å. A higher fraction of Å [OII] emitters have been found at higher redshift (e.g. Ajiki et al. 2006), but this is attributed to evolution rather than a selection bias at lower redshift. When this is taken into account, we expect to find 0.21 0.46 [OII] emitters with such high EWs in our coverage of the FLS region.
Once selected, each candidate must then be checked to confirm that it is a probable LAB; high proper motion objects, passing satellites, objects in the haloes of saturated stars and amplifier crosstalk artefacts must all be eliminated. Thus, each candidate is inspected by eye to remove these “false positives” from the sample. The remaining candidates are considered robust LAB candidates and await follow-up spectroscopy.
3 First Results - A Lyman- Blob at =2.83
3.1 The Lyman- emission
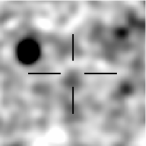
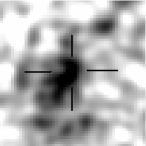
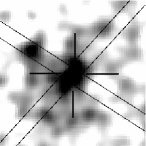
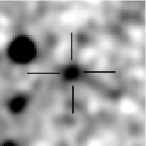
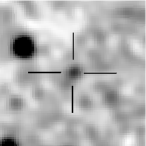
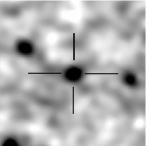
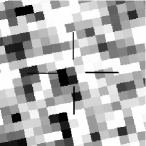
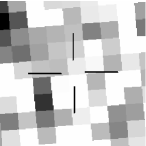
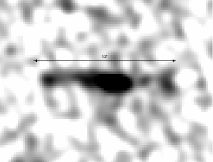
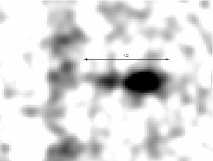
Figure 1 shows our first spectroscopically confirmed LAB at 17h09m52.3s +59∘13′ 2172 (J2000) in various wave-bands. It is clearly bright and extended in the HeII narrow-band filter, while it is comparatively faint and compact in the g’ and i’ band images. The Ly- emitting structure is most clearly revealed in the continuum-subtracted figure 1(b) and has an observed equivalent width of Å. The photometric data for this new LAB at =2.83 are presented in table 1. We observed this LAB candidate with the William Herschel Telescope ISIS spectrograph with the blue and red arms using the R158B and R158R gratings respectively and with a 2′′ slit width. This results in a spectral resolution of 15Å, and wavelength coverage between 3500–8300Å. The one and two dimensional spectra can be inspected in figure 2, in which it is clear that the emission is extended over , corresponding to 95 kpc at this redshift.
| Photometric Band | AB Magnitude |
|---|---|
| u⋆ | 26.44 |
| Sloan g’ | 23.97 |
| HeII(468.6) | 22.16 |
| R | 23.81 |
| Sloan i’ | 24.07 |
| J | 19.74 |
| K | 21.05 |
| 4.5 m | 20.71 |
| 24 m | 19.45 |
| 610 MHz | 19.14 |
| 1.4 GHz | 20.65 |
We identify the line as Ly- based on its EW, which is too high to be caused with any reasonable probability by a low-redshift interloper (see section 2), particularly with the absence of any other emission lines in our wavelength range (3500 – 8300 Å). The FWHM of the line is 970 km s-1, unresolved at our spectral resolution, and the total Ly- flux across the entire extent of the structure in the ISIS spectrum is erg s-1 cm-2, the difference from the photometric measurement in the narrow-band filter being due to the geometry of the slit and the 4′′ aperture. Integrating across the entire extent of the LAB in the continuum-subtracted image, we estimate the total luminosity of the Ly- emission to be erg s-1.
The 2D spectra in figure 2 not only show a “clumpy” structure, but the emission line also seems to possess both a cut-off on the red side of the line (perhaps indicative of a rapid outflow velocity structure – see section 4, below), and hints of a possible shear which may be interpreted as rotation, although in neither case do we have the resolution to make a definitive statement; it is clear that higher resolution spectroscopy is required.

3.2 The host galaxy
LABs are reminiscent of the large haloes that surround powerful radio galaxies but with less than 1% of the associated radio emission (e.g. Reuland et al., 2003). Using the FLS-VLA survey at 1.4 GHz of Condon et al. (2003), we find that there is no detectable radio emission down to a radio flux-density limit of 60Jy (3). The LAB is also not detected in 610 MHz data taken using the Giant Metre-wave Radio Telescope (GMRT) from Garn et al. (2007) to a flux limit of 240Jy (3). Thus it is clear that our LAB is significantly fainter than the radio luminosity of powerful radio sources, with a radio luminosity of W Hz-1 sr-1.
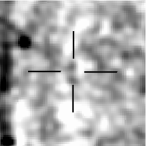
At near-infrared wavelengths we obtained service-mode band data of the LAB using the UKIRT Fast Track Imager (UFTI; Roche et al., 2003) on source for 3780s [Figure 1(h)]. From our observations we find that the LAB has K. We also obtained a 1200s band image from the Long-slit Intermediate Resolution Infrared Spectrograph (LIRIS; Manchado et al. 1998) on the WHT, in which the LAB’s continuum counterpart is not detected to a 1 magnitude limit of J 19.74.
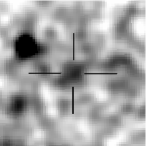
The LAB falls just off the edge of the IRAC data in channels 1 & 3, but it is covered by channels 2 & 4 - right on the edge of the image. Although it looks by eye as though there is a faint detection in channel four, it is severely affected by reduced signal to noise near the chip edge and we only show the m data in figure 1. The 24 m MIPS data however do cover the region around the LAB and a thumbnail image is displayed in figure 1(j). There is a faint source within a 10′′ radius of the i’- and K-band continuum source, but it is considerably below the completeness limit of 300Jy, and is firmly within the noise-dominated regime. It appears to occupy the same position as a knot of Ly emission to the South-East of the centre of the LAB in figure 1(c). If this 24m emission is real and associated with the knot of Ly- in question, it would imply the presence of a dust enshrouded burst of star formation. However deeper observations at this wavelength are clearly required to confirm this. It is considered unlikely that the association is indicative of an obscured AGN since it is offet from the continuum source in the centre of the LAB by kpc at this redshift, and there is also no other evidence of an AGN anywhere within the halo.
Furthermore, we fit SED templates to the photometry of the embedded galaxy using our multi-wavelength data set (figure 3). We use the Bruzual & Charlot (2003) model SEDs normalised to the K-band flux to determine the mass of the embedded galaxy. The K-band flux is used for the normalisation since it is the least likely to be affected by dust (the uncertainty on our 4.5m point is prohibitively large), and is thus the most representative measure of the galaxy’s old stellar emission available to us. We use a variety of different populations to fit synthetic SEDs to our observations; simple stellar populations of six different metallicities, twenty-one different ages between 10 Myr and 2.3 Gyr (the age of the Universe at =2.83 is 2.344 Gyr in our adopted cosmology), and initial mass functions (IMFs) from Chabrier (2003) and Salpeter (1955) are all used. Our LAB photometric data are poorly matched by a single simple stellar population (SSP), so linear combinations of young ( 200 Myr) and old ( 500 Myr) SSPs of varying metallicities and IMFs are used in an attempt to better approximate the SED.
We find that the best fit to our data points is a combination of a young (20 Myr) and an old (1.0 Gyr) SSP with a Chabrier IMF and solar metallicity (Z ). In particular, dust extinction is not required to give a good quality fit to the data, consistent with the absence of any significant 24m detection. With this SED fit, we calculate a stellar mass for this LAB of M , consistent with the most massive galaxies observed at high redshifts such as the hosts of powerful active galactic nuclei (e.g. Jarvis et al. 2001; McLure et al. 2006), and find that 20% of the LAB counterpart’s stellar luminosity comes from the young starburst population, with the remaining 80% arising from the old population.
We now consider the possibility that the counterpart galaxy within the LAB may be supplying the source of ionization for the LAB. We estimate from the model SED that the counterpart galaxy has a bolometric luminosity (blue-ward of the rest-frame Lyman limit, as would be expected for case B recombination) of 2.4 erg s-1. Thus we conclude that at most only 1% of the LAB’s Lyman emission may be powered by the counterpart galaxy.
4 Discussion
In this section we attempt to distinguish between the three ionization models for LABs discussed in section 1.
In the absence of detections in both the 24m and 1.4 GHz bands, the obscured QSO ionization model is highly unlikely. The flux limits in these bands essentially rule out the presence of a powerful AGN (both obscured and unobscured). Moreover, the absence of any high-ionisation lines (such as CIV or CIII) indicative of an AGN, coupled with an optical/infrared SED (figure 3) that is approximated very well by two simple stellar populations, give no indication of the presence of an AGN at all.
To estimate whether the central galaxy is a massive starburst galaxy we estimate its star-formation rate (SFR) from three different diagnostics. These are based on the ultra-violet, radio and Ly- luminosities (see Brocklehurst 1971, Kennicutt 1998, and Yun, Reddy & Condon 2001), where
| (3) |
For our LAB we find using the UV continuum luminosity (estimated from the SED fit) that the SFR of the embedded galaxy is 23.9 yr-1. The radio data only provides a large upper limit ( ) so is not considered further. The SFR based on the Ly- emission of the counterpart galaxy is more complicated, since it is difficult to separate the Ly- emission of the galaxy from that of the halo. Thus, to estimate the SFR of the host galaxy we use the Ly luminosity measured in the central 4 arcsec which gives SFR , consistent with our UV-based estimate. These optical SFR estimators assume the absence of dust; any extinction would imply that these estimates represent a lower limit. However, we find no evidence for large dust masses using both the properties of our SED fit and the absence of any detectable reprocessed emission at 24m.
These results are highly significant since Fardal et al. (2001), using hydrodynamic simulations of the cold accretion model, predict that LABs should have moderate star-forming galaxies at their centres. Although they predict slightly larger SFRs of 60–600 yr-1, our values are within the right order of magnitude (particularly given the uncertainty in both the models and in the relations given in equations 4). Furthermore, the cold accretion models from Dijkstra et al. (2006) also predict a sharp cut-off on the red side of the Ly- line of the type hinted at by the red edge of our emission line in figure 3(a).
On the other hand, the superwind model of Matsuda et al. (2004), estimates a SFR of 600 yr-1 for a 100kpc LAB, and draws a parallel between this and the submillimeter detection (and thus high SFR 1000 yr-1) of LAB1 from S00 (Chapman et al., 2001). Our SFRs are considerably more quiescent; they may be able to cause some outflow, but it is probably unlikely that a starburst of this magnitude could cause superwinds of the types suggested by Taniguchi & Shioya (2000), Ohyama et al.(2003) or Matsuda et al.(2004).


To further evaluate the likelihood of this LAB being a collapsing cloud of neutral hydrogen in a dark matter halo, we compare the Ly- surface brightness profile (SBP) of the new LAB (figure 4) with that predicted by Dijkstra et al. (2006). We find that there is a very good fit between our SBP and extended cold-accretion “Model 2” from Dijkstra’s paper, with a total mass of 5.2 . The biggest deviation from Dijkstra’s model is an apparent increase in the continuum-subtracted surface brightness around r 50kpc. This is clearly not due to the nearby galaxy to the North-East of the blob centre as demonstrated in figure 1(b); it is rather a manifestation of clumpy sub-structure within the LAB. This is not predicted by the cold-accretion model of Dijkstra (2006), which assumes the gas within a LAB to be spherically symmetric. Future higher-resolution spectroscopy over the whole halo would help to distinguish between a starburst driven superwind and the cold-accretion model, however the current evidence favours the cold accretion model.
5 Conclusions
-
•
We have presented our wide-field narrow-band survey, and demonstrated its ability to pick out LABs at high redshift. Over the whole survey we expect to find a significant number of LABs to determine their nature fully.
-
•
We have shown the first confirmed LAB from our survey as being extended over 95kpc and having a Lyman luminosity of 2.1 erg s-1.
-
•
Our LAB is best described by the cold accretion ionization models of Fardal (2001) and Dijkstra (2006), although we cannot completely rule out the superwind model. It is highly unlikely that our LAB contains an AGN component. Further studies are required to strengthen our confidence in these assertions and also to gain better mass estimates for this LAB.
ACKNOWLEDGEMENTS
The authors would like to thank Eduardo González-Solares for his assistance with the CASU WFC pipeline, Richard Wilman, Garret Cotter & Alejo Martínez-Sansigre for valuable discussions, and Hyunjin Shim for proprietary u⋆ band data. DS thanks the UK PPARC for a studentship. The INT and WHT are operated on the island of La Palma by the Isaac Newton Group in the Spanish Observatorio del Roque de los Muchachos of the Instituto de Astrofisica de Canarias. The National Optical Astronomy Observatory (NOAO) is operated by the Association of Universities for Research in Astronomy (AURA), Inc. under cooperative agreement with the National Science Foundation. The United Kingdom Infrared Telescope is operated by the Joint Astronomy Centre on behalf of the U.K. Particle Physics and Astronomy Research Council and some of the data reported here were obtained as part of the UKIRT Service Programme.
References
- [1] Ajiki M., et al., 2006, PASJ, 58, 113A
- [2] Bertin E., & Arnouts S., 1996, A&AS, 117, 393B
- [3] Brocklehurst M., 1971, MNRAS, 153 471B
- [4] Bruzual G., & Charlot S., 2003, MNRAS, 344, 1000B
- [5] Chabrier G., 2003, PASP, 115, 763C
- [6] Chapman S.C., Richards E.A., Lewis G.F., Wilson G., &Barger A.J., 2001, ApJ, 548, L17
- [7] Condon J.J., Cotton W.D., Yin Q.F., Shupe D.L., Storrie-Lombardi L. J., Helou G., Soifer B.T., Werner M.W., 2003, AJ, 125. 2411
- [8] Dey et al., 2005, ApJ, 629, 654D
- [9] Dijkstra M., Haiman Z., Spaans M., 2006, ApJ, 649, 14D
- [10] Fadda D., Jannuzi B., Ford A., & Storrie-Lombardi, L.J., 2004, AJ, 128, 1
- [11] Fardal M.A., Katz N., Gardner J.P., Hernquist, L., Weinberg D.H., & Romeel D., 2001, ApJ, 562, 605
- [12] Francis P.J., et al., 2001, ApJ, 554, 1001F
- [13] Haiman Z., Spaans M. & Quataert E., 2000, ApJ, 537, L5
- [14] Haiman Z., & Rees M.J., 2001, ApJ, 553, 545H
- [15] Hayes M., & Östlin G., 2006, A&A, 460, 681H
- [16] Hogg D.W., Cohen J.G., Blandford R., & Pahre M.A., 1998, ApJ, 504, 622
- [17] Irwin M., & Lewis J., 2001, NewAR, 45, 1051
- [18] Jarvis M.J., Rawlings S., Eales S.A., Blundell K.M., Bunker A.J., Croft S., McLure R.J., Willott C.J., 2001, MNRAS, 326, 1585.
- [19] Kennicutt R.C., 1998, ARA&A, 36, 189K
- [20] Lacy M., et al., 2005, ApJS, 161, 41.
- [21] Lonsdale, C. J. et al., 2003, PASP, 115, 897
- [22] Matsuda Y., et al., 2004, ApJ, 128, 569
- [23] MacDonald E.C., et al., 2004, MNRAS, 352, 1255
- [24] Manchado A. et al., 1998, SPIE, 3354, 448M
- [25] McLure R.J., Jarvis M.J., Targett T.A., Dunlop J.S., Best P.N., 2006, MNRAS, 368, 1395
- [26] Nilsson K.K., Fynbo J.P.U., Møller P., Sommer-Larsen J., Ledoux C., 2006, A&A, 452, 23N
- [27] Ohyama Y., et al., 2003, ApJ, 591, 9O
- [28] Oke, J.B. & Gunn J.E., 1983, ApJ, 266, 713O
- [29] Reuland M., et al., 2003, ApJ, 592, 755
- [30] Roche P., et al., 2003, SPIE, 4841, 901R
- [31] Saito T., Shimaksaku K., Okamura S., Ouchi M., Akiyama M., Yoshida M., 2006, ApJ, 648, 54
- [32] Salpeter E.E., 1955, ApJ, 121, 161S
- [33] Shim H., Im M., Pak S., Choi P., Fadda D., Helou G., & Storrie-Lombardi L., 2006, ApJ, 164, 435
- [34] Steidel C.C., Adelberger K.L., Shapley A.E., Pettini M., Dickinson M., Giavalisco M., 2000, ApJ, 532, 170
- [35] Taniguchi Y. & Shioya Y., 2000, ApJ, 532, L13
- [36] Venemans B.P., Kurk J.D., Miley G.K., Röttgering H.J.A., 2003, NewAR, 47, 353V
- [37] Weidinger M., Møller P., Fynbo J.P.U., 2004, Nature 430 999W
- [38] Weidinger M., Møller P., Fynbo J.P.U., Thomsen B., 2005, A&A, 436 825W
- [39] Wilman R.J., Gerssen J., Bower R.G., Morris S.L., Bacon R., de Zeeuw P.T., Davies R.L., 2005, Nature, 436, 227