The ZOO of and light curves of magnetic chemically peculiar stars
Abstract
We present preliminary results of the generalized Principal Component Analysis (PCA) of light curves of 82 magnetic chemically peculiar (further mCP) stars applied to 54 thousand individual photometric observations in the uvby and colours taken from the “On-line database of photometric observations of mCP stars”.
We show that every of the observed light curves (LCs) can be, with a sufficient accuracy, represented using five parameters of a harmonic polynomial of the second order, and that the third order and higher harmonics reflect only a noise. We found that a prevailing majority of the LCs can be satisfactorily well represented by a linear combination of a constant term and one or two (extraordinarily three) basic, mutually orthonormal functions, which reduces the number of parameters necessarily needed to describe the set of the LCs of a particular star.
While the shape of an individual LC depends on the individual distribution of photometric spots on the surface of a rotating star, its amplitude depends on the mechanism of variability. To describe the amplitude of LCs we introduce a robust quantity effective amplitude. Applying the PCA to the set of the effective amplitudes of the LCs in all five colours we revealed at least three different sources of the light variability showing different wavelength dependence. The amplitudes of all the LCs harbor a component monotonously decreasing with increasing wavelengths. The second component reaches a remarkable extremum in the colour, and is in antiphase relative to the remaining four colours. It occurs particularly at cooler mCP-s having a high degree of the chemical peculiarity. The third component reflects a remarkable diversity of the light curves in the colour found in a few mCP stars.
Key words: light variability – light curves – chemically peculiar stars – origin of the light variations
1 Introduction
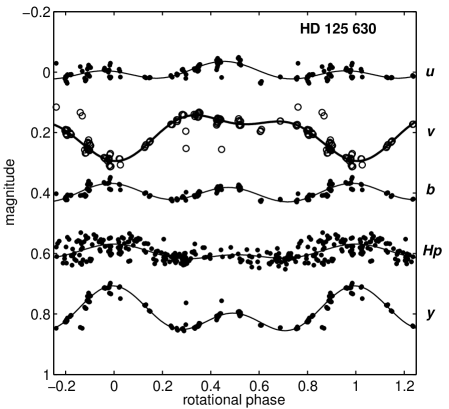
The light variability of the magnetic chemically peculiar (mCP) stars, ranging a few hundredths, seldom a few tenths of magnitude in amplitude, has been known and investigated for decades. These strictly periodic light variations, frequently accompanied by synchronous variations of spectral lines and magnetic field, are commonly explained due to existence of hypothetical, vast and persistent photometric spots on the surface of rigidly rotating stars. The properties of these photometric spots and their relation to the known spectroscopic spots and the geometry of the magnetic field have not been explored satisfactorily up to now.
We aim at a deep analysis of the rotationally modulated photometric variations of mCP stars, their astrophysical explanation based both on the complex study of selected well observed mCP stars and the study of the photometric behaviour of as large as possible sample of the stars.
2 The data
Prior to start the investigation we established a publicly accessible “On-line database of photometric observations of mCP stars” (http://dumbell.physics.muni.cz/pilot, hereafter the Database) as today containing more than 120 thousand observations of more then 120 mCP stars made in 40 photometric colours. One can find a more detailed information on this public database in the paper [Mikulášek et al.(2007)].
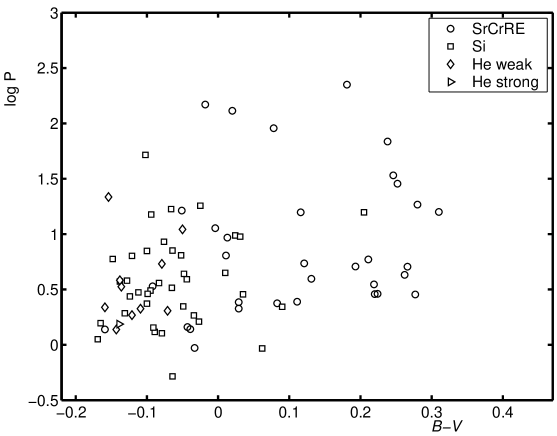
We selected 82 stars having observations in and Hipparcos colours. The sample contains one He-strong (HD 37776), 10 He-weak, 37 Si and 34 “cool” SrCrRE stars. Here we study altogether 408 LCs in five photometric colours consisting of 54 131 individual observations with errors of mag.
The linear light elements of all the 82 stars were determined by means of our own method based on the generalized PCA and a robust regression, based on the complete photometric material contained in the Database. The fastest rotator in our sample is HD 164429 with the rotational period d, the slowest one is HD 188041 with d. The median is d.
An evident trend that the cooler mCP stars rotate slower on average, can be seen on Fig. 1. The undereddened B-V indices were taken from the Hipparcos photometry.
3 Description of mCP light curves
The rotational LCs of magnetic CP stars are strictly periodic what means they can be described to advantage by harmonic polynomials depending on the rotational phase . Further, it follows from the experience ([North 1984]) that the rotational LCs are smooth to such extent that the polynomial of the 2nd degree is quite sufficient. The terms of the higher degrees mostly reflect noise so they can be neglected. Thus
| (1) |
where the dot “” denotes a scalar product. The fourvector is given by the relation:
| (2) |
The shape of the light curve in the the colour is then described simply by a fourvector , , consequently by a point in the 4D-space of parameters. The shapes of the set of light curves of each of the 82 mCP stars are fully described by the set of 5 fourvectors which can be considered as a matrix Y with 20 elements known with different degree of uncertainty. It is rather surprising that there are no two stars with same or even resembling set of these vectors. Thus the set of parameters of a given star seem to be unique and characteristic.
3.1 PCA decomposition of light curves of individual stars
The thorough inspection of light curves of individual stars suggests that these LCs are in some extent similar, what entitles us to apply the PCA to them with the aim of reducing the number of parameters needed to describe the LCs of a particular star.
The technique of weighted PCA enables one to search for mutual relations of five fourvectors of light variations in the 4D-space for individual stars. We are looking for the basic direction towards which the sum of squared projections is maximum.
The found orthonormal base vectors determine the course of normalized basic LCs , , , as follows:
| (3) |
We found that a colour light curve can be expressed as a linear combination of at most the first three basic functions :
| (4) |
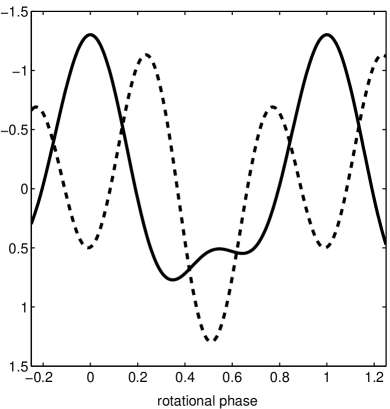
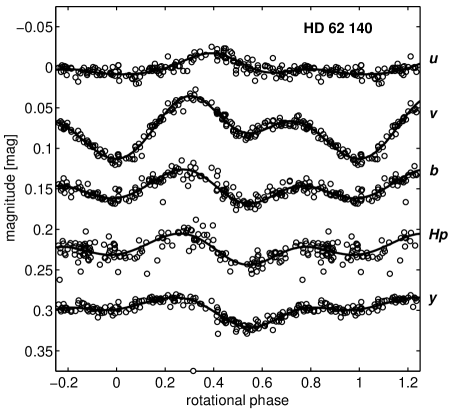
The first basic function, represents common features of the course of all 5 light curves, while the second, , expresses differences from each other. The need of the third function, , occurs seldom. The accuracy of 0.001 mag of the fitting of the LCs could be achieved with only one function in 34 cases, we had to use two functions and (see Fig. 2a) in 47 cases, and we needed three functions and only in the case of HD 62140 (see Fig. 3b).
The semiamplitudes describe LCs in particular colours quantitatively and give an information on mechanisms of stellar variability (see Fig. 2b). They can be determined simply as projections of the vector into the vector of the vector base by the relation: or better by using LSM or a robust regression. We have applied the latter as it suppresses the influence of outliers and furnishes us also with the robust values of for particular colours and observers and by the estimate of the uncertainties of the found parameters.
4 Effective amplitude of a light curve
The effective amplitude is a robust quantity characterizing the amplitude of a light curve. [Mikulášek et al.(2007)] defined the effective amplitude of a LC of an mCP star in the colour as
| (5) |
The factor 8 is selected so that the effective amplitude of the sine light curve corresponded to the amplitude of the observed one. Using relations (2)and (4) we arrive at relations:
| (6) |
Here we extended the definition Eq. (5) by introducing the negative effective amplitude for a LC going in antiphase with the majority of the remaining LCs. The meaning of the phrase ”to be in antiphase” is specified by the last relation in the equation (6).
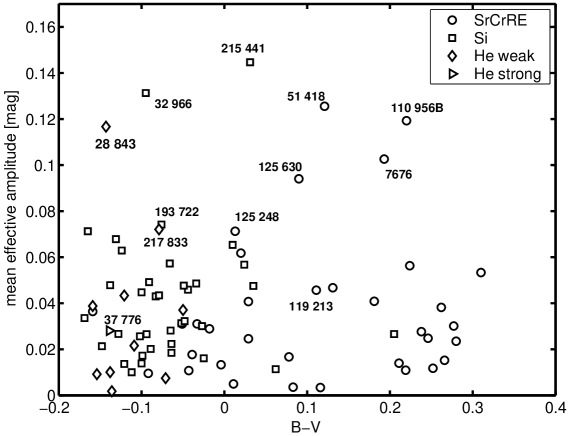
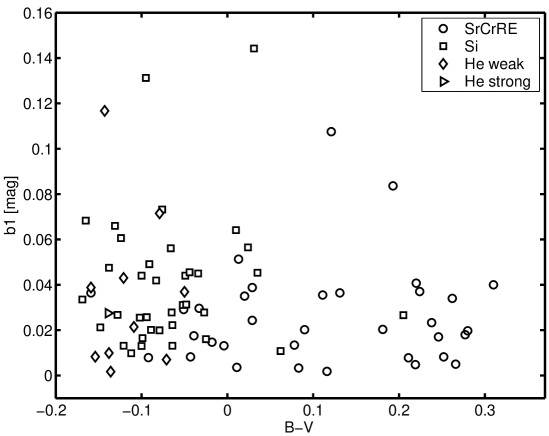
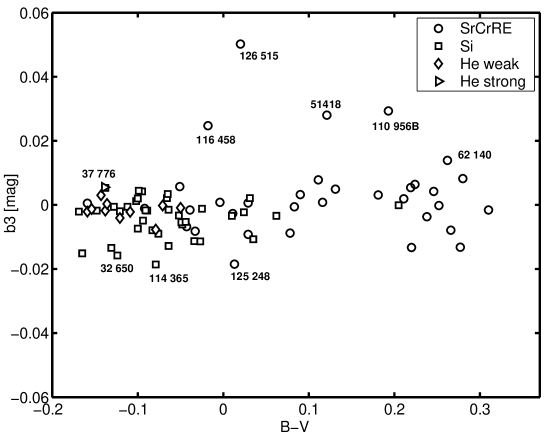
Fig. 4 displays that there is no apparent correlation between the mean value of effective amplitudes and B-V indices. We argue that mCP stars of various types form more or less homogeneous group from the view of their photometric variability.
4.1 Stars with the largest effective amplitudes
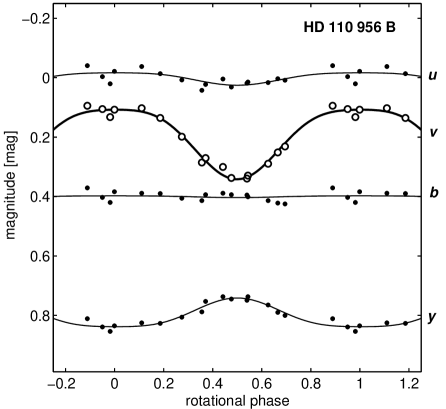
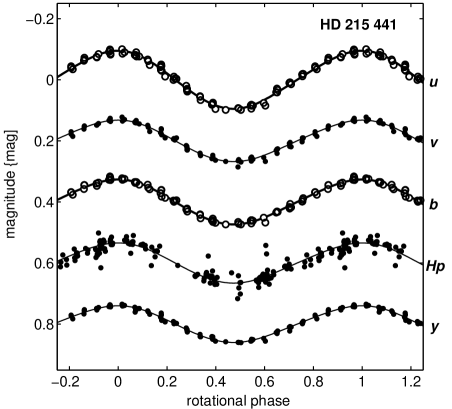
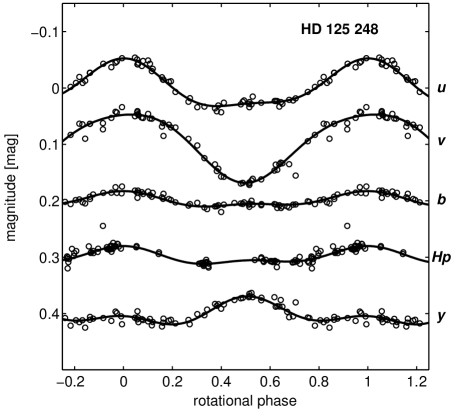
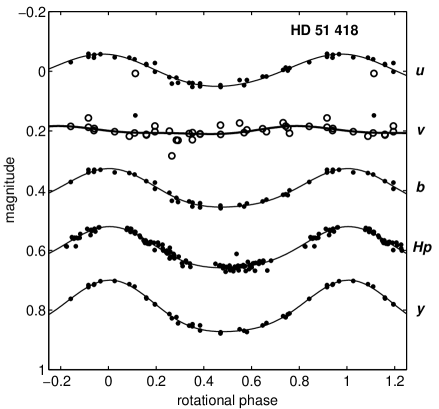
The median of the set of the effective amplitudes is 0.027 (!) mag. Still some of the mCPs have much larger amplitude as documented in the following: the Olsen’s star, HD 110956B has an effective amplitude 0.24 mag in . The Babckock’s star HD 215441 has 0.19 and 0.14 mag in and respectively. HD 51418 has 0.14 and 0.17 mag in and respectively. HD 28843, the most variable He-weak star has an effective amplitude 0.15 mag in . The common characteristics of these “record holders” is a single-waved LC (see Fig.5) suggesting a simple geometry of their photometric spots.
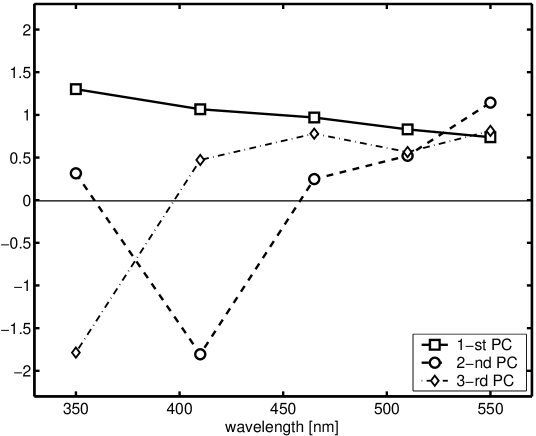
4.2 PCA of the dependence of effective amplitudes on wavelength
The advantage of the PCA is that it offers the possibility to investigate all the sample to be studied simultaneously. The light variability of each star can be characterized by a fivevector of the effective amplitudes in all five colours as . If a LC is in antiphase, what occurs approximately in 3.5% of the LCs, the corresponding effective amplitude is assigned with the negative sign.
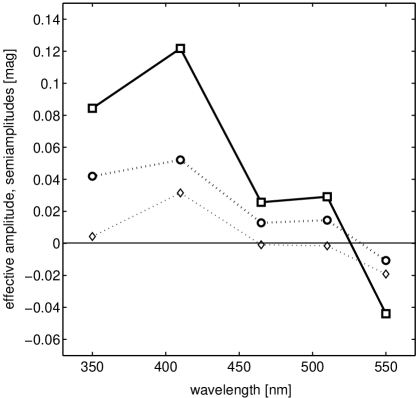
Then these fivevectors are, using the PCA, expressed by the linear combinations of at least as possible number of the main, mutually orthogonal vectors. It turned out that the fivevectors of all the stars in the sample can be sufficiently accurately expressed as the linear combination of three main components (3D-space). Their occurrence and wavelength behaviour may reflect some astrophysical significance. Their course with the wavelength is displayed on Fig. 6.
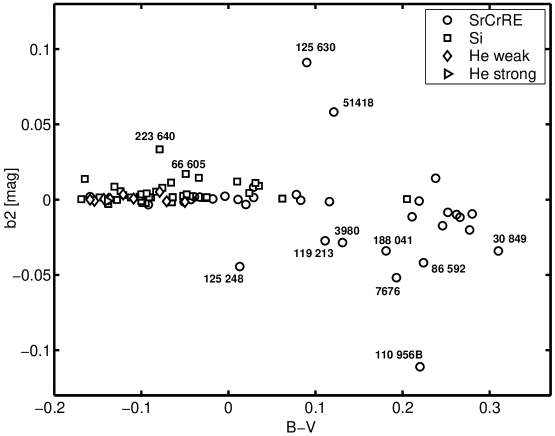
Having the main components defined, we project the vector of effective amplitude of an mCP into the 3D basis, thus getting three components , , . They show a specific distribution with the index.
5 Some empirical finding and discussion
We confirm that the observed light curves of mCP stars can be satisfactorily well represented by harmonic polynomials of the second order. Investigating the wavelength dependence of the effective amplitude by means of PCA we conclude:
-
1.
Obviously every of the sample stars has one or more bright spots on its surface whose contrast decreases with increasing wavelength. The spots are usually more pronounced on hotter stars. Nevertheless, occurrence of these spots is not bound to any of the peculiarity types.
-
2.
On cooler mCPs, not necessarily of SrCrRE type, one or more spots looking dark in the colour occur relatively frequently. These spots are indicated by the increasing amplitude of the -index in the cool mCPs. We suggest that these spots might be related to the decrease of Balmer jump in the spectral energy distribution in regions heavily contaminated by overabundant elements.
-
3.
The spots contrast in the may demonstrate themselves either as bright or dark, whereas as a rule they are bright on hot and dark on cool stars.
The brightness contrast of the spots probably is due to the uneven distribution of chemical elements, horizontal and possibly vertical, and perhaps also to strong global magnetic field. These dissimilar atmospheric patches interact differently with the isotropic radiative flux coming from the interior. Especially, the ”colour” photometric spots may origin due to the different redistribution of the flux from the UV to visual region caused by the bound-free transitions and line-blocking. Silicon may play a decisive role in the light variability, as it is usually overabundant in all subtypes of the mCP stars.
Consequently, photometric spots are most likely related to the surface distribution of chemical elements and, possibly, with the configuration and the intensity of magnetic fields. The chemical elements use to be distributed in several more or less irregularly distributed spots (cf. [Khokhlova et al.(1997)]), as well as the magnetic field configuration may differ from an elementary dipole structure ([Kochukhov 2005]). Thus, a simple pattern of the photometric spots cannot be expected, as it was documented e. g. in the case of HD 37776 ([Krtička et al.(2007)]).
The amazing diversity of the forms of the LCs is the result of the complexity of the photometric spots structure. The study of the relations between the photometric and spectroscopic spots on the mCP stars seems to be very promising.
From this point of view, the mCP stars represent a relatively homogeneous group. However, our conclusions are very preliminary mainly for they are based only on the analysis of the effective amplitude. We plan also to take into account the shape of a LC harbouring information on location of the spots along the surface.
-
Acknowledgements.
This work was supported by grants GA ČR 205/06/0217, VEGA 2/6036/6, and MVTS ČRSR 10/15/2006-7. This research has made use of NASA’s Astrophysics Data System, the SIMBAD database, operated at CDS, Strasbourg, France and On-line database of photometric observations of mCP stars ([Mikulášek et al.(2007)]).
References
- Khokhlova et al.(1997) Khokhlova V.L., Vasilchenko D.V., Stepanov V.V., Tsymbal V.V., 1997, AstL 23, 465
- Kochukhov 2005 Kochukhov, O., 2005, in The A-Star Puzzle, Eds. J. Zverko, J. Žižňovský, S. J. Adelman, W. W. Weiss, Cambridge University Press, Cambridge, 433
- Krtička et al.(2007) Krtička J., Mikulášek Z., Zverko J., Žižňovský J., 2007, Astron. Astrophys., in press
- Mikulášek et al.(2007) Mikulášek Z., Janík J., Zverko J., Žižňovský J., Zejda M., Netolický M., Vaňko M., 2007, Astron. Nachr., 328, 10
- North 1984 North P., 1984,Astron. Astrophys. Suppl. Ser.55, 259