Uncovering the Nature of the X-ray Transient 4U 1730–22: Discovery of X-ray Emission from a Neutron Star in Quiescence with Chandra
Abstract
The X-ray transient, 4U 1730–22, has not been detected in outburst since 1972, when a single 200 day outburst was detected by the Uhuru satellite. This neutron star or black hole X-ray binary is presumably in quiescence now, and here, we report on X-ray and optical observations of the 4U 1730–22 field designed to identify the system’s quiescent counterpart. Using the Chandra X-ray Observatory, we have found a very likely counterpart. The candidate counterpart, CXOU J173357.5–220156, is close to the center of the Uhuru error region and has a thermal spectrum. The 0.3–8 keV spectrum is well-described by a neutron star atmosphere model with an effective temperature of eV. For a neutron star with a 10 km radius, the implied source distance is kpc, and the X-ray luminosity is (/10 kpc)2 ergs s-1. Accretion from a companion star is likely required to maintain the temperature of this neutron star, which would imply that it is an X-ray binary and therefore, almost certainly the 4U 1730–22 counterpart. We do not detect an optical source at the position of the Chandra source down to , and this is consistent with the system being a Low-Mass X-ray Binary at a distance greater than a few kpc. If our identification is correct, 4U 1730–22 is one of the 5 most luminous of the 20 neutron star transients that have quiescent X-ray luminosity measurements. We discuss the results in the context of neutron star cooling and the comparison between neutron stars and black holes in quiescence.
Subject headings:
accretion, accretion disks — stars: neutron — stars: individual (4U 1730–22) — X-rays: stars — X-rays: general1. Introduction
Uhuru, the first X-ray astronomy satellite (Giacconi et al., 1971), was launched in 1970 and carried out an all-sky survey (Forman et al., 1978). Although the 339 X-ray sources it detected are bright by today’s standards, and most of them have been well-studied, some of the transient sources have not been studied by subsequent X-ray satellites. Here, we focus on one such transient, 4U 1730–22, that was discovered by Uhuru in 1972 when it entered into an X-ray outburst lasting 200 days (Cominsky et al., 1978; Chen, Shrader & Livio, 1997). The outburst behavior and X-ray spectrum measured by Uhuru showed all of the signs that the source is an X-ray binary. Tanaka & Shibazaki (1996) and Chen, Shrader & Livio (1997) both classify this system as a probable neutron star system, presumably based on the Uhuru X-ray spectrum, but there is no information from type I X-ray bursts, pulsations, or a compact object mass measurement to indicate whether the system contains a neutron star or a black hole.
In quiescence, neutron star and black hole soft X-ray transients (SXTs), which are normally Low-Mass X-ray Binaries (LMXBs), typically have X-ray luminosities in the to ergs s-1 range. Although these are faint sources, observations with the Chandra X-ray Observatory are able to probe much of this range for Galactic sources at distances out to 10–15 kpc. Here, we report on the results of Chandra and optical observations covering the Uhuru error region for 4U 1730–22. One reason for choosing this source is that its location (, ) and its outburst X-ray spectrum suggest that it is not highly absorbed, making it more likely to be detected in the X-ray band and easier to study in the X-ray and optical.
The purpose of this work is both to learn more about 4U 1730–22 as well as about neutron stars and black holes in quiescence. Observations of these sources in quiescence provide some of the best opportunities to probe the properties of the compact objects themselves. For most neutron star transients, a thermal component with a temperature of 0.1 keV is present in the X-ray spectrum, and it is thought that this emission is coming directly from the surface of the neutron star (Campana et al., 1998; Brown, Bildsten & Rutledge, 1998; Rutledge et al., 1999). This provides an opportunity to study the short time scale (years) cooling of the neutron star crust (Rutledge et al., 2002; Wijnands et al., 2005) as well as probing the core temperature, which changes on a time scale of millennia (Colpi et al., 2001). If 4U 1730–22 harbors a neutron star, we expect that the core temperature will set its X-ray emission properties as it has not had an outburst (as far as we know) for 34 years. For black holes, the lack of a thermal component as well as the fact that, on average, quiescent black holes tend to be fainter than neutron stars have been taken as possible evidence for the existence of black hole event horizons (Narayan, Garcia & McClintock, 1997; Garcia et al., 2001; McClintock, Narayan & Rybicki, 2004). Recent observations of some very faint neutron star systems (Tomsick et al., 2004; Tomsick, Gelino & Kaaret, 2005; Jonker et al., 2006) make it important to obtain X-ray measurements for more quiescent SXTs.
2. Analysis and Results
2.1. Chandra Reduction and Source Detection
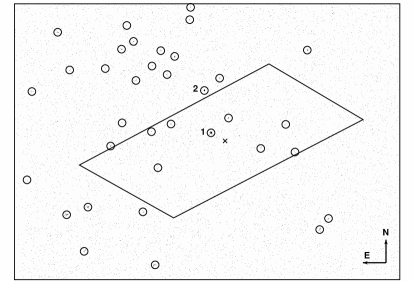
We observed the 4U 1730–22 field in the X-ray band with Chandra on 2004 May 11 (ObsID 4583), obtaining an exposure time of 39.8 ks. We used the Advanced CCD Imaging Spectrometer (ACIS, Garmire et al., 2003) with the target position placed on the ACIS-S3 chip. To obtain the lowest possible background, the observation was performed with the ACIS in “VFAINT” readout mode, which provides the maximum amount of information per event. To prepare the data for our analysis, we started with the “level 1” event list, which was produced using standard processing with ASCDS version 7.6.7.2. We further processed the data using the Chandra Interactive Analysis of Observations (CIAO) version 3.3.0.1 software and the Calibration Data Base (CALDB) version 3.2.3. A portion of the image from the resulting “level 2” event list is shown in Figure 1.
After inspecting the full ACIS field-of-view (six -by- chips), we used the CIAO routine wavdetect (Freeman et al., 2002) to search for potential 4U 1730–22 counterparts in or near the Uhuru position for this source. For the search, we restricted the event list energy range to 0.3–8 keV and the region to in the North-South direction and in the East-West direction. The search region is centered on the best Uhuru position for 4U 1730–22 (Forman et al., 1978) and includes a region considerably larger than the 90% confidence error region for 4U 1730–22, which is shown in Figure 1. When running wavdetect, we used a detection threshold of so that we expect that 1 source that we detect in the -by- region will be spurious.
Upon running wavdetect, we find 35 sources in the full -by- region, and these are marked with circles in Figure 1. In Table 1, the sources are listed along with their positions in order of their brightness (the number of counts per source estimated by wavdetect. The brightest source detected (source 1, CXOU J173357.5–220156) has 545 counts and is also the closest source to the best Uhuru position, being only away. The next brightest source (source 2, CXOU J173358.1–220101) is considerably fainter with 88 counts, and it is from the best Uhuru position. Of the 35 sources, 8 of them lie within the 90% confidence Uhuru error region and 5 more lie within of the error region. Thus, there are 13 sources that should be considered as possible 4U 1730–22 counterparts based on their positions. However, we will only be able to obtain further X-ray information for sources 1 and 2 as we only detected between 4 and 12 counts per source for the other 11 sources. The following sub-section describes the X-ray spectral and timing analysis for the two brightest sources.
2.2. Chandra Spectral and Timing Results for the Two Brightest Sources
We extracted spectra for the two brightest sources in the 4U 1730–22 field described above. In both cases, we extracted counts from a radius circle centered on the source position determined by wavdetect (see Table 1). We also extracted background spectra from an annulus centered on the source position with inner radius of and an outer radius of . We used the CIAO routine psextract to produce the spectra as well as the response matrices. For the two sources, we collected 566 and 95 counts (in the 0.3–8 keV band), respectively, and, in each case, we estimate background levels of between 6 and 7 counts. We binned the spectra so that the source 1 spectrum has an average of 31 counts per bin and the source 2 spectrum has an average of 12 counts per bin.
The energy spectra for the two sources are shown in Figures 2 and 3, and we used the XSPEC version 11.3.2o software package to perform model fitting. We began by using single component models, including power-law, blackbody, and bremsstrahlung models. In each case, we accounted for interstellar absorption, using the photo-electric absorption cross sections from Balucinska-Church & McCammon (1992) and elemental abundances from Anders & Grevesse (1989), and we left the column density () as a free parameter. For source 1, we obtained good fits for all 3 models with values of between 10 and 13 for 15 degrees of freedom. The power-law necessary to fit the spectrum is extremely steep with a photon index of (all errors are 90% confidence unless specified otherwise), and this likely indicates that the emission has a thermal origin. The blackbody and bremsstrahlung temperatures are and keV, respectively. Of the 3 models, only the blackbody model results in a column density cm-2 that is consistent with the value of cm-2 measured along this line-of-sight through the Galaxy (Dickey & Lockman, 1990). We obtain column densities of and cm-2 for the power-law and bremsstrahlung models, respectively.
Using the blackbody model fit to the source 1 spectrum, we estimate that the 0.3–8 keV absorbed flux is ergs cm-2 s-1, while the unabsorbed flux is ergs cm-2 s-1. The - curve from Virani et al. (2006) allows us to estimate how likely it is to find a source as bright as source 1 by chance. As Virani et al. (2006) compile the - using Chandra data from an observation well out of the Galactic plane (), their source population is dominated by Active Galactic Nuclei (AGN). In addition, the high Galactic latitude used for their study means that it is appropriate for us to consider the unabsorbed flux for source 1, which is ergs cm-2 s-1 in the 0.5–2 keV energy band. At this flux level, the AGN source density is near 5 sources per square degree. Considering the 9.4 square arcminute size of the 4U 1730–22 Uhuru error circle, approximately 0.01 AGN as bright as source 1 are expected to be detected by chance. In addition to the low probability of finding an AGN at this flux level, the spectral shape of source 1 would be extremely ususual for an AGN (Tozzi et al., 2006), and we conclude that it is very unlikely that source 1 is an AGN. In addition, it is unlikely that source 1 is due to coronal emission from a nearby, active star. Although the bremsstrahlung temperature derived from the spectral fits is consistent with such a hypothesis, one would also expect to see strong emission lines (Canizares et al., 2000), which are not present.


The steep spectrum () described above for source 1 could be produced by a quiescent neutron star system, but it would be unprecedented for a black hole transient in quiescence (Kong et al., 2002; Corbel, Tomsick & Kaaret, 2006). Thus, we refitted the spectrum with a neutron star atmosphere (NSA) model, which is the spectrum for thermal emission from the hydrogen atmosphere of a neutron star (Pavlov, Shibanov & Zavlin, 1991; Zavlin, Pavlov & Shibanov, 1996). For the NSA fit, we assume a weakly magnetized ( G) neutron star with a canonical radius and mass of 10 km and 1.4, respectively. Fitting the spectrum yields an effective temperature of K, corresponding to eV. Such a temperature is in-line with the range of values that have been seen for neutron star soft X-ray SXTs in quiescence (Rutledge et al., 1999; Wijnands et al., 2004; Tomsick et al., 2004). The normalization for the NSA model is directly related to the source distance (), and in this case, the value given in Table 2 implies kpc (90% confidence). Although this is a large range of possible values, the values are consistent with what is expected for a Galactic X-ray binary. Finally, some quiescent neutron star systems require two-component models (Rutledge et al., 1999; Jonker et al., 2004); however, fitting the source 1 spectrum with the combination of NSA and power-law models does not lead to a significant improvement in the quality of the fit (see Table 2).
Although the quality of the source 2 spectrum is significantly lower than for source 1, we used the same approach in fitting the source 2 spectrum. All three of the simple one-component models provide relatively poor fits with power-law, blackbody, and bremsstrahlung models yielding values of 12, 20, and 14, respectively, for 5 degrees of freedom. When using the power-law model, the measured photon index is , indicating that source 2 is significantly harder than source 1. The fact that the spectrum is quite hard explains why a blackbody provides an even worse fit than the power-law model. Using the power-law model with fixed to the Galactic value, we infer an unabsorbed 0.5–2 keV flux of ergs cm-2 s-1. At this flux, the AGN density is close to 100 sources per square degree (Virani et al., 2006), implying that one would expect 0.3 AGN at this flux level within the Uhuru error region. Given the lower flux of source 2 and the fact that its spectrum is similar to that of AGN, the X-ray information allows for the possibility that source 2 is an AGN.
To allow for a direct comparison between sources 1 and 2, we have also fitted the source 2 spectrum with the NSA and NSA plus power-law models, and the results are given in Table 2. As for the blackbody model, an NSA fit to the source 2 spectrum is poor. In addition, the lower limit on the source distance of kpc that is implied by the NSA fit is not consistent with a Galactic source, and the lower limit on the temperature of eV implies a temperature above that expected for a quiescent neutron star. With the power-law plus NSA model, the quality of the fit improves to . The parameters with this model are not well-constrained, and the error regions would allow for reasonable NSA parameters. However, the best fit column density of cm-2 is higher than we expect for the 4U 1730–22 counterpart. Even if the source distance is fixed to a reasonable distance of 10 kpc, we find cm-2. This may indicate that the power-law plus NSA model is not the correct model of this spectrum, but the quality of the spectrum precludes a definite conclusion to this question.
We extracted light curves for the two sources to determine if either of them show evidence for variability. While the statistics do not allow for a detailed timing study, there is some probability that we would see an eclipse for a binary system. However, inspection of the 0.3–8 keV light curves with 2,000 s time bins does not show any clearly significant variability. For source 1, the mean number of counts per 2000 s bin is 28 and the minimum is 19, so there is no evidence for an eclipse. We also tested for variability by comparing the times that X-ray events were detected over the 40 ks observation to a distribution with the same number of events spread evenly throughout the observation and using a Kolmogorov-Smirnov (KS) test. With this method, we find possible evidence that source 1 is variable, but the detection of variability is not highly significant, with an 11% chance that it is spurious. There is no evidence for variability from source 2.
2.3. Optical Observations
We obtained optical images of the 4U 1730–22 field with the 4 meter telescope at Cerro Tololo Inter-American Observatory (CTIO) on 2003 March 12. Starting at 8.14 hours UT, we obtained exposures with durations of 30, 60, 300, and 600 seconds with the Mosaic II CCD imager and the Harris -band filter. The Harris -band filter is much more similar to a Johnson -band filter than Cousins-Kron -band filter. The conditions during the observations were relatively good, with sub-arcsecond seeing. We used the Image Reduction and Analysis Facility (IRAF) software to reduce the images, applying bias subtraction and flat-fielding the images. Due to the combination of relatively low extinction but proximity to the Galactic Center, the field is very crowded, and we had to be careful when registering the images. To perform the position registration, we identified 16 stars that are in the USNO-B1.0 catalog with brightnesses between and 18. It is critical to use relatively bright stars to be sure that source confusion is avoided. Using these 16 stars, we registered the images using IRAF and, based on comparisons between USNO positions and the positions we obtain after registering the images (see Figure 4), the registration is good to .
For magnitude calibration, we obtained exposures of the Landolt field PG 1323–086 (Landolt, 1992). At 9.52 hours and 9.70 hours UT, two 3 second -band exposures were taken. Aperture photometry with IRAF indicates that the count rates for these two exposures were the same to within 0.6%, consistent with photometric conditions at this time. However, aperture photometry on several sources in the four 4U 1730–22 exposures indicates count rate changes by 6% between the brightest and faintest exposures even though the air mass only changes between 1.20 and 1.29 during the observations. This suggests that the conditions were not completely photometric during the 4U 1730–22 exposures, but the 6% change only corresponds to a change in -magnitude of 0.1, which is not a major concern for our purposes. To calibrate the 4U 1730–22 field, we used the Landolt count rates and the 30 second 4U 1730–22 exposure for which the highest count rates were seen.
Figure 4 shows the -band image for all four of our exposures combined (990 seconds) along with the positions of the Chandra sources in the 4U 1730–22 field. We inspected the -band image in the regions near the 13 X-ray sources that are in or close to the Uhuru error region. Given that the uncertainty in the optical position registration is , and the Chandra pointing uncertainty is , the optical and X-ray positions must be within for a convincing identification. Of the 13 X-ray sources, 5 of them meet this criterion with differences between X-ray and optical positions between and . These sources are marked in Figure 4, and their -band magnitudes and the separations between their X-ray and optical positions are given in Table 1. All of the sources with optical counterparts are weak X-ray sources with between 5 and 11 ACIS counts. In the optical, two of the sources are relatively bright with -band magnitudes of and , and for the other three.
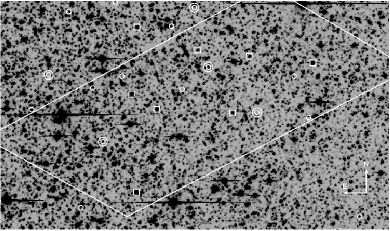
We did not detect optical counterparts for either of the bright X-ray sources (sources 1 and 2 above). In fact, in both cases, the nearest optical source is from the X-ray position, so that the nearest optical sources are clearly not associated with the X-ray sources. Thus, it is important to derive the limiting magnitude for the -band image. All previous aperture photometry was performed using apertures with 4 pixel () radii; thus, we consider an aperture with the same size. The sky count rate is 340 counts per pixel, giving a background level of 17,000 counts per aperture. To obtain a detection with signal-to-noise ratio of 5 requires a source with 650 counts, and, using the magnitude calibration described above, the limiting magnitude is .
3. Discussion
3.1. The 4U 1730–22 Counterpart
Based on the X-ray properties of source 1 presented above, a relatively strong case can be made that it is the 4U 1730–22 counterpart. The strongest evidence comes from the X-ray spectrum, which is consistent with a thermal spectrum (with interstellar absorption) from a standard-sized (10 km radius) neutron star at a distance of 10 kpc. While it is worth considering the possibility that the source is an isolated neutron star, especially given its faintness in the optical, the relatively high thermal temperature, eV, would indicate a very young neutron star (10,000 years) (Yakovlev & Pethick, 2004). This is unlikely given that there is no evidence for a supernova remnant or extended emission of any kind in the X-ray or optical. On the other hand, a temperature of 131 eV is in the range of values typically seen for quiescent neutron star transients (Rutledge et al., 1999; Wijnands et al., 2004; Tomsick et al., 2004) as the neutron star temperatures in such systems are kept relatively high due to the intermittent accretion (Brown, Bildsten & Rutledge, 1998). Of course, the other reason to suspect that source 1 is the 4U 1730–22 counterpart is that it lies very close to the center of the Uhuru error region.
We have also considered the possibility that source 2 might be the 4U 1730–22 counterpart. The fact that the source is much harder than source 1 indicates that it does not have a purely thermal spectrum, but this does not rule out the possibility that the source is a quiescent neutron star or black hole transient. The spectra of quiescent neutron star transients can be purely thermal, purely non-thermal, or require both components (Jonker et al., 2004). For source 2, the problem with the first 2 models is that they give poor fits with for the NSA model and for the power-law model. Although the power-law plus NSA model provides a better fit (), as discussed above, the value of is somewhat higher than one would expect for this line of sight. Considering the black hole possibility, it is worth noting that the power-law photon index we measure for source 2, , is typical of black hole transients in quiescence. However, in other Chandra observations of such systems, a power-law typically gives a formally acceptable fit (e.g., Kong et al., 2002). Overall, although there are some reasons to think that source 2 is not a neutron star or black hole transient, a better spectrum is necessary to reach a definite conclusion. Probably the strongest argument against source 2 being the quiescent counterpart to 4U 1730–22 is that source 1, with its distinctive thermal spectrum and its position close to the center of the Uhuru error region, is such a good candidate.
3.2. Possible Spectral Types and Distance Estimate
As described above, the X-ray spectrum of source 1 is consistent with a quiescent neutron star with a 10 km radius at a distance of kpc, and we can check on whether the optical non-detection is consistent with the source being an LMXB. Most neutron star SXTs have companions with K-type main sequence companions (K3V–K7V) (Charles & Coe, 2006; Chevalier et al., 1999). Even when these sources are in quiescence, as much as half of the optical light can come from the accretion disk (Tomsick et al., 2002; Torres et al., 2002). Thus, in placing limits on the source distance, we consider a range of spectral types from M0V to K0V and disk light fractions up to . We estimate the optical extinction using the measured X-ray column density of cm-2, which corresponds to (Predehl & Schmitt, 1995) and (Cardelli, Clayton & Mathis, 1989). For a K0V star, the absolute optical magnitudes are and (Cox, 2000). Thus, considering that for source 1, a K0V-type companion implies lower limits on the source distance of kpc for and kpc for . On the other end of the range, a M0V-type companion with allows for a distance as low as kpc for and kpc for . Thus, the optical non-detection allows for the full range of companion spectral types we expect for a neutron star SXT but suggests that the source is at a distance larger than a few kpc, which is consistent with the lower limit of 6 kpc implied by the NSA fit to the X-ray spectrum.
Given that the optical information will only provide us with lower limits to the source 1 distance, we consider the best estimate of the distance to be the 10 kpc from the NSA fit to the X-ray spectrum. Such a distance may very well be consistent with the possibility that source 1 is the 4U 1730–22 counterpart as the outburst from this source was considerably fainter than what has been seen from other neutron star SXTs (Cen X-4, 4U 1608–522, and Aql X-1). According to Chen, Shrader & Livio (1997), the peak 4U 1730–22 X-ray flux during its 1972 outburst was 0.12 Crab, compared to 29.6 and 4 Crab for 2 outbursts from Cen X-4 and a median peak flux of 0.74 Crab for 24 outbursts from 4U 1608–522 and Aql X-1. Distance estimates for Cen X-4, 4U 1608–522, and Aql X-1 are 1.2, 3.6, and 5 kpc, respectively (Tomsick et al., 2004, and references therein). Although this is only based on one outburst from 4U 1730–22, it could indicate that the source is a factor 2–3 times farther away than 4U 1608–522 and Aql X-1, which is in-line with a distance of 10 kpc. Furthermore, this would imply a peak X-ray luminosity for 4U 1730–22 of (/10 kpc)2 ergs s-1, which is typical of neutron star SXTs.
3.3. Neutron Star SXTs in Quiescence
It is also interesting to look at how our result for source 1, which we will henceforth call 4U 1730–22 as it appears that the association is quite likely, fits into the larger body of work on quiescent neutron star and black hole SXTs. One important question concerns the significance of the difference between neutron star and black hole luminosities. Early observations based on a handful of sources suggested that black holes were much less luminous (Narayan, Garcia & McClintock, 1997; Garcia et al., 2001), but recent observations have shown that there is significant overlap between the two distributions (Tomsick, Gelino & Kaaret, 2005; Jonker et al., 2006). Based on the NSA fit to the 4U 1730–22 spectrum, we find an unabsorbed 0.3–8 keV flux of ergs cm-2 s-1, which corresponds to a luminosity of (/10 kpc)2 ergs s-1. Assuming a distance of 10 kpc and a neutron star mass of 1.4, this corresponds to an Eddington-scaled luminosity of , which is a factor of 6 higher than the median value for the 19 neutron star systems shown in Figure 5 of Tomsick, Gelino & Kaaret (2005). Out of the group of 20 neutron star systems, there is only one (EXO 0748–676) with a higher luminosity, and 3 others (4U 1608–522, EXO 1745–248, and XTE J1709–267) with comparable luminosities, so that 4U 1730–22 has one of the 5 highest quiescent X-ray luminosities (assuming a distance of 10 kpc).
As mentioned above, many of the neutron star SXTs show both thermal and non-thermal components in their X-ray spectra, but the origin of the non-thermal power-law component is uncertain. In Figure 5 of Jonker et al. (2004), it is shown that the spectra tend to be more highly dominated by the power-law flux both below and above ergs s-1, but that the spectra measured when the luminosities are close to this range are dominated by the thermal component. The power-law on the higher luminosity side is thought to be due to residual accretion, so the fact that 4U 1730–22 does not show a power-law may indicate that there is, at most, a low level of residual accretion. Although it is unclear what causes the power-law on the lower luminosity side, it may be that all systems have weak power-law emission that is only detectable for the systems with the coolest neutron stars.
Given that 4U 1730–22 has not been seen in outburst since the 1970s, one could ask why the source would have one of the hotter (and thus more luminous) quiescent neutron stars. Although the cooling time scale for the neutron star crust is on the order of years, the thermal time scale of the core is 10,000 years (Colpi et al., 2001), so a high quiescent temperature could simply indicate a higher level of activity over the last 10 millennia. One hint that this might be the case is that the 1972 outburst from 4U 1730–22 lasted for days, which is a factor of a few longer than is typically seen for neutron star SXTs (Chen, Shrader & Livio, 1997). Based on the theoretical work of Brown, Bildsten & Rutledge (1998), the expression , can be used to estimate the outburst recurrence time () necessary to obtain the ratio of mean outburst flux () to quiescent flux (). Using days, ergs cm-2 s-1 and the value of given above, we estimate an recurrence time of 30 years. As outbursts from SXTs are not strictly periodic, this is consistent with the observed behavior to date, but it is also possible that the source had a higher level of activity in the past.
4. Summary and Conclusions
We have used Chandra and optical observations of the field of the Uhuru X-ray binary 4U 1730–22 to search for counterparts to this past X-ray transient. Our analysis of the Chandra data indicates that we very likely have discovered the quiescent 4U 1730–22 X-ray counterpart. The brightest X-ray source in or near the Uhuru error region (CXOU J173357.5–220156) has a purely thermal spectrum with an effective temperature of eV, consistent with being a 10 km radius neutron star at a distance of kpc. Such a temperature requires that the neutron star is very young (10,000 years) or that it is maintaining its high temperature via accretion. The lack of a supernova remnant suggests that the latter is the case, indicating that the system is a neutron star X-ray binary. The likely association between CXOU J173357.5–220156 and the Uhuru source would indicate that 4U 1730–22 harbors a neutron star. The fact that no optical counterpart to the Chandra source is present to a limit of is consistent with the source being an LMXB with K-type main sequence companion at a distance greater than a few kpc. Deeper optical observations would be useful for learning more about this system.
The luminosity of the Chandra source that is the likely quiescent counterpart to 4U 1730–22 of ergs s-1 (assuming our estimated distance of 10 kpc) makes it one of the five most luminous of the 20 such systems for which measurements have been made. This is interesting in the context of the comparison between neutron star and black hole luminosities as it is an example of a quiescent neutron star system that is significantly more luminous than the known black hole systems. In addition, this luminosity is in the range where Jonker et al. (2004) find that most neutron star SXTs have purely thermal spectra as we observe in this case. Finally, a relatively high level of X-ray outburst activity from 4U 1730–22 is required to maintain the measured quiescent luminosity. The system either needs to produce outbursts like its 1972 outburst every 30 years or it had a higher level of activity at some point in the last 10,000 years.
References
- Anders & Grevesse (1989) Anders, E., & Grevesse, N., 1989, Geochimica et Cosmochimica Acta, 53, 197
- Balucinska-Church & McCammon (1992) Balucinska-Church, M., & McCammon, D., 1992, ApJ, 400, 699
- Brown, Bildsten & Rutledge (1998) Brown, E. F., Bildsten, L., & Rutledge, R. E., 1998, ApJ, 504, L95
- Campana et al. (1998) Campana, S., Colpi, M., Mereghetti, S., Stella, L., & Tavani, M., 1998, A&A Rev., 8, 279
- Canizares et al. (2000) Canizares, C. R., et al., 2000, ApJ, 539, L41
- Cardelli, Clayton & Mathis (1989) Cardelli, J. A., Clayton, G. C., & Mathis, J. S., 1989, ApJ, 345, 245
- Charles & Coe (2006) Charles, P. A., & Coe, M. J., 2006, Optical, ultraviolet and infrared observations of X-ray binaries, Compact stellar X-ray sources. Edited by Walter Lewin & Michiel van der Klis: Cambridge University Press), 215–265
- Chen, Shrader & Livio (1997) Chen, W., Shrader, C. R., & Livio, M., 1997, ApJ, 491, 312
- Chevalier et al. (1999) Chevalier, C., Ilovaisky, S. A., Leisy, P., & Patat, F., 1999, A&A, 347, L51
- Colpi et al. (2001) Colpi, M., Geppert, U., Page, D., & Possenti, A., 2001, ApJ, 548, L175
- Cominsky et al. (1978) Cominsky, L., Jones, C., Forman, W., & Tananbaum, H., 1978, ApJ, 224, 46
- Corbel, Tomsick & Kaaret (2006) Corbel, S., Tomsick, J. A., & Kaaret, P., 2006, ApJ, 636, 971
- Cox (2000) Cox, A. N., 2000, Allen’s astrophysical quantities, 4th ed. Publisher: New York: AIP Press; Springer, 2000. Editedy by Arthur N. Cox.)
- Dickey & Lockman (1990) Dickey, J. M., & Lockman, F. J., 1990, ARA&A, 28, 215
- Forman et al. (1978) Forman, W., Jones, C., Cominsky, L., Julien, P., Murray, S., Peters, G., Tananbaum, H., & Giacconi, R., 1978, ApJS, 38, 357
- Freeman et al. (2002) Freeman, P. E., Kashyap, V., Rosner, R., & Lamb, D. Q., 2002, ApJS, 138, 185
- Garcia et al. (2001) Garcia, M. R., McClintock, J. E., Narayan, R., Callanan, P., Barret, D., & Murray, S. S., 2001, ApJ, 553, L47
- Garmire et al. (2003) Garmire, G. P., Bautz, M. W., Ford, P. G., Nousek, J. A., & Ricker, G. R., 2003, in X-Ray and Gamma-Ray Telescopes and Instruments for Astronomy. Edited by Joachim E. Truemper, Harvey D. Tananbaum. Proceedings of the SPIE, Volume 4851, pp. 28-44 (2003)., 28
- Giacconi et al. (1971) Giacconi, R., Kellogg, E., Gorenstein, P., Gursky, H., & Tananbaum, H., 1971, ApJ, 165, L27
- Jonker et al. (2006) Jonker, P. G., Bassa, C. G., Nelemans, G., Juett, A. M., Brown, E. F., & Chakrabarty, D., 2006, MNRAS, 368, 1803
- Jonker et al. (2004) Jonker, P. G., Galloway, D. K., McClintock, J. E., Buxton, M., Garcia, M., & Murray, S., 2004, MNRAS, 354, 666
- Kong et al. (2002) Kong, A. K. H., McClintock, J. E., Garcia, M. R., Murray, S. S., & Barret, D., 2002, ApJ, 570, 277
- Landolt (1992) Landolt, A. U., 1992, AJ, 104, 340
- McClintock, Narayan & Rybicki (2004) McClintock, J. E., Narayan, R., & Rybicki, G. B., 2004, ApJ, 615, 402
- Narayan, Garcia & McClintock (1997) Narayan, R., Garcia, M. R., & McClintock, J. E., 1997, ApJ, 478, L79
- Pavlov, Shibanov & Zavlin (1991) Pavlov, G. G., Shibanov, I. A., & Zavlin, V. E., 1991, MNRAS, 253, 193
- Predehl & Schmitt (1995) Predehl, P., & Schmitt, J. H. M. M., 1995, A&A, 293, 889
- Rutledge et al. (1999) Rutledge, R. E., Bildsten, L., Brown, E. F., Pavlov, G. G., & Zavlin, V. E., 1999, ApJ, 514, 945
- Rutledge et al. (2002) Rutledge, R. E., Bildsten, L., Brown, E. F., Pavlov, G. G., Zavlin, V. E., & Ushomirsky, G., 2002, ApJ, 580, 413
- Tanaka & Shibazaki (1996) Tanaka, Y., & Shibazaki, N., 1996, ARA&A, 34, 607
- Tomsick et al. (2004) Tomsick, J. A., Gelino, D. M., Halpern, J. P., & Kaaret, P., 2004, ApJ, 610, 933
- Tomsick, Gelino & Kaaret (2005) Tomsick, J. A., Gelino, D. M., & Kaaret, P., 2005, ApJ, 635, 1233
- Tomsick et al. (2002) Tomsick, J. A., Heindl, W. A., Chakrabarty, D., & Kaaret, P., 2002, ApJ, 581, 570
- Torres et al. (2002) Torres, M. A. P., Casares, J., Martínez-Pais, I. G., & Charles, P. A., 2002, MNRAS, 334, 233
- Tozzi et al. (2006) Tozzi, P., et al., 2006, A&A, 451, 457
- Virani et al. (2006) Virani, S. N., Treister, E., Urry, C. M., & Gawiser, E., 2006, AJ, 131, 2373
- Weisskopf (2005) Weisskopf, M. C., 2005, astro-ph/0503091
- Wijnands et al. (2005) Wijnands, R., Homan, J., Heinke, C. O., Miller, J. M., & Lewin, W. H. G., 2005, ApJ, 619, 492
- Wijnands et al. (2004) Wijnands, R., Homan, J., Miller, J. M., & Lewin, W. H. G., 2004, ApJ, 606, L61
- Yakovlev & Pethick (2004) Yakovlev, D. G., & Pethick, C. J., 2004, ARA&A, 42, 169
- Zavlin, Pavlov & Shibanov (1996) Zavlin, V. E., Pavlov, G. G., & Shibanov, Y. A., 1996, A&A, 315, 141
| Number | Chandra | Chandra | Chandra | X-ray/Optical | -band |
|---|---|---|---|---|---|
| R.A. (J2000) | Decl. (J2000) | Counts | Separation | Magnitude | |
| 1111One of the 13 sources in the 90% confidence Uhuru error region or within of the error region. Source 1 is CXOU J173357.5–220156, and source 2 is CXOU J173358.1–220101. | – | 544.5 | — | 22.1 | |
| 2a | – | 87.8 | — | 22.1 | |
| 3 | – | 46.9 | — | — | |
| 4 | – | 32.6 | — | — | |
| 5 | – | 31.7 | — | — | |
| 6 | – | 30.8 | — | — | |
| 7 | – | 24.9 | — | — | |
| 8 | – | 19.4 | — | — | |
| 9 | – | 17.0 | — | — | |
| 10 | – | 16.9 | — | — | |
| 11 | – | 16.3 | — | — | |
| 12 | – | 14.2 | — | — | |
| 13 | – | 13.1 | — | — | |
| 14a | – | 12.1 | — | 22.1 | |
| 15a | – | 11.1 | — | 22.1 | |
| 16 | – | 11.1 | — | — | |
| 17 | – | 11.0 | — | — | |
| 18a | – | 10.1 | |||
| 19a | – | 10.0 | |||
| 20 | – | 9.6 | — | — | |
| 21 | – | 9.0 | — | — | |
| 22 | – | 8.7 | — | — | |
| 23 | – | 8.4 | — | — | |
| 24a | – | 8.2 | — | 22.1 | |
| 25a | – | 7.6 | — | 22.1 | |
| 26a | – | 7.4 | |||
| 27 | – | 7.0 | — | — | |
| 28a | – | 6.4 | — | 22.1 | |
| 29 | – | 6.2 | — | — | |
| 30 | – | 5.9 | — | — | |
| 31a | – | 5.9 | |||
| 32 | – | 5.4 | — | — | |
| 33a | – | 4.5 | |||
| 34 | – | 4.5 | — | — | |
| 35a | – | 4.4 | — | 22.1 |
| Model | 222The column density in units of cm-2. | 333Unabsorbed 0.3–8 keV power-law flux in units of ergs cm-2 s-1. | 444The base-10 logarithm of the neutron star’s effective temperature in K. | 555The normalization for the NSA model, which is equal to where is the distance to the source in pc. | ||
|---|---|---|---|---|---|---|
| Source 1 | ||||||
| pl | — | — | 11.5/15 | |||
| NSA | — | — | 11.5/15 | |||
| pl+NSA | — | — | — | — | — | 10.5/13 |
| Source 2 | ||||||
| pl | — | — | 12.4/5 | |||
| NSA | — | — | 6.7–7.0666A range is given here because the model is not valid for values of above 7.0. | (4.5–300) | 16.7/5 | |
| pl+NSA | 4.7/3 | |||||