Serendipitous XMM-Newton discovery of a cluster of galaxies at
Abstract
We report the discovery of a galaxy cluster serendipitously detected as an extended X-ray source in an offset observation of the group NGC 5044. The cluster redshift, =0.281, determined from the optical spectrum of the brightest cluster galaxy, agrees with that inferred from the X-ray spectrum using the Fe K complex of the hot ICM (). Based on the 50 ks XMM observation, we find that within a radius of 383 kpc the cluster has an unabsorbed X-ray flux, ergs cm-2 s-1, a bolometric X-ray luminosity, ergs s-1, keV, and metallicity, . The cluster obeys the scaling relations for and observed at intermediate redshift. The mass derived from an isothermal NFW model fit is, , with a concentration parameter, , consistent with the range of values expected in the concordance cosmological model for relaxed clusters. The optical properties suggest this could be a “fossil cluster”.
Subject headings:
galaxies: clusters: general — X-rays: general1. Introduction
Galaxy groups and low mass clusters ( keV) are starting to be detected and analyzed in detail in the X-ray band at intermediate redshift (e.g., Willis et al., 2005; Jeltema et al., 2006). These objects are more likely to display the effects of non-gravitational energy injection into the intracluster medium (ICM) than hotter, more massive, clusters (e.g., Voit, 2005). The study of extended X-ray objects over a broad temperature range at will provide important insight into the evolution of their hot gas and the deviation of X-ray scaling relations from simple, self-similar expectations. Studies of objects in the redshift range with keV already suggest that they are less dynamically evolved than their counterparts at (Mulchaey et al., 2006).
The combination of surveys specifically designed to detect clusters (e.g. the XMM-LSS, Pierre et al., 2004), with serendipitous observations, which can make use of deeper exposures, will further advance the knowledge in this field. Here we present the discovery of a cluster at the redshift of , serendipitously observed during an offset observation of the nearby group NGC 5044. All distance-dependent quantities have been computed assuming = 70 km s-1 Mpc-1, = 0.3 and = 0.7. At the redshift of , 1′ corresponds to 255 kpc. All the errors quoted are at the 68% confidence limit.
2. X-ray Analysis
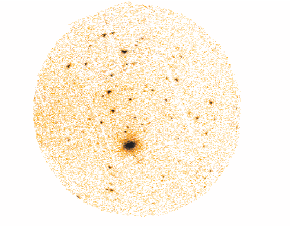
The object XMMU J131359.7–162735 was detected in an offset observation of the group NGC 5044 (obsID 0301290101) performed on 6 January 2006. The source (see Fig.1) is located at 4.7′ off-axis, and it is clearly extended on a arc-minute scale. The X-ray centroid of XMMU J131359.7–162735 in equatorial coordinates is .
The data were reduced with SAS v7.0.0 using the tasks emchain and epchain. We considered only event patterns 0-12 for MOS and 0 for pn. We cleaned the data using the standard procedures: bright pixels and hot columns were removed by applying the expression FLAG == 0, and we corrected for pn out-of-time events. Periods of high background due to soft protons were filtered as in Gastaldello et al. (2006); the observation was very mildly affected by flares leading to only ks of lost data, with net exposures of 52, 50 and 45 ks respectively for MOS1, MOS2 and pn.
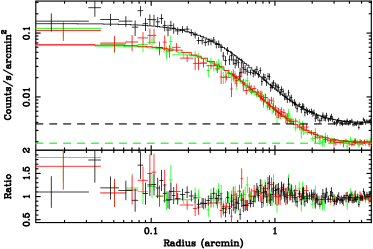
For each detector we created images in the 0.5-2 keV band with point sources masked out using circular regions of 25′′ radius centered at each source position. The images have been exposure-corrected, and a radial surface brightness profile was extracted from a circular region of 6′ radius positioned at the cluster centroid. We account for the X-ray background and the emission of the NGC 5044 group by including a constant background component. The data were grouped to have at least 20 counts per bin in order to apply the statistic. The fitted model is folded with the XMM PSF at energy of 1 keV. The joint best-fit model (Cavaliere & Fusco-Femiano, 1978) has a core radius of kpc (15.5′′′′) and for /d.o.f. = 465/273. Although formally unacceptable, the surface brightness model well-describes the overall shape of the profile, as evinced by the low fractional residuals (see Fig.2). Fits to the profiles of the individual detectors give consistent results within of the combined-fit result. If we use larger extraction regions, the emission by NGC 5044 can no longer be treated as constant: if we account for the emission of NGC 5044 by adding a second model at an offset of 20.7′ (the distance between the source and the emission peak of NGC 5044) with and (Buote et al., 2003), the resulting parameters for the source are consistent within the errors.
We extracted spectra for each detector from a 1.5′ circular region positioned at the centroid of the emission, chosen to maximize the S/N over the background. (Choosing an extraction radius of 2′ does not change the spectral parameters quoted below). Redistribution matrix files (RMFs) and ancillary response files (ARFs) were generated using the SAS tasks rmfgen and arfgen, the latter in extended source mode. Appropriate flux-weighting was performed for RMFs, using our own dedicated software, and for ARFs, using exposure-corrected images of the source as detector maps (with pixel size of 1′, the minimum scale modeled by arfgen) to sample the variation in emission, following the prescription of Saxton & Siddiqui (2002). The background was estimated locally using spectra extracted from a 2′-3′ annular region positioned at the centroid of the emission; using a 3′-4′ annulus gives results consistent within their errors. We checked that vignetting corrections for the sky background components do not affect the results by exploring the complementary approach of a complete modeling of the background components (including the thermal emission of NGC 5044) as in Gastaldello et al. (2006): the spectral results obtained are consistent with the ones quoted below within their errors.
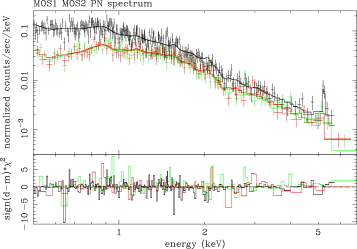
The spectra from the three detectors were re-binned to ensure a signal-to-noise ratio of at least 3 and a minimum 20 counts per bin, and they were jointly fitted with an APEC thermal plasma modified by Galactic absorption (Dickey & Lockman, 1990) . The spectral fitting was performed with Xspec (ver11.3.1, Arnaud, 1996) and quoted metallicities are relative to the abundances of Grevesse & Sauval (1998). We display the spectra in Fig.3. The source photons correspond to about 77% of the total events ( counts in each MOS and in the pn). An emission line is clearly visible corresponding to the Fe K complex emitted at a redshift of . The redshift measured is in close agreement with the redshift of determined optically from the spectrum of the brightest cluster galaxy (see §3). Fixing the redshift value to the optical determination gives as best fit parameters, keV, and, , for /d.o.f. = 486/463.
Using the best-fit model, the unabsorbed flux within the aperture of radius 1.5′ (383 kpc) is ergs cm-2 s-1 in the 0.5-2 keV band. This corresponds to an unabsorbed luminosity of ergs s-1 in the 0.5-2 keV band and to a bolometric (0.01-100 keV) luminosity of ergs s-1. The quoted errors on flux and luminosity are obtained by Xspec using a Montecarlo procedure.
To investigate possible spatial variation in the spectral parameters of the cluster, we extracted two annular regions of radii 0′-0.5′ and 0.5′-1.5′. The derived spectral parameters are: keV and with /d.o.f. = 280/231 for the inner annulus; keV and with /d.o.f. = 280/271 for the outer annulus. The width of the bins has been chosen in order to avoid bias in the temperature measurements caused by scattered flux by the PSF ( 80% encircled energy fraction radius is 25′′ at 1.5 keV and at the off-axis angle of the source). The cluster is therefore consistent with being isothermal over the explored radial range.
XMMU J131359.7–162735 was also serendipitously detected in the ROSAT PSPC pointed observation of NGC 5044 (1WGA J1313.9-1627; White et al., 1994), though it was very close to the detector gaps. This is likely the reason why with ROSAT the source appeared not to be extended and had a lower flux ( ergs cm-2 s-1 in the 0.2-2 keV band).
The cluster has regular X-ray isophotes and is centered on a dominant early type galaxy (see §3). These characteristics suggest the cluster is relaxed and that hydrostatic equilibrium is a good approximation. We calculated the total mass profile using two different models. First, we used the best-fit model (see §2) for which the gas density and total mass profiles can be expressed by simple analytical formula (e.g., Ettori, 2000). We evaluated as the radius at which the density is 500 times the the critical density and the virial radius as the radius at which the density corresponds to , as obtained by Bryan & Norman (1998) for the concordance cosmological model used in this paper. To evaluate the errors on the estimated quantities, we repeat the measurements after 10000 random selections of a temperature and parameters of the surface brightness profile, which were drawn from Gaussian distributions with mean and variance in accordance with the best-fit results. For we obtained, within kpc; the virial mass is, , within the virial radius kpc. Secondly, we fit the surface brightness profile with an isothermal NFW model (Suto et al., 1998). We obtain a concentration parameter, , virial radius kpc, and virial mass , with /d.o.f. = 424/273. The mass determinations using the two different models are in agreement within the errors.
3. Optical Follow-up Observations
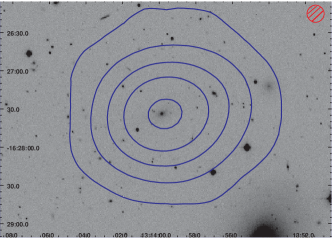
A -band and -band image of the field were taken with the direct imaging CCD on the 2.5-m du Pont Telescope at Las Campanas Observatory on the night of 27 January 2006. In both wavebands, 2300 s exposures were taken in clear, photometric conditions. Photometric zero-points and extinction corrections were determined by observing three standard stars chosen from the Landolt (1992) catalog. The images have been processed and cleaned of CCD defects and cosmic rays. The -band image is shown with X-ray contours superposed in Fig.1. The image reveals an over-density of galaxies and, in particular, a bright dominant galaxy at the same location as the X-ray centroid.
Photometry was performed using SExtractor (Bertin & Arnouts, 1996) with automatic aperture magnitudes. We plot in the top panel of Fig.4 the color-magnitude diagram of the galaxies detected within 3.1′ radius of the central galaxy (corresponding to 803 kpc, half of the estimated virial radius): the horizontal dashed line corresponds to the expected color of a passively evolving elliptical galaxy at , which is for a formation redshift, (Nelson et al., 2002). The difference in magnitude between the central galaxy () and the likely cluster members is very close to the 2 magnitudes of the definition of fossil systems (Jones et al., 2003). We have excluded three objects (triangles in Fig.4) because they are likely members of the NGC 5044 group. A further two objects, which are within 2 magnitudes of the BCG, are very far from the cluster center (2.6′, 664 kpc, and 2.5′, 638 kpc, crosses in Fig.4). A possible member is 1.9 magnitudes fainter than the BCG at a distance of 1.8′ (diamond in Fig.4).
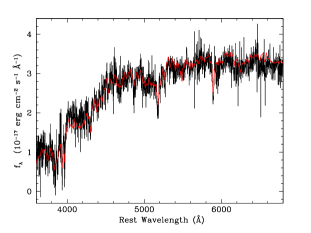
We obtained an optical spectrum of the central galaxy on the night of 7 March 2006 UT, using the ESI spectrograph (Sheinis et al., 2002) at the Keck-II telescope. A 075 slit width was used, giving a spectral resolution of km s-1 (FWHM) and a pixel scale of 11.4 km s-1 pixel-1. The galaxy was observed at airmass 1.25 for 900 s in partly cloudy conditions, and the slit was oriented at the parallactic angle. The spectrum was extracted with a 1′′ extraction width, and wavelength calibrated and flux-calibrated using an observation of the standard star Feige 34. The individual echelle orders were combined into a single spectrum. The galaxy redshift was measured by performing a direct fit of a K3III stellar spectrum (observed on the same night with ESI), velocity-broadened by convolution with a Gaussian kernel. The best-fitting model yields a recession velocity of km s-1, or , in close agreement with the redshift estimated from the X-ray observations. The ESI spectrum is shown in the bottom panel of Fig.4.

4. Discussion
This serendipitously discovered cluster obeys the scaling relations for and derived at intermediate redshift. The aperture of 383 kpc used for spectroscopy encloses 78.3% of the flux within , assuming the cluster emission profile follows the model derived within that aperture. The derived bolometric luminosity within is ergs s-1. The derived is in good agreement with the relation found for the sample of low redshift clusters () by Markevitch (1998), the low-redshift groups () in the GEMS sample (Osmond & Ponman, 2004), the six groups/poor clusters at intermediate redshift () in the XMM LSS survey (Willis et al., 2005), and the six groups/poor clusters at intermediate redshift () in the sample of Jeltema et al. (2006).
The optical appearance of the cluster suggests tantalizing evidence that this object may be one of the rare fossil clusters (3%-6% of the total number according to Milosavljević et al., 2006). More detailed optical imaging and spectroscopy are required to investigate this possibility. The derived total magnitude for the BCG, corrected for Galactic extinction, as well as for the -correction (Fukugita et al., 1995), is , which corresponds to and , adopting colors and (Fukugita et al., 1995). The BCG of XMMU J131359.7–162735 is among the most luminous in the sample of BCGs in fossil systems of Khosroshahi et al. (2006). The measured values of of the BCG and put the object very close to the locus of baryonic closure (Mathews et al., 2005), as expected for fossil systems.
The measured , multiplied by the expected dependence of (Bullock et al., 2001), is consistent with a CDM model with indicative of a relaxed, early forming system in agreement with the theoretical prediction for fossil systems (Zentner et al., 2005; D’Onghia et al., 2005) and with the observational results of relaxed, low- clusters (Buote et al., 2006).
5. Conclusions
The discovery of XMMU J131359.7–162735 reported in this letter represents the deepest observation among the intermediate redshift systems discussed in the literature (Willis et al., 2005; Jeltema et al., 2006), and it already provides an interesting description of its fundamental parameters and dynamical state. Future optical spectroscopy and dedicated X-ray follow-up will allow detailed spectral properties to be measured.
References
- Arnaud (1996) Arnaud, K. A. 1996, in ASP Conf. Ser. 101: Astronomical Data Analysis Software and Systems V, Vol. 5, 17
- Bertin & Arnouts (1996) Bertin, E. & Arnouts, S. 1996, A&AS, 117, 393
- Bryan & Norman (1998) Bryan, G. L. & Norman, M. L. 1998, ApJ, 495, 80
- Bullock et al. (2001) Bullock, J. S., Kolatt, T. S., Sigad, Y., Somerville, R. S., Kravtsov, A. V., Klypin, A. A., Primack, J. R., & Dekel, A. 2001, MNRAS, 321, 559
- Buote et al. (2006) Buote, D. A., Gastaldello, F., Humphrey, P. J., Zappacosta, L., Bullock, J., Brighenti, F., & Mathews, W. 2006, ApJ, submitted, (astro-ph/0610135)
- Buote et al. (2003) Buote, D. A., Lewis, A. D., Brighenti, F., & Mathews, W. G. 2003, ApJ, 594, 741
- Cavaliere & Fusco-Femiano (1978) Cavaliere, A. & Fusco-Femiano, R. 1978, A&A, 70, 677
- Dickey & Lockman (1990) Dickey, J. M. & Lockman, F. J. 1990, ARA&A, 28, 215
- D’Onghia et al. (2005) D’Onghia, E., Sommer-Larsen, J., Romeo, A. D., Burkert, A., Pedersen, K., Portinari, L., & Rasmussen, J. 2005, ApJ, 630, L109
- Ettori (2000) Ettori, S. 2000, MNRAS, 311, 313
- Ferguson & Sandage (1990) Ferguson, H. C. & Sandage, A. 1990, AJ, 100, 1
- Fukugita et al. (1995) Fukugita, M., Shimasaku, K., & Ichikawa, T. 1995, PASP, 107, 945
- Gastaldello et al. (2006) Gastaldello, F., Buote, D. A., Humphrey, P. J., Zappacosta, L., Bullock, J. S., Brighenti, F., & Mathews, W. G. 2006, ArXiv Astrophysics e-prints, ApJ, submitted (astro-ph/0610134)
- Grevesse & Sauval (1998) Grevesse, N. & Sauval, A. J. 1998, Space Science Reviews, 85, 161
- Jeltema et al. (2006) Jeltema, T. E., Mulchaey, J. S., Lubin, L. M., Rosati, P., & Böhringer, H. 2006, ApJ, 649, 649
- Jones et al. (2003) Jones, L. R., Ponman, T. J., Horton, A., Babul, A., Ebeling, H., & Burke, D. J. 2003, MNRAS, 343, 627
- Khosroshahi et al. (2006) Khosroshahi, H. G., Ponman, T. J., & Jones, L. R. 2006, MNRAS, 372, L68
- Kinney et al. (1996) Kinney, A. L., Calzetti, D., Bohlin, R. C., McQuade, K., Storchi-Bergmann, T., & Schmitt, H. R. 1996, ApJ, 467, 38
- Landolt (1992) Landolt, A. U. 1992, AJ, 104, 340
- Markevitch (1998) Markevitch, M. 1998, ApJ, 504, 27
- Mathews et al. (2005) Mathews, W. G., Faltenbacher, A., Brighenti, F., & Buote, D. A. 2005, ApJ, 634, L137
- Milosavljević et al. (2006) Milosavljević, M., Miller, C. J., Furlanetto, S. R., & Cooray, A. 2006, ApJ, 637, L9
- Mulchaey et al. (2006) Mulchaey, J. S., Lubin, L. M., Fassnacht, C., Rosati, P., & Jeltema, T. E. 2006, ApJ, 646, 133
- Nelson et al. (2002) Nelson, A. E., Gonzalez, A. H., Zaritsky, D., & Dalcanton, J. J. 2002, ApJ, 566, 103
- Osmond & Ponman (2004) Osmond, J. P. F. & Ponman, T. J. 2004, MNRAS, 350, 1511
- Pierre et al. (2004) Pierre, M., et al. 2004, Journal of Cosmology and Astro-Particle Physics, 9, 11
- Saxton & Siddiqui (2002) Saxton, R. D. & Siddiqui, H. 2002, XMM-SOC-PS-TN-43
- Sheinis et al. (2002) Sheinis, A. I., Bolte, M., Epps, H. W., Kibrick, R. I., Miller, J. S., Radovan, M. V., Bigelow, B. C., & Sutin, B. M. 2002, PASP, 114, 851
- Suto et al. (1998) Suto, Y., Sasaki, S., & Makino, N. 1998, ApJ, 509, 544
- Voit (2005) Voit, G. M. 2005, Rev. Mod. Phys., 77, 207
- White et al. (1994) White, N. E., Giommi, P., & Angelini, L. 1994, IAU Circ., 6100, 1
- Willis et al. (2005) Willis, J. P., et al. 2005, MNRAS, 363, 675
- Zentner et al. (2005) Zentner, A. R., Berlind, A. A., Bullock, J. S., Kravtsov, A. V., & Wechsler, R. H. 2005, ApJ, 624, 505