Photometric Properties of the Most Massive High-Redshift Galaxies
Abstract
We calculate the observable properties of the most massive high-redshift galaxies in the hierarchical formation scenario where stellar spheroid and supermassive black hole growth are fueled by gas-rich mergers. Combining high-resolution hydrodynamical simulations of the hierarchical formation of a quasar, stellar population synthesis models, template AGN spectra, prescriptions for interstellar and intergalactic absorption, and the response of modern telescopes, the photometric evolution of galaxies destined to host quasars are modeled at redshifts . These massive galaxies, with enormous stellar masses of and star formation rates of at , satisfy a variety of photometric selection criteria based on Lyman-break techniques including -band dropouts at , -band dropouts at , and -band dropouts at . The observability of the most massive high-redshift galaxies is assessed and compared with a wide range of existing and proposed photometric surveys including SDSS, GOODS/HUDF, NOAO WDFS, UKIDSS, the IRAC Shallow Survey, Ultra-VISTA, DUNE, Pan-STARRS, LSST, and SNAP. Massive stellar spheroids descended from quasars will likely be detected at by existing surveys, but owing to their low number densities the discovery of quasar progenitor galaxies at will likely require future surveys of large portions of the sky () at wavelengths . The detection of rare, star-bursting, massive galaxies at redshifts would provide support for the hierarchical formation of the earliest quasars and characterize the primitive star-formation histories of the most luminous elliptical galaxies.
Subject headings:
galaxies: formation – galaxies: evolution1. Introduction
Supermassive black holes (SMBHs) serve as the relativistic engines of quasars (Lynden-Bell, 1969) and the existence of quasars at suggests the rapid formation of SMBHs with masses (e.g., Fan et al., 2000, 2001a, 2003, 2004, 2006). Examining the consistency of rapid SMBH growth and the formation of cold dark matter (CDM) structures at high-redshifts has been of long standing theoretical interest (e.g., Efstathiou & Rees, 1988), as a confluence of the deep potential well of a rare, massive dark matter halo, an abundant supply of baryons, and an efficient SMBH fueling mechanism is likely needed to grow enormous SMBHs in the available Myrs before redshift . The existence of quasars at can be considered a posteriori evidence that our currently dark energy-dominated () universe can muster this confluence, but little else is known observationally about the associated formation of quasar host galaxies at such high redshifts. The focus of this paper is to assist in the detection and characterization of massive galaxies destined to host quasars by calculating their photometric evolution in the scenario where structure formation fuels SMBHs and grows stellar spheroids through gas-rich mergers.
The formation of stellar spheroids through mergers of disk galaxies has been a long-established vehicle for galaxy evolution (e.g., Toomre & Toomre, 1972; Toomre, 1977). If the disk galaxies contain gas before the merger, gravitational torques can enable gas to loose angular momentum, flow efficiently to the centers of the merging systems, and result in a starburst (Larson & Tinsley, 1978; Noguchi, 1988; Hernquist, 1989; Barnes & Hernquist, 1991, 1996; Mihos & Hernquist, 1994, 1996). The efficient fueling of starbursts by mergers may explain ultraluminous infrared galaxies (ULIRGS, e.g. Soifer et al., 1984; Young et al., 1986; Soifer et al., 1987; Sanders & Mirabel, 1996) as an intermediate phase where the high infrared luminosities are powered by star formation before gas accretion can grow central supermassive black holes to be massive enough to become luminous quasars (Sanders et al., 1988b, a; Hernquist, 1989; Sanders & Mirabel, 1996; Genzel et al., 1998). This evolutionary picture would paint starbursts, ULIRGS, and quasars as stages in a structure formation process that builds spheroid and SMBH mass contemporaneously through galaxy mergers.
The observed correlations between SMBH mass and stellar spheroid mass (the relation, e.g. Kormendy & Richstone, 1995; Magorrian et al., 1998; Marconi et al., 2003; Häring & Rix, 2004), SMBH mass and stellar velocity dispersion (the relation, Ferrarese & Merritt, 2000; Gebhardt et al., 2000; Tremaine et al., 2002), and the black hole fundamental plane (Hopkins et al., 2007a) have been widely interpreted as evidence for the coeval or coupled formation of SMBHs and stellar spheroids (e.g. Silk & Rees, 1998; Fabian, 1999; Kauffmann & Haehnelt, 2000; Volonteri et al., 2003; Wyithe & Loeb, 2003; King, 2003; Granato et al., 2004; Hopkins et al., 2006a, b). Hydrodynamical simulations of the formation of SMBHs and their host spheroids in gas-rich mergers (Di Matteo et al., 2005; Robertson et al., 2006b) that include a prescription for SMBH growth and feedback (Springel et al., 2005b) generically predict that such mergers undergo starbursts, consistent with earlier simulations that did not include SMBH modeling (e.g., Mihos & Hernquist, 1994; Barnes & Hernquist, 1996), and that the spheroid forms primarily before the growing SMBHs reach their final mass. Once the rapidly growing SMBHs become massive enough to drive energetic outflows, the SMBH feedback truncates star formation (Di Matteo et al., 2005; Springel et al., 2005a) and becomes visible as a luminous quasar as the outflow removes obscuring material at the galaxy center (Hopkins et al., 2005). Ultimately, the end state of this dissipative process is a spheroidal remnant that closely matches observed elliptical galaxy structural (e.g., Robertson et al., 2006a) and kinematic (e.g., Cox et al., 2006b) properties and satisfies the observed SMBH-spheroid correlations (Di Matteo et al., 2005; Robertson et al., 2006b; Hopkins et al., 2007a). The general consistency of the evolutionary sequence as detailed by these simulations with available observational data at redshifts has been discussed elsewhere (e.g., Hopkins et al., 2006a, b, c).
While a developmental connection between stellar spheroids and the SMBHs they host has observational support in the nearby universe, the properties of quasars may complicate this simple coeval picture. The Sloan Digital Sky Survey (SDSS; York et al., 2000) was used in concert with Two Micron All Sky Survey -band imaging (2MASS; Skrutskie et al., 1997) to photometrically identify the quasar SDSS J1148+5251, spectroscopically confirmed to reside at redshift (Fan et al., 2003). Estimates of the SMBH mass from MgII and CIV line widths for this quasar are (Willott et al., 2003; Barth et al., 2003), suggesting that the SMBH is near its Eddington limit.
Radio observations of SDSS J1148+5251 infer the presence of molecular hydrogen from CO(3-2) emission, with (Walter et al., 2003). The dynamical mass for the quasar host , estimated from CO line widths (Walter et al., 2003, 2004), suggests that the molecular gas and SMBH, rather than some dominant stellar component, supply the majority of the local potential within . However, radiative transfer calculations of CO line emission in quasars show that owing to projection effects the small observed line widths could be consistent with presence of a massive bulge in the quasar host galaxy, but such observed orientations are unlikely (Narayanan et al., 2006). The large IR luminosity (Bertoldi et al., 2003) and radio continuum imaging (Carilli et al., 2004) imply a star formation rate of if the emission is powered by reprocessed starlight, and the presence of dust and metals may suggest a prior epoch of star formation in the system (Barth et al., 2003; Walter et al., 2003; Bertoldi et al., 2003; Carilli et al., 2004). The general uncertainty about the presence of a massive stellar component in quasars then poses two questions: if the progenitors and descendants of quasars do contain a substantial stellar component what would their properties be and how might one detect them?
The detection of high-redshift galaxy populations at redshifts has greatly developed over the last fifteen years. The adoption of photometric techniques to identify the Lyman break in galaxy spectra (e.g., Steidel & Hamilton, 1992, 1993; Steidel et al., 1996), owing to intergalactic medium (IGM) absorption (e.g., Madau, 1995), the Balmer and spectral break (e.g., Franx et al., 2003), and narrow-band searches for emission (e.g. Cowie & Hu, 1998; Hu et al., 2002) has led to the discovery of galaxy populations at progressively higher redshifts. Multicolor Hubble Space Telescope (HST) observations of the Hubble Deep Field (HDF; Williams et al., 1996) allowed for the efficient identification of large numbers of -band ( filter) dropout candidates at (Madau et al., 1996) and redder, more distant dropout candidates (e.g., Lanzetta et al., 1996) including a -band ( filter) dropout spectroscopically verified to reside at (Spinrad et al., 1998).
Subsequently, photometric dropout techniques based on the Lyman spectral break were used to identify high-redshift galaxy populations in the Hubble Ultra Deep Field (HUDF; Beckwith et al., 2006) with the Advanced Camera for Surveys (ACS; Ford et al., 1998) and the Near Infrared Camera and Multi-Object Spectrometer (NICMOS) Ultra Deep Field (Thompson et al., 2005), and in the wider Great Observatories Origins Deep Survey (GOODS; Dickinson et al., 2003; Giavalisco et al., 2004a). As with the HDF data, color selections based on - and -dropouts were used (e.g., Giavalisco et al., 2004b), but large samples based on -band ( filter) and even -band ( filter) dropouts have been identified in GOODS and the HUDF by several groups (e.g., Stanway et al., 2003, 2004b, 2004a, 2005; Yan et al., 2003, 2004; Yan & Windhorst, 2004; Yan et al., 2006; Bunker et al., 2003, 2004; Bouwens et al., 2003, 2004; Bouwens & Illingworth, 2006; Bremer et al., 2004; Dickinson et al., 2004; Stiavelli et al., 2004; Eyles et al., 2006; Dunlop et al., 2006; Overzier et al., 2006; Lee et al., 2006; Reddy et al., 2006; Vanzella et al., 2006; Verma et al., 2007). The GOODS optical and near-infrared data sets have been combined with Spitzer Space Telescope (Werner et al., 2004) observations using the Infrared Array Camera (IRAC; Fazio et al., 2004) to help constrain longer wavelength portions of the spectral energy distributions (SEDs) of high-redshift galaxy candidates (e.g., Mobasher et al., 2005; Egami et al., 2005; Yan et al., 2005; Eyles et al., 2005; Stark et al., 2006; Papovich et al., 2006; Labbé et al., 2005, 2006, see also Barmby et al. (2004)).
Parallel efforts have been made with ground-based observations, sometimes in concert with HST or Spitzer data sets, including optical break searches (Franx et al., 2003; Daddi et al., 2003; van Dokkum et al., 2004), Lyman-break galaxy (LBG) searches using a variety of techniques including (Lehnert & Bremer, 2003), (Ouchi et al., 2004), (Grazian et al., 2006), and (Richard et al., 2006) color selections, and very-high redshift () narrow band and spectroscopic -emitter searches (e.g., Ellis et al., 2001; Kodaira et al., 2003; Kurk et al., 2004; Santos, 2004; Ouchi et al., 2005; Chary et al., 2005; Taniguchi et al., 2005; Stern et al., 2005b; Iye et al., 2006; Kashikawa et al., 2006). Collectively, these observational efforts and others have established the existence of a substantial galaxy population at . A brief review of the known high-redshift galaxy population can be found in Hu & Cowie (2006).
Theoretical calculations of the photometric properties of galaxies have been explored previously by hydrodynamical simulations of cosmological structure formation at redshifts (Katz et al., 1992; Davé et al., 1999; Nagamine et al., 2005a, b), (Weinberg et al., 2002; Nagamine et al., 2004, 2006), (Harford & Gnedin, 2003; Finlator et al., 2006; Night et al., 2006), and (Barton et al., 2004; Davé et al., 2006), and in semi-analytic calculations (e.g., Baugh et al., 1998; Kauffmann et al., 1999; Somerville et al., 2001). These calculations show that simulated galaxies, typically with maximum star formation rates of , can satisfy Lyman-break color selection techniques. These simulated galaxy samples broadly agree with the observed properties of high-redshift galaxies, but given the simulated comoving volumes (), the galaxies examined to date are orders of magnitudes less massive than quasar host halos that have comoving number densities of (Fan et al., 2003). Furthermore, these cosmological simulations have not included prescriptions for energetic feedback from SMBH growth that have been demonstrated to influence the photometric properties of elliptical remnants formed in hydrodynamical simulations of isolated disk galaxy mergers (e.g., Springel et al., 2005a).
To calculate the photometric evolution of quasar host galaxies, we use the simulations of Li et al. (2006) that combine merger trees measured from cosmological N-body simulations of a comoving volume with hydrodynamical simulations of galaxy mergers that include gas cooling, star formation and supernovae, and a prescription for feedback from growing SMBHs to track the hierarchical formation of a massive galaxy at redshifts . These simulations are described in detail in Li et al. (2006) and summarized in §2. The galaxy hosts a quasar at that is similar in bolometric luminosity to the quasar SDSS J1148+5251 (Fan et al., 2003). The photometric evolution of the host galaxy is modeled before, during, and after the quasar phase by applying population synthesis models, template AGN spectra, a prescription for dust attenuation and reddening, intergalactic medium absorption, and telescope responses, and is described in §3. In §4, the photometric evolution of the host galaxy is compared with a variety of optical and near-infrared photometric selection criteria from the literature. The observability of high-redshift quasar host galaxies is assessed in §5. We provide a brief discussion in §6 and summarize and conclude in §7. We adopt a flat cosmology with matter density , dark energy density , baryon density , spectral index , and root-mean-squared fluctuations on scales of . Unless otherwise noted, we report magnitudes on the AB scale (Oke, 1974).
2. Simulations
We use the Li et al. (2006) hydrodynamical simulation of the formation of a quasar as input for our calculation of the photometric evolution of the most massive quasar host galaxies. The simulation is described in detail by Li et al. (2006), and other specifics of the modeling can be found in Springel et al. (2005b) and Robertson et al. (2006b), but a brief summary of the simulation follows.
The rarity of quasars requires the simulation of very large volumes to capture the high-sigma fluctuations that give rise to early-forming massive galaxies. To accomplish this, a particle N-body simulation of a volume of a cosmology consistent with the first-year results of the Wilkinson Microwave Anisotropy Probe (WMAP1, , , , , Spergel et al., 2003) was performed. This simulation, with dark matter particle mass and force resolution , was evolved from to . Dark matter particles bound to the most massive halo in the volume, with at , are identified at . The volume is then resimulated (Power et al., 2003; Gao et al., 2005) from to with dark matter particles, with high-resolution dark matter particles (, ) distributed in the Lagrangian volume that comprised the most massive halo at and the remaining particles properly placed throughout the rest of the volume to retain the large scale tidal field.
The simulation is used to follow each merger in the hierarchical formation history of the halo between and . The merger history is comprised of 7 major mergers (with mass ratios less than ) between and contributing to the halo mass at . To model the formation of the baryonic component of the quasar host halo, each event in the merger tree is resimulated using the smoothed particle hydrodynamics (SPH) / N-body code GADGET2 (Springel, 2005). The merging systems are represented with hydrodynamical models of disk galaxies (Springel et al., 2005b) with structural properties initialized according to the Mo et al. (1998) dissipational galaxy formation formalism and scaled appropriately to high-redshift following Robertson et al. (2006b). The scalings simply fold the redshift- and mass-dependent dark matter concentrations (e.g. Bullock et al., 2001) and the redshift-dependent Hubble parameter through the Mo et al. (1998) formalism, resulting in smaller, more centrally concentrated disks at higher redshifts. The orbital parameters of each progenitor galaxy (see Table 1 of Li et al. (2006)) are set such that the initial separation of the galaxies is the current host halo virial radius at the time of the merger and the pericentric passage distance is half the progenitor disk scale-length .
The merging disk galaxies range in virial mass from the initial progenitor’s at to the last merging galaxy’s . Each progenitor disk has a mass , with gas fractions of at redshifts and at redshifts . For the numerical parameters of the progenitor galaxy models, a fixed dark matter particle mass () and baryonic particle mass () is used. The gravitational softening for the dark matter particles () is set twice as large as for the baryonic particles (). Star formation is treated in a McKee & Ostriker (1977) multiphase picture for the interstellar medium (ISM), implemented as a numerical algorithm by Springel & Hernquist (2003). In this multiphase ISM model, dense, star-forming gas particles are treated as a collection of cold molecular clouds embedded in a tenuous phase heated by supernovae. The star-formation rate is calibrated to reproduce the Schmidt-Kennicutt Law (Schmidt, 1959; Kennicutt, 1998), with the star forming gas mass calculated from the cold phase density. Stellar particles are spawned probabilistically from star- forming gas particles. Each stellar population is formed with half the mass of its parent gas particle and recycles 2% of its mass as metals through supernovae (for details, see Springel & Hernquist, 2003).
The Li et al. (2006) simulation includes a prescription for SMBH accretion and feedback (for details, see Springel et al., 2005b). Each simulated galaxy is initialized with a SMBH “sink” particle that is allowed to spherically accrete through a Bondi (1952) prescription. The accretion rate is determined from the gas temperature and density near the SMBH particle, and is limited to the Eddington rate. A fraction of the accreted rest mass energy released as radiation and a small fraction of this radiated energy (5%) is coupled to the surrounding gas as thermal feedback. The strength of the feedback is calibrated to reproduce the local relation in isolated mergers of disk galaxies (Di Matteo et al., 2005). The mass of the SMBH seed in each galaxy is determined by assuming a single black hole formed in each halo at , in accord with expectations from Population III star formation (e.g. Abel et al., 2002; Bromm & Larson, 2004; Yoshida et al., 2003, 2006), and then experienced Eddington-limited growth until its host galaxy merged into the quasar host halo. The SMBH seeds initialized in this manner range in mass from at to at . As dynamical friction operates on the merging galaxies during the simulation, the central regions of each system eventually coalesce. Once the SMBH particles approach to within the gravitational force resolution they are merged.
2.1. Mergers, Star Formation Rate, and Active Galactic Nuclei Luminosity
The seven major mergers between eight galaxies occur during five redshift eras of the evolution: the first merger between two galaxies (, ) begins at , followed by two additional mergers (, ) at , single mergers at () and at (), and two final mergers (, ) at . The fresh gas supply introduced by each merger, combined with the high density environment and violent tidal interactions, leads to peaks in the star formation rate (SFR, Fig. 1, upper panel) that temporally correlate with the merger events. The SFR peaks near the mergers with , but frequently exceeds over the redshift range .
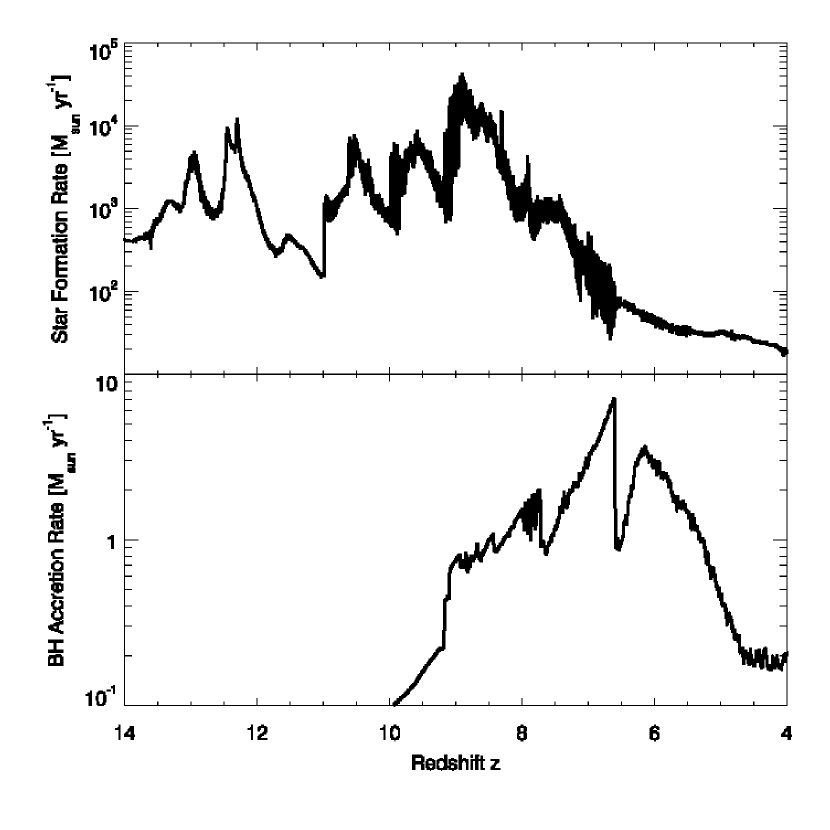
The total SMBH accretion rate (Fig. 1, lower panel) also influences the observable properties of the system. The unattenuated bolometric luminosity of the active galactic nuclei (AGN) powered by the growing SMBHs is determined by the accretion rate onto the SMBHs through the equation
| (1) |
where is the radiative efficiency of the accretion model we adopt and is the speed of light.
3. Photometric Modeling
Modeling the observed spectral energy distribution (SED) of the quasar host galaxy involves calculating the SEDs of each individual stellar population and AGN present in the system and applying a wavelength-dependent dust correction to the calculated SEDs that accounts for internal interstellar absorption. The emission from the galaxy, attenuated by ISM reddening, must then be corrected for both the IGM opacity owing to Lyman series absorption and redshifting of the SED owing to cosmological expansion. The measured photometry of the object is then modified by the combined wavelength-dependent transmission of the filter and telescope assembly as well as the wavelength-dependent quantum efficiency of the detector. Below we describe how we model each contribution to the observable photometric properties of the massive quasar host galaxy.
3.1. Stellar Population Synthesis
The hydrodynamical simulation follows the formation of individual stellar populations formed from dense gas, as described in §2. Each stellar particle represents several million solar masses of stars, so an initial mass function (IMF) must be selected to represent distribution of stellar masses formed when each stellar particle is spawned. The IMF also influences the spectral evolution of each stellar population through its time-dependent mass-to-light ratio. We adopt the Kroupa (2001, 2002) IMF, which describes the number of stars of a given mass as a power-law . The Kroupa IMF shares the same power-law index as the Salpeter (1955) IMF for but flattens to at lower masses. The mass-to-light ratio of the Kroupa IMF is correspondingly lower than for the Salpeter (1955) IMF, by a factor of , when normalized over the mass range .
The metallicity and age of each stellar particle is tracked in the simulation, allowing for the use of stellar population synthesis models to calculate an evolving SED for each particle. We use (Leitherer et al., 1999; Vázquez & Leitherer, 2005) to model the spectra from each population, given the mass, age, metallicity, and assumed Kroupa IMF. The version of we use includes the Padova stellar evolution tracks (e.g., Fagotto et al., 1994) to improve the performance of for older () stellar populations (for details, see Vázquez & Leitherer, 2005). Illustrations of the time-dependent SEDs produced by can be found in Figures 4 and 5 of Vázquez & Leitherer (2005). In practice, we produce a grid of spectral models at wavelengths for stellar populations over the range of ages , spaced logarithmically, and for metallicities of , and then interpolate the models to produce an SED appropriate for each stellar particle.
3.2. Active Galactic Nuclei SEDs
As discussed in §2, the simulations follow accretion onto SMBH particles. Given the radiative efficiency we adopt (), we can calculate the bolometric luminosity of the AGN associated with each SMBH (Eq. 1). According to the feedback prescription by Springel et al. (2005b), a fraction of this bolometric luminosity is injected as thermal energy in the surrounding gas. The remaining fraction of the radiated energy would be visible as nuclear emission in the absence of intervening material. To model this emission, we combine the power-law + x-ray reflection component SED template for AGN from Marconi et al. (2004) with the average quasar emission template from Vanden Berk et al. (2001).
The Marconi et al. (2004) SED template consists of a power-law , with in the range set to match the slope inferred from stacked SDSS quasar spectra (Vanden Berk et al., 2001), and a Rayleigh-Jeans fall-off () at longer wavelengths. The ultraviolet () emission has a power-law slope () determined by Telfer et al. (2002) based on the HST spectra of quasars, while the x-ray emission at energies above 1 keV is modeled with a power-law plus PEXRAV model (Magdziarz & Zdziarski, 1995) reflection component. The normalization of the x-ray component relative to the optical power-law component is fixed to reproduce the quantity (Zamorani et al., 1981) that relates the ultraviolet () to x-ray ( keV) flux ratio. The Marconi et al. (2004) SED template uses a luminosity-dependent following Vignali et al. (2003) that leads to a decreasing fraction of the bolometric luminosity emitted in x-rays as the AGN luminosity increases. The ratio of bolometric luminosity to -band luminosity has a corresponding decrease with bolometric luminosity. Figure 3 of Marconi et al. (2004) presents illustrations of their AGN SED template and luminosity-dependent -band and x-ray bolometric corrections.
Vanden Berk et al. (2001) produced a composite quasar spectrum by stacking the spectra of more than 2000 SDSS quasars at wavelengths , including systems with absolute magnitudes of over the redshift span . The continuum of the geometric mean spectrum of these quasars can be represented by a broken power-law with over the wavelength range and at longer wavelengths, and is representative of the composite spectrum of quasars (Fan et al., 2004). While the short wavelength slope is flatter than the slope found for high-redshift quasars (Schneider et al., 1991; Fan et al., 2001b; Schneider et al., 2001), the difference can be accounted for by difficulties in determining the continuum. Prominent emission lines in the Vanden Berk et al. (2001) template spectrum include , CIV, MgII, and H.
To combine the Marconi et al. (2004) SED template with the Vanden Berk et al. (2001) quasar spectrum, we replace the optical power-law component of the Marconi et al. (2004) with the Vanden Berk et al. (2001) spectrum over wavelengths and match the Rayleigh-Jeans and UV power-law continua to the emission line spectrum. The spectrum is then integrated and renormalized to maintain the desired bolometric luminosity, and approximately maintains the emission line equivalent widths and Marconi et al. (2004) luminosity-dependent bolometric corrections while scaling the emission line flux with the AGN luminosity. As discussed below, the choice to combine these spectral templates only influences our results during the evolutionary phases when the AGN dominates the emission of the system, over small redshift ranges near and (see Fig. 1 above and Fig. 11 of Li et al., 2006), but allows us to incorporate the effect of emission on quasar color selection (e.g., Fan et al., 2001a).
3.3. Interstellar Reddening and Absorption
The methods for modeling the emission from stellar populations (§3.1) and AGN (§3.2) allow for an estimation of the unattenuated SEDs of simulated galaxies. The gas-rich galaxies involved in the mergers that lead to quasar activity at contain substantial columns of hydrogen and, owing to the efficient star formation in dense gas, large amounts of obscuring dust. The wavelength-dependent attenuation from dust reddening should therefore be accounted for when modeling the observed SED of the quasar host galaxy.
To incorporate dust attenuation in the photometric modeling, the hydrogen column density and an estimate of the gas metallicity is calculated along the line-of-sight to each stellar population. We use the method of Hopkins et al. (2005) to calculate the gas density on a fine grid from the SPH formalism and the particle distribution. For dense gas above the threshold for star formation a two-phase decomposition of the Springel & Hernquist (2003) multiphase ISM model is performed, assuming the hot and cold phases are in pressure equilibrium, in order to calculate the hot phase column density. For each AGN in the system the column density and metallicity is measured along 100 lines-of-sight to calculate a distribution of optical depths, allowing for an estimate of the scatter in the internal galactic absorption. For discussions on general agreement between the bound-free and metal-line absorption calculated from this method for estimating columns to AGN and models of the cosmic x-ray background, see, e.g., Hopkins et al. (2006a, 2007b).
Once the columns and gas metallicities are calculated, the visual attenuation owing to dust is calculated by scaling the Milky Way (MW) dust-to-gas ratio (Bohlin et al., 1978; Cox, 2000) by the gas metallicity. A linear scaling with metallicity, normalized to the MW ratio for solar metallicity gas, roughly accounts for the observed dust-to-gas ratios in the less metal-rich Large Magellanic Cloud (LMC) and Small Magellanic Cloud (SMC) (e.g., Fitzpatrick, 1986; Rodrigues et al., 1997). The wavelength-dependent dust attenuation must also be modeled, with possible choices including the MW dust curve (e.g., Cardelli et al., 1989) that includes the strong absorption feature, LMC and SMC dust (e.g., Pei, 1992; Gordon et al., 2003), and the possibly supernovae-related dust in high-redshift quasars (Maiolino et al., 2004). We adopt the dust model advocated by Calzetti et al. (1994) for modeling the UV emission from starburst galaxies, with the updated from Calzetti et al. (2000) (see also Calzetti, 1997). The Calzetti et al. (2000) dust law is frequently used to model LBGs and infer their stellar masses (e.g., Papovich et al., 2001; Shapley et al., 2005), and estimates of unattenuated star formation rates using Calzetti et al. (2000) dust corrections have been used to successfully predict the x-ray and radio properties of galaxies at (Reddy & Steidel, 2004). Using SMC dust would increase the UV absorption of the model spectra and increase the transition redshift where model spectra cross boundaries in color-color selections designed to be sensitive to the Lyman break, but would not change the photometric selection of the model spectra with a given color criterion over most of the system’s redshift evolution.
3.4. Intergalactic Medium Absorption
Intervening hydrogen clouds in the intergalactic medium (IGM) can greatly attenuate flux via Lyman-series absorption. To account for this IGM opacity, we adopt the Madau (1995) model of Poisson-distributed absorbers in which Lyman series blanketing causes a “staircase” absorption profile blue-ward of . The spectral break introduced by this absorption has been frequently used to engineer the photometric selection of high-redshift galaxies (e.g., Madau et al., 1996; Steidel et al., 1996; Giavalisco et al., 2004b). By , the mean transmission is only 30% near , but the Poissonian nature of the model can lead to substantial variation in the optical depth at intermediate redshifts. At the fluctuation in optical depth corresponds to 30% transmission variation relative to the unattenuated spectra (see, e.g., Fig. 3 of Madau, 1995). However, Monte Carlo simulations suggest that the bandpass-averaged fluctuations in transmission are typically smaller ( magnitudes, see, e.g., Bershady et al., 1999). At high redshifts () the absorption is very strong near (e.g., , see Fig. 2 of Night et al., 2006) and typical line-of-sight fluctuations will lead to strong spectral breaks. We therefore assume the mean IGM opacity calculated from the model since we are primarily concerned with high-redshifts (), but we note that the calculated photometric trajectories could experience either small shifts in color-color space position or rate of change with redshift owing to line-of-sight opacity fluctuations.
3.5. Telescope, Filter, and Detector Response
To calculate the observed photometric properties of simulated galaxies, the wavelength-dependent transmission of telescope assemblies, filters, and detector quantum efficiency (QE) must be modeled together to determine the net transmissivity of a given observational facility.
For the SDSS -, -, -, -, and -band (Fukugita et al., 1996) transmissivities, we use the USNO40 response functions measured by Jim Gunn 111http://www-star.fnal.gov/ugriz/Filters/response.html. The calculated , , and (Steidel & Hamilton, 1993) magnitudes use the transmissivity measured with the KPNO Mosaic CCDs 222http://www.noao.edu/kpno/mosaic/filters/filters.html. For comparison with HST observations, we calculated the wavelength response curves from the combined transmissivity of the mirror and filters with the detector QE for , , , , and observations with ACS 333ftp://ftp.stsci.edu/cdbs/cdbs2/comp/acs/ and and observations with NICMOS 444ftp://ftp.stsci.edu/cdbs/cdbs2/comp/nicmos/. For the ground-based -, -, and -band transmissivities, we use the calculated relative response curves for 2MASS from Cohen et al. (2003). The IRAC throughput response was adopted from data provided by the Spitzer Science Center 555http://ssc.spitzer.caltech.edu/irac/spectral_response.html. In practice, over the redshift range () considered at flux in all filters bluer than were always too heavily absorbed to be easily measured ( AB magnitudes), so in what follows we focus on the observable properties of galaxies in redder filters.
3.6. Combined SED Modeling
The final model SEDs calculated for the simulated quasar host galaxy combines the stellar population synthesis models described in §3.1, the AGN spectral template described in §3.2, ISM attenuation described in §3.3, and IGM attenuation described in §3.4, to arrive at the observed flux density (adapting the notation of Papovich et al., 2001)
| (2) | |||||
where the rest-frame emission as a function of rest-wavelength from each of sources may depend on the its stellar age , stellar mass , or SMBH accretion rate , and the dust attenuation along the line-of-sight to each source. The typical number of individual stellar population sources is by . The total emitted spectrum from the galaxy is attenuated by the IGM optical depth , and the factors of and the luminosity distance account for the cosmology-dependent redshift and distance. Again following Papovich et al. (2001), the flux density in each filter is calculated as
| (3) |
where unit-free represents the combined transmissivity of the telescope and filter and the detector QE, as described in 3.5. The flux density is converted into a magnitude on the AB scale (Oke, 1974) through the relation
| (4) |
where is the bandpass-weighted flux density (Eq. 3) and .
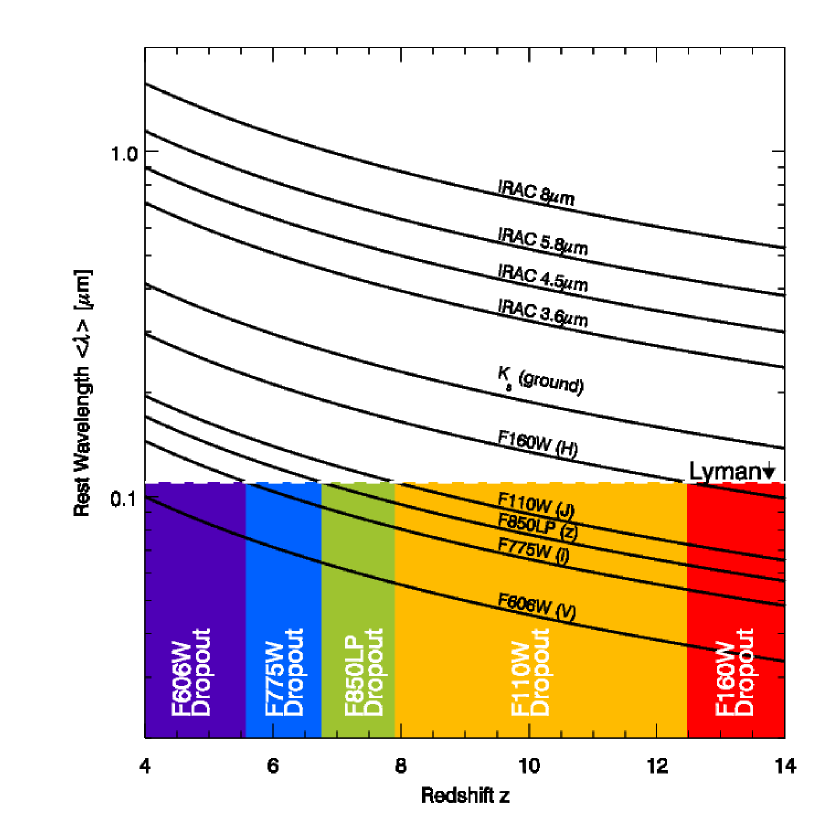
The machinery described above allows for a thorough determination of the photometric properties of a simulated galaxy and an application of common color “dropout” selection techniques based on spectral breaks to track the photometric evolution of the quasar host galaxy with redshift. For reference, a schematic diagram of the relevant redshifts for dropout samples in the ACS and NICMOS filters and a characteristic wavelength coverage for optical and near-IR filters with redshift is provided in Figure 2.
4. Photometric Evolution
The photometric evolution of the quasar host galaxy is calculated using the methods described in §3. In our modeling, we track the luminosity of only the main host halo of the quasar during its evolution; the luminosities of the merging systems are not followed before they enter the host halo virial radius. The merging systems are modeled as almost completely gaseous, resulting in a smooth photometric evolution as each new system is added to the simulation. The variations in the system brightness owe to increases in the star formation rate during the mergers and the evolution of the combined stellar populations of the quasar host galaxy. Below, we describe the photometric evolution of the simulated system over the redshifts .
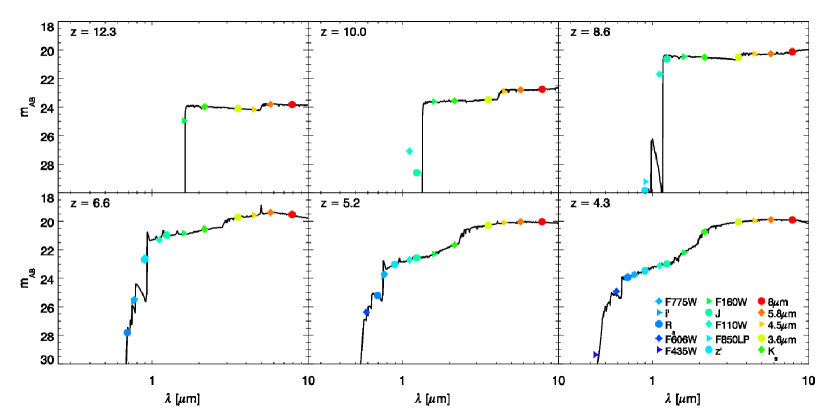
Figure 3 shows the SED and 15 magnitudes calculated for the galaxy at six characteristic times (, , , , , and ) during three distinct phases in its evolution. At redshifts , the system rapidly forms stars as the progenitors of the quasar host galaxy merge into the system. Each of these gas-rich mergers adds enough fuel to induce large star formation rates of . This starburst phase coincides with the formation epoch of the stars that later form the quasar host galaxy. Over this timespan the stellar mass in the system has grown to , or of the final stellar mass at , with a mass-weighted mean stellar age that increases from at to at . The upper panels of Figure 3 show the characteristic starburst spectrum of the galaxy during this phase, with strong rest-frame UV and blue emission. The SED evolves most strongly at long rest-frame wavelengths as the mean stellar age of the system increases, but the short wavelength rest-frame emission is remarkably similar during this phase. The luminosity of the system increases as the star formation rate and stellar mass both increase to . The large optical depth owing to Lyman-series absorption causes a near step-function break blue-ward of the line.
By , the quasar host galaxy begins to change rapidly. At this time a total gas mass of remains, which amounts to roughly of the total baryonic mass of the system. Of this gas, has already been shocked, heated by feedback, or is otherwise too diffuse to form stars (e.g., Cox et al., 2006a). The remaining of the star-forming baryons is dense enough to support a large star formation rate of . However, the starburst epoch is clearly over, extinguished primarily by the consumption of the available fuel rather than by some regulatory feedback mechanism. As the star formation rate rapidly declines, the stellar population quickly ages and increases to a mean age of by and by . While the gas supply cannot sustain the formation of a large new population of stars, it can easily support the exponential growth of SMBHs to . As the violent merging of the system continues to drive the remaining dense gas toward the galactic centers a rapid phase of Eddington-limited SMBH growth begins and eventually leads to a luminous quasar phase at after the SMBHs particles coalesce. The SED of the galaxy reflects the quasar activity, with the hybrid Vanden Berk et al. (2001)-Marconi et al. (2004) model AGN spectrum dominating the blue emission of the galaxy at (Fig. 3, lower left panel). The massive stellar component of the system, with a mean stellar age of , contributes substantially to the emission at rest-frame wavelengths and instills the SED with a Balmer/ break between the - and -bands. As feedback from the SMBH heats the gas in the central-most regions of the quasar host galaxy, the fuel source for SMBH accretion is depleted and the prominence of the AGN contribution to the SED declines. By (Fig. 3, lower middle panel) the massive old stellar population with mean stellar age dominates the spectrum, with residual SMBH accretion providing less-dominant AGN activity. The rest-frame UV and blue optical portion of the SED becomes increasingly feeble compared with the observed near-IR spectral region powered by mature stars.
Below , the host galaxy continues to age and redden during its final, passive evolutionary phase. The star formation rate has declined by approximately three orders of magnitude from its peak near redshift . By (Fig. 3, lower right panel) the massive stellar component has reached a mean age of , and by the mean stellar age will increase to . The UV and blue optical emission from the galaxy has correspondingly decreased, leaving a SED with a dominant Balmer/ break. The SMBH accretion rate has dropped to , bringing the bolometric luminosity of the AGN activity to of the bolometric luminosity of the stellar spheroid. If the system were to continue to evolve passively to low redshift, the galaxy would continue to redden. The giant spheroid would eventually become too red to appear in LBG samples, such as those defined by (Steidel & Hamilton, 1993; Steidel et al., 1995) and (Madau et al., 1996; Steidel et al., 1996) criteria, but would be identified in Distant Red Galaxy (DRG) samples (e.g., Franx et al., 2003) with and (Vega) at . The quasar descendant would eventually obtain a color (calculated assuming passive evolution to ) typical of brightest cluster galaxies in the MaxBCG cluster catalogs of the SDSS (e.g. Koester et al., 2007).
The SEDs calculated for each of the three phases in the photometric evolution of the quasar host galaxy can be used to follow the trajectory of the system through various color-color spaces. The magnitudes calculated according the method described in §3.5 can be compared with color criteria from the literature to determine whether color-selected samples would find massive quasar host galaxies. In what follows, we examine whether the simulated galaxy satisfies common color criteria used in previous observational work. For convenience, the quasar host galaxy magnitudes in the salient observational filters at twenty redshifts are presented in Table 1.
| Redshift | F435W | F606W | F775W | i’ | z’ | F850LP | F110W | F160W | |||||
|---|---|---|---|---|---|---|---|---|---|---|---|---|---|
| 14.00 | |||||||||||||
| 13.18 | |||||||||||||
| 12.32 | |||||||||||||
| 11.04 | |||||||||||||
| 10.03 | |||||||||||||
| 9.600 | |||||||||||||
| 9.209 | |||||||||||||
| 8.555 | |||||||||||||
| 7.970 | |||||||||||||
| 7.467 | |||||||||||||
| 7.008 | |||||||||||||
| 6.607 | |||||||||||||
| 6.467 | |||||||||||||
| 6.300 | |||||||||||||
| 5.993 | |||||||||||||
| 5.563 | |||||||||||||
| 5.007 | |||||||||||||
| 4.491 | |||||||||||||
| 4.250 |
4.1. -dropout Selection
The multi-color HST ACS observations in the GOODS fields allow for a variety of color-color selection criteria to identify LBG samples. The bluest color Lyman-break dropout techniques for HST data that overlap with the simulation redshift coverage are the -dropout selections at . Giavalisco et al. (2004a) presented a -dropout selection for GOODS by the color criterion
| (5) |
where and represent the logical “OR” and “AND” operations, and used galaxies selected in this manner to estimate the global star formation rate density at . A similar selection criterion, defined as
| (6) |
was used by Yan et al. (2005) to find galaxies in the HUDF for examination with coincident Spitzer IRAC observations. The application of stellar population synthesis modeling found that galaxies at in GOODS have typical stellar masses of , stellar ages of , low extinction, and a wide range of metallicities.
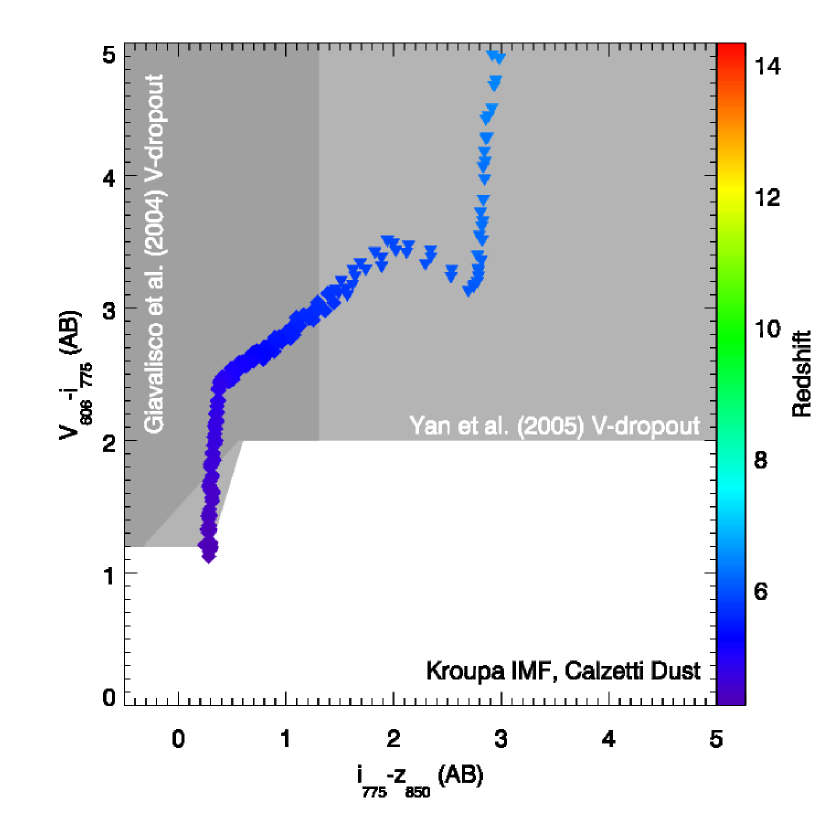
Figure 4 shows the calculated and colors for the massive host galaxy at redshifts . The system satisfies the -dropout color criterion over its entire passive-evolution phase at redshifts when the SMBH accretion and star formation rates are low and the stellar component is passively aging. In -dropout samples, the massive descendants of quasars could appear as bright objects () with red colors (see Fig. 3 or Table 1). At higher redshifts (), during an epoch of AGN activity, the system will move into - and -dropout samples (, see Fig. 5 and §4.2).
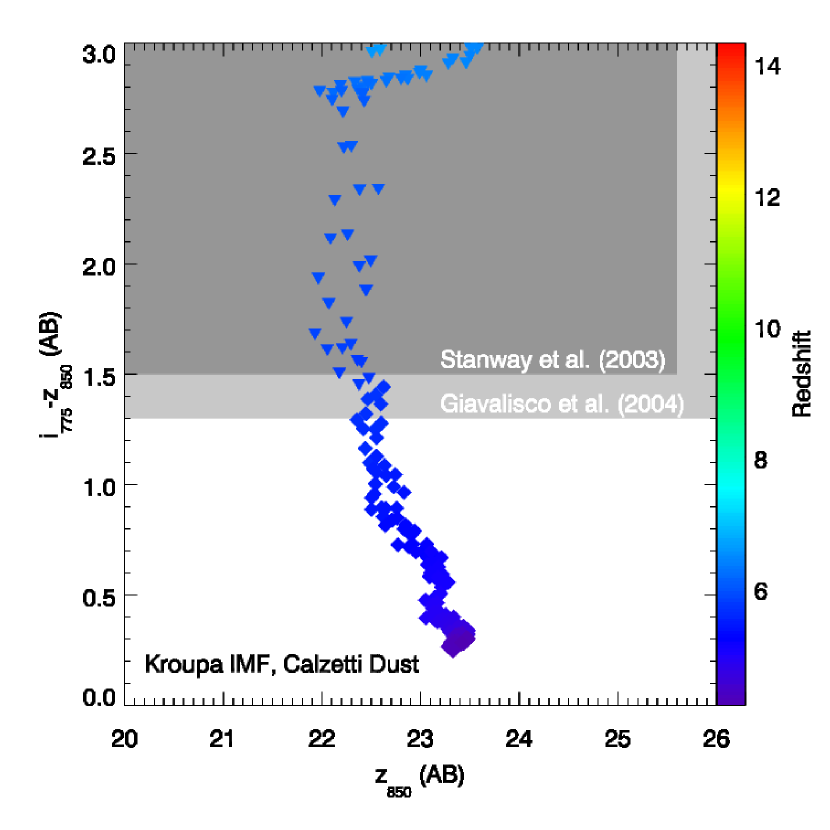
4.2. -dropout Selection
Earlier in the evolution of the quasar host galaxy, during its phase of significant AGN activity at times , the IGM absorption has moved into the filter and the system becomes red in the color. To identify -dropouts at in the GOODS ACS data, Giavalisco et al. (2004b) and Dickinson et al. (2004) used a simple criterion given by
| (7) |
The GOODS data was also used to define a an -dropout sample by Stanway et al. (2003), using similar criteria
| (8) |
(see also Bunker et al., 2004). Both samples were used to estimate the global star formation rate density at .
Figure 5 shows the color and magnitude of the quasar host galaxy during its evolution. The simulated galaxy satisfies these criteria during its phase of AGN activity and, owing to its activity and large stellar mass ( at ), is considerably brighter () than candidate GOODS galaxies (, near the Stanway et al. (2003) magnitude cut).
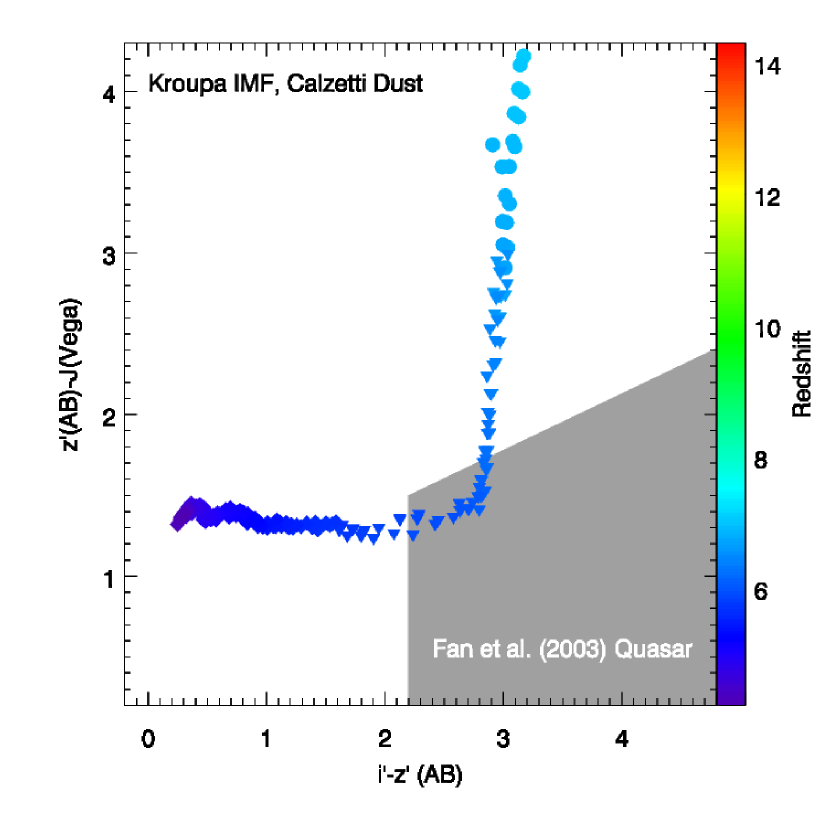
4.3. SDSS Quasar Selection
The identification of quasars by multi-color selection criteria has been a common practice for nearly twenty years (e.g Warren et al., 1987; Irwin et al., 1991), and has proven especially fruitful for identifying distant () quasars in the SDSS (e.g., Fan et al., 2000, 2001a, 2003, 2006). The revised selection criterion used by Fan et al. (2003), given by
| (9) |
incorporates -dropouts determined by the SDSS data with supplemental -band photometry to distinguish from objects with red colors, such as cool stars. Figure 6 shows the and colors calculated for the quasar host galaxy over its evolution, including the phase of strong AGN activity at . The simulated galaxy satisfies the Fan et al. (2003) color criteria during its quasar phase near and would be color-selected as a SDSS quasar candidate. However, the system is magnitudes fainter than the criterion used by Fan et al. (2003) to define their quasar sample. The quasar phase in this simulation () occurs near the beginning of a broader phase of accretion and AGN activity (), before the SMBH mass reaches its final mass. Had the peak unobscured SMBH accretion occurred slightly later (e.g., rather than ), the system would have met the magnitude cut for the Fan et al. (2003) SDSS quasar selection. We note that at the system moves near the L-dwarf locus in the vs. color space, similar to the behavior of the quasar evolutionary track examined by Fan et al. (2003) to inform their choice of color selection criteria.
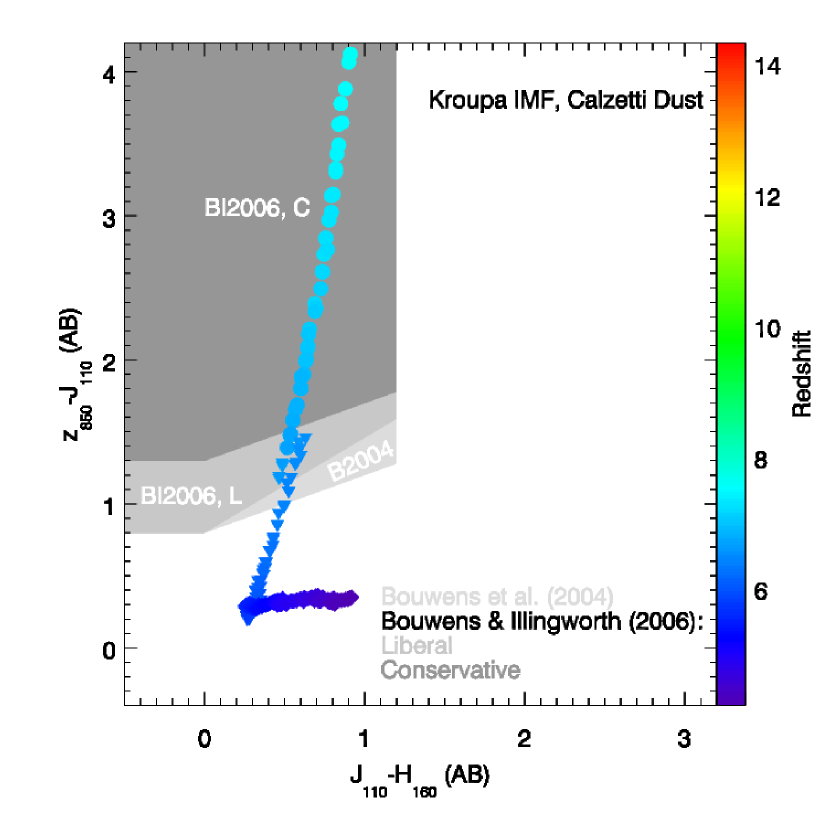
4.4. -dropout Selection
The combined ACS and NICMOS observations of the HUDF and GOODS fields have allowed for a search of galaxies by looking for -dropouts. Yan & Windhorst (2004) found three -dropout galaxies in the HUDF but concluded that their red colors made them unlikely to reside at . Bouwens et al. (2004) and Bouwens & Illingworth (2006) used -dropout criteria with a blue color cut to find galaxies more robustly. These color-color criteria include the selection
| (10) |
from Bouwens et al. (2004), the “liberal” color selection from Bouwens & Illingworth (2006)
| (11) |
and the Bouwens & Illingworth (2006) “conservative” selection
| (12) |
These photometric selections find high-redshift galaxies in GOODS, suggesting a rapid decline in the density of luminous star-forming galaxies and a decrease of the characteristic luminosity of galaxies by AB magnitude from to .
Figure 7 shows the and colors calculated for the quasar host galaxy with redshift. The lower-redshift epochs that cover the AGN activity and passive-evolution phases occur below and largely do not satisfy the -dropout color criteria. The starburst phase at , when the luminosity of the system is dominated by the young stars generated by the enormous star formation rates , covers the entire color extent of the Bouwens & Illingworth (2006) conservative selection. The starbursting quasar progenitor grows to in stars with a mass-weighted stellar age of at , powering a remarkable luminosity -magnitudes brighter than -dropout candidates in GOODS. If quasars form in the manner suggested by the Li et al. (2006) simulations, a -dropout or similar selection criterion would be well-matched to find quasar progenitors during the peak of their spheroid formation.
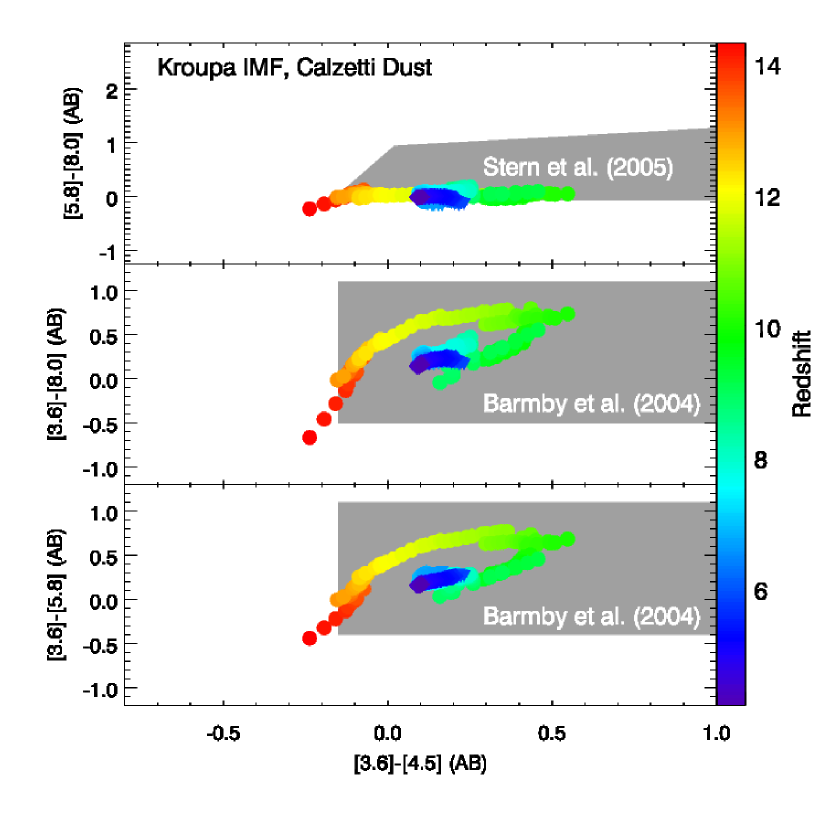
4.5. IRAC-based Selection
In surveys at redshifts , the IR properties of both AGN and galaxies have been used to design color-color selection criteria using IRAC bands. Stern et al. (2005a) showed that the color of broad-line AGN at are typically redder than galaxies at . Their selection, given by,
| (13) |
identified 90% of the spectroscopically identified type 1 AGN in the AGN and Galaxy Evolution Survey (AGES).
Barmby et al. (2004) used template SEDs to estimate the location of galaxies at in the vs. and vs. color-color spaces. Comparing with a sample of confirmed LBG galaxies, they found that the majority of the LBGs resided in the IRAC color-color regions
| (14) |
and
| (15) |
Barmby et al. (2004) combined these criteria with selections based on -band magnitude. At the redshifts we consider, the quasar host galaxy always has significant IGM attenuation of the -band and is significantly redder in color than the galaxies examined by Barmby et al. (2004). We therefore compare only with their IRAC color-color selections.
Figure 8 shows the calculated IRAC colors for the simulated quasar host galaxy at redshifts . The galaxy satisfies the Barmby et al. (2004) and Stern et al. (2005b) criteria during most of its evolution. The color begins blue at redshifts when the star-forming SED has its rest-frame near-UV and optical emission in the shortest-wavelength IRAC bands. As the redshift decreases and the stellar populations age, the color increases until the Balmer/4000Å break passes through these bands and the galaxy becomes very red in . At lower redshifts, the system becomes relatively stable in its color for the remainder of the simulation. The system has a consistently flat color, and would allow for its selection by the Stern et al. (2005b) criteria. However, the AGES sub-sample of the IRAC Shallow Survey (Eisenhardt et al., 2004) has a limiting magnitude magnitudes fainter than the complete Shallow Survey in the -band, and is too shallow to detect the simulated quasar host galaxy. The Barmby et al. (2004) color selections involve the -band and have considerably more evolution than redder bands since the -band transitions through the Balmer/4000Å break (see §4.6 below). The large color-color area of the Barmby et al. (2004) criterion would allow for the quasar host galaxy to be selected over almost the entire duration of the simulation (redshifts ). All three IRAC criteria examined would be convenient methods to define color selected samples that could include quasar host galaxies at .
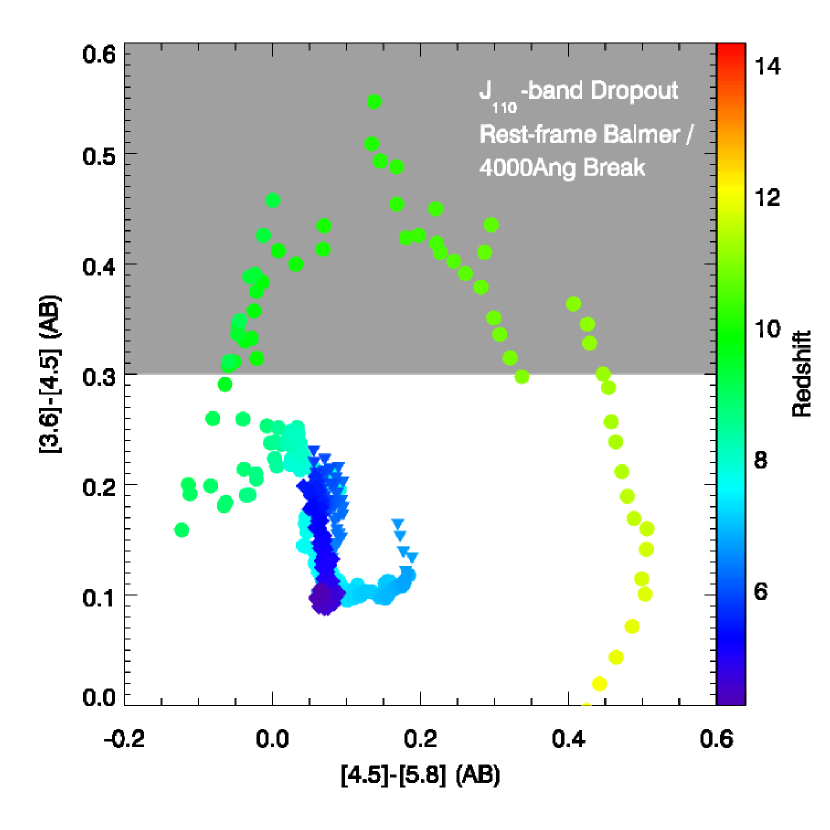
4.6. High-Redshift 4000Å/Balmer Breaks
The presence of 4000Å or Balmer breaks in the observed SEDs of galaxies has been cited as evidence for evolved stellar populations in galaxies at (e.g. Franx et al., 2003). The calculated quasar progenitor star formation history (Fig. 1) suggests that a significant population of stars () can form in such systems by . As these stars age they can contribute a small 4000Å / Balmer spectral break in the galaxy SED, as is apparent in the SED in Figure 3, and may be detected photometrically in the near-IR.
Figure 9 shows the calculated IRAC vs. colors for the simulated quasar host galaxy at redshifts . The observable near-IR SED is very flat over the majority of the galaxy’s evolution, remaining at and at redshifts . At higher redshifts when the SED would move into -dropout samples, the Balmer/4000Å break moves into the -band and causes the color to redder by magnitudes. As the Balmer/4000Å break moves through the -band, the evolutionary track of the SED reverses direction at higher redshifts and the system becomes substantially bluer in as the filters begin to probe the region of the SED sensitive to the large star formation rate (at , see the upper left panel of Fig. 3). In contrast, the trajectory of local galaxy SEDs with mature stellar populations in color-spaces sensitive to optical breaks continue to redden as the SEDs are shifted to higher redshifts (e.g., color at redshifts , see Figure 1 of Franx et al., 2003). The extremum of the at owing to the rest-frame optical break makes the color a useful indicator for the presence of mature stars in -dropout samples.
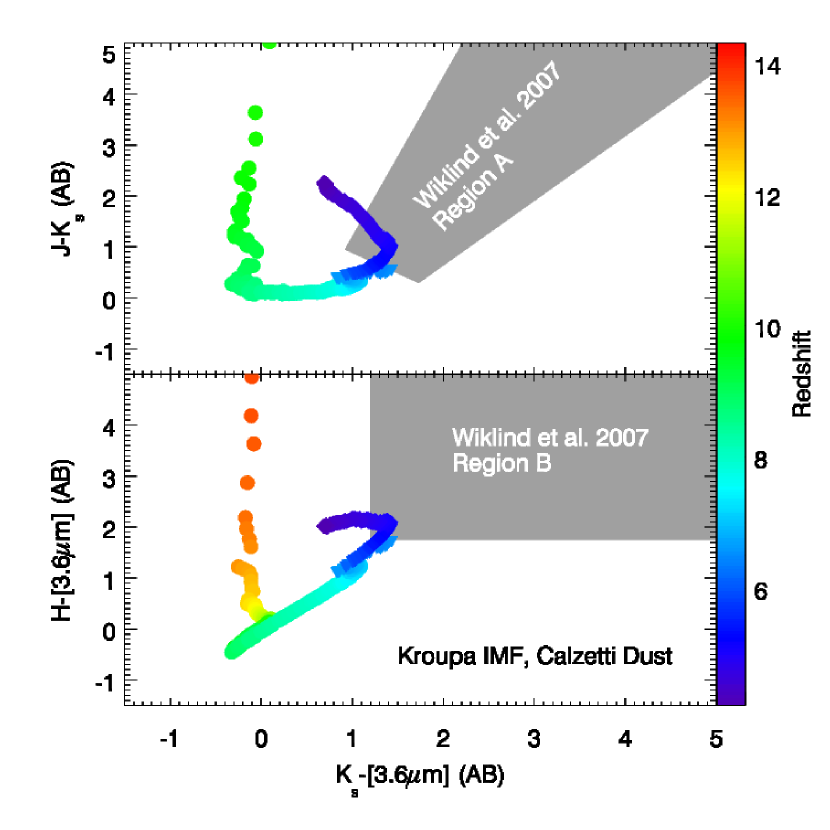
A completely analogous behavior can occur in lower redshift samples in bluer bands. SED fits to -dropout galaxies in the HUDF at show evidence for a rest-frame optical break in their colors (Labbé et al., 2006), as do galaxies (Yan et al., 2005; Eyles et al., 2005), and possibly indicate an evolved stellar component. Recently, Wiklind et al. (2007a, b) have proposed Balmer break selection criteria for post-starburst systems at using VLT/ISAAC near-IR , , and and IRAC band observations of the GOODS fields. Their selection is defined by a union of objects in two regions: a “Region A” in the vs. color space, given by
| (16) |
and a “Region B” in the vs. color space, given by
| (17) |
Figure 10 shows the calculated near-infrared , , , and IRAC colors with redshift for the quasar host galaxy SED in relation to Regions A and B from Wiklind et al. (2007a, b). The quasar descendant satisfies the Wiklind et al. (2007a, b) criteria over the redshift range , during the post-starburst, passively-evolving phase of the system’s evolution. The comparison suggests that the Wiklind et al. (2007a, b) criteria would select the descendants of quasars during the passively-evolving phase near redshift . While the Wiklind et al. (2007a, b) selection was designed to find massive () and evolved galaxies near , the agreement may be somewhat surprising given that the evolution of the simulated quasar host SED in the -, -, -, and -bands is qualitatively different than the evolving SED models used to design the Wiklind et al. (2007a, b) selection. However, we note that over the range of redshifts where the quasar host galaxy would be detectable in the GOODS and ISAAC data the simulated system resides in the locus of observed galaxies in the Wiklind et al. (2007a, b) sample in the –– color space. We also note that the Wiklind et al. (2007a, b) criteria are briefly satisfied by the galaxy at during the height of the quasar activity, but such bright sources can be discriminated from inactive high-redshift galaxies through spectroscopic observations.
5. Observability
The comparisons between the redshift-dependent photometric properties of massive quasar host galaxies and color selection criteria in §4.1-4.6 demonstrate that the SEDs of the most massive high-redshift galaxies likely satisfy a variety of existing photometric selection techniques. However, these high-redshift galaxies are extremely massive and therefore extraordinarily rare. To determine whether existing or future galaxy surveys would include such rare systems in their samples, the observability of these massive galaxies must be estimated. A straightforward quantification of the observability is to calculate the fractional sky coverage and flux limit required to include and detect some defined galaxy sample. Below, we use the evolution of the quasar host galaxy SED, the cosmological model, and Press & Schechter (1974) theory to estimate these quantities.
The comoving volume element of a spherical redshift shell of thickness at comoving distance and redshift can be written
| (18) |
where
| (19) |
is the speed of light, the redshift-dependent Hubble parameter for a flat universe is
| (20) |
and is the Hubble constant today. The number of galaxies in this comoving volume element is then simply , where is the redshift-dependent comoving number density of galaxies that comprise the sample. For the form of , we use the mass function proposed by Sheth & Tormen (1999) to extend the Press & Schechter (1974) theory of halo formation to model ellipsoidal collapse. Assuming an overdensity threshold for halo collapse, we can define the quantity that relates the root-mean-squared fluctuations on a mass scale , the linear growth factor
| (21) |
with normalized such that , and to describe the rarity of the density peak that collapsed to form the halo of mass . Here the constant was determined from cosmological N-body simulations by Sheth & Tormen (1999). In terms of the peak rarity , the comoving number density of galaxies above some given mass is then
| (22) | |||||
where the parameter is constrained such that and is determined from fitting to halo mass functions measured in cosmological simulations. If we choose to correspond to the redshift-dependent virial mass of a quasar host galaxy and assume that more massive halos will host brighter galaxies, then defines a luminosity-selected sample of very massive galaxies at redshift with comoving number density .
To calculate an actual number of galaxies, a redshift interval must be prescribed to define the comoving volume that hosts the sample as
| (23) |
For a given selection criterion, such as a Lyman-break dropout, will correspond to the redshift at which galaxy SEDs satisfy the color criteria. At the least massive galaxy in the sample will have a magnitude that corresponds to the brightest possible magnitude limit of a survey that could detect galaxies with mass . Typically, for dropout criteria this magnitude limit would apply to the redder of the two bands (e.g., -band for -dropouts). However, such a survey would have a very small comoving volume (since in this case) and it is desirable to improve the magnitude limit to increase the comoving volume of the survey. As the magnitude limit of the survey is improved to a new , increases to the epoch when galaxies with mass first became brighter than . For a given photometric selection which sets , and survey magnitude limit , the fractional sky coverage needed to detect galaxies with mass greater than at is
| (24) |
While this is conceptually straightforward, there are two immediate complications. First, the correspondence between the upper redshift limit and the magnitude limit depends on the redshift-dependent photometric properties of galaxies with mass . Second, galaxies with mass at epoch are evolving and will have some lower mass at higher redshifts. Fortunately, the calculations of the redshift-dependent galaxy SED described in §3 provide the desired correspondence. For the mass accretion history the merger-tree from the Li et al. (2006) simulation is box-car averaged with window width of . The resulting smooth mass accretion history increases rapidly from to owing to frequent mergers, and has a shape similar to the Wechsler et al. (2002) form for dark matter halo mass accretion histories. We note the observability calculation is insensitive to the exact shape of the mass accretion history as long as the rapid decline in virial mass at is reproduced.
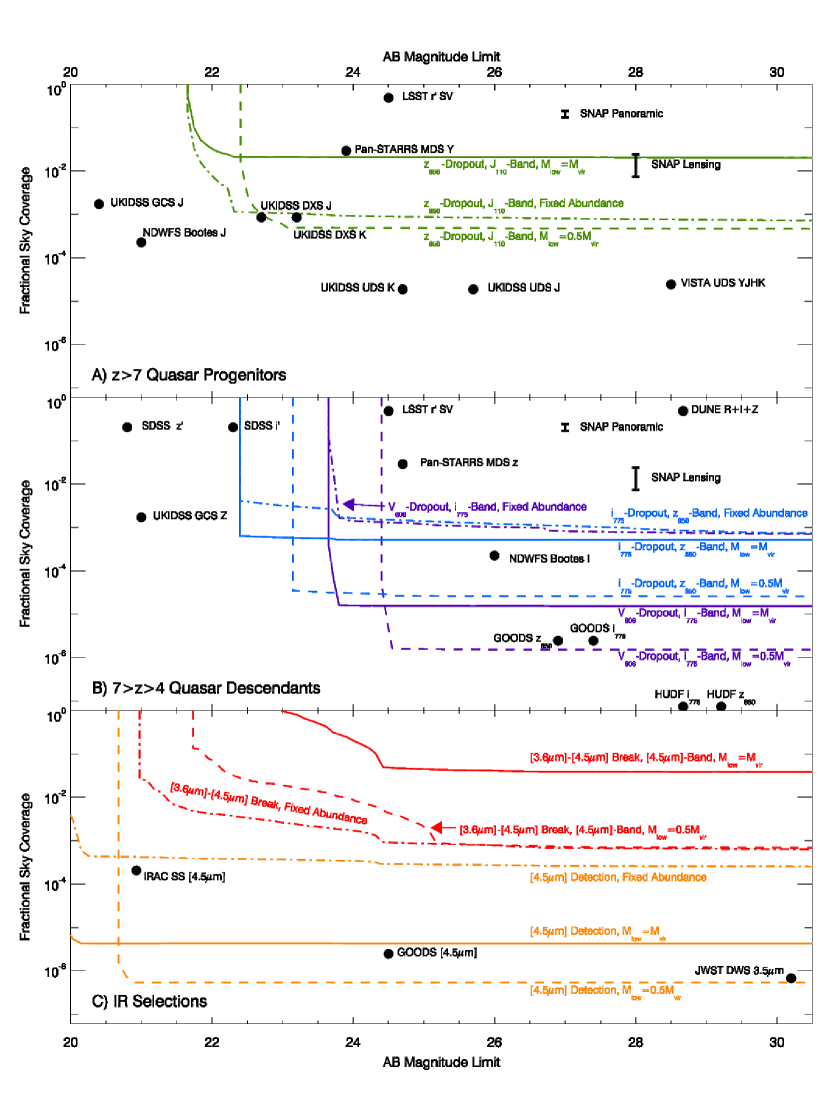
The relation between fractional sky coverage and survey limiting magnitude is plotted in Figure 11 for a variety of color selection criteria explored in 3, including -dropout (Eq. 4.1, ), -dropout (Eq. 7, ), -dropout (Eq. 4.4, ), and break () samples. For these color selection criteria, the quasar host galaxy virial mass in the Li et al. (2006) simulation increases from at to at . Beginning with the brightest possible magnitude limit, corresponding to the luminosity of -mass galaxies at , the necessary fractional sky coverage declines as the sample comoving volume increases with limiting magnitude until is reached. At larger (fainter) magnitudes, the fractional sky coverage becomes flat. The width of the transition region before the fractional sky coverage flattens is set by the redshift range over which the luminosity declines. For the -, -, and -dropout samples, IGM absorption sets to approximately the redshift when moves into the -, -, and -bands, respectively. The Lyman break is dramatic at such high redshifts and, when combined with the decrease in and with redshift, causes the fractional sky coverage to flatten quickly beyond the brightest limiting magnitude. The larger transition width for the -dropout selection relative to the bluer color selections is set by the comparably large bandwidth of the filter. For the -break selection, the fractional sky coverage artificially flattens at the -band magnitude of the system at (), where the simulation begins. Since these galaxies are bright ( to ), only a relatively small fractional sky coverage is needed to detect them. However, given the decline of and with redshift, such a sample would be dominated by systems at .
Given the rapid decline of the comoving number density with mass at fixed redshift, a useful comparison is the fractional sky coverage needed to observe systems that are less massive than the Li et al. (2006) simulated galaxy by a factor of . Figure 11 also shows the require fractional sky coverage for these systems, assuming their photometric evolution is similar to massive galaxies and their luminosity scales with their halo mass. Such systems are clearly more abundant than galaxies twice their mass. These systems would have stellar masses of , and SMBH masses , and could host quasars at . The virial mass of such galaxies is similar to that inferred from the clustering of quasars at in the 2dF, SDSS, and other surveys (Porciani et al., 2004; Porciani & Norberg, 2006; Wake et al., 2004; Croom et al., 2005; Coil et al., 2006; Shen et al., 2007) and measurements of the quasar proximity effect (Faucher-Giguere et al., 2007; Kim & Croft, 2007; Guimaraes et al., 2007), and are qualitatively similar to the system simulated by Li et al. (2006) and the large set of merger simulations performed by Robertson et al. (2006b). The detection of the host galaxies of such quasars in Lyman-break dropout or Balmer-break samples would also provide interesting insights into the formation of massive high-redshift galaxies (for a possible sample of such systems at , see Wiklind et al., 2007a, b).
For comparison, we also show the necessary sky coverage to find objects with an abundance fixed to the comoving number density () of halos with virial mass at if their luminosity evolution is similar to the simulated quasar host galaxy (Fig. 11, dashed-dotted lines). Correspondingly, such systems have an abundance similar to massive quasar host galaxies when they fall in -dropout samples. For higher-redshift selections, this estimate of the massive galaxy abundance is more favorable for finding the progenitors of quasars and is comparable to our abundance estimates.
The estimated survey parameters for finding high-redshift massive galaxies can be compared with the properties of existing and future photometric surveys to gauge the likelihood for the most massive high-redshift galaxies to be found in actual observational samples. The largest existing survey is the SDSS, which has magnitude limits of and (York et al., 2000) over 8452 666http://www.sdss.org/status/. While the SDSS has sufficient area to capture the most massive galaxies at redshifts as high as , the bright magnitude limits and lack of infrared coverage makes the detection of extremely massive high-redshift () galaxies in the SDSS implausible. Of course, as has been beautifully demonstrated, the rarer sub-population of massive galaxies in a bright quasar phase has been detected in the total SDSS area (e.g., Fan et al., 2003) as the remarkable luminosity of the quasar sample and the large sky coverage of the SDSS allows for the detection of tens of systems.
Compared with SDSS, deeper but smaller surveys have more advantageous parameters for finding Lyman-break dropouts at redshifts . For instance, the Boötes field of the National Optical Astronomy Observatory Wide Deep Field Survey (Jannuzi & Dey, 1999) has an 9.3 field with magnitude limits of and . While the -band coverage is likely too shallow to detect high-redshift quasar host galaxies, this area-magnitude combination should be sufficient to find the most massive galaxies at in -dropout samples. The accompanying IRAC Shallow Survey (Eisenhardt et al., 2004), with 8.5 coverage down to would detect these systems as well as higher-redshift -dropouts in the NOAO NWDFS (for galaxies with photometric redshifts , see Brodwin et al., 2006). The United Kingdom Infrared Telescope Deep Sky Survey (UKIDSS, Warren & Hewett, 2002; Warren et al., 2007) includes a Galaxy Cluster Survey (GCS, area to and ), a Deep Extragalactic Survey (DXS, area to and ), and an Ultradeep Survey (UDS, area to and , see Lawrence et al., 2006). While the UKIDSS GCS is too shallow to find the very massive galaxies we model, the UKIDSS DXS and UDS could detect such systems in the - and -bands at . The UKIDSS DXS may even have enough area to detect massive quasar progenitors at (see also Warren & Hewett, 2002), which would be an exciting prospect, but the lack of deep coverage at shorter wavelengths in the DXS may limit its ability to identify such systems as Lyman-break dropouts. A proposed UDS with the Visible and Infrared Survey Telescope for Astronomy (VISTA) could reach 5- AB limiting magnitudes of , , , and over a field (M. Franx, private communication). While the proposed VISTA observations would be significantly deeper than the UKDISS UDS or the NDWFS, the size of the field could limit the survey to finding quasar host galaxies at .
The GOODS observations that cover 365 arcmin2 reach depths of and with ACS (Giavalisco et al., 2004b) and with IRAC (Dickinson et al., 2003). The GOODS -dropout sample has the necessary sky coverage to include a stellar mass galaxy at with and detections in all redder bands, though we are not aware of any such systems in the current GOODS data. Less massive () systems are much more abundant and our estimate would predict a handful of such systems in GOODS, which may have already been detected (e.g., Stark et al., 2006). The HUDF data, with an 11 arcmin2 area and magnitude limits of and (Beckwith et al., 2006), is simply too narrow to include objects as rare as quasar host galaxies. We note briefly that these simulations suggest that to detect galaxies in -dropout samples at (e.g. Mobasher et al., 2005, see also Chen & Marzke (2004) and Dunlop et al. (2006)), a survey 3-4 orders of magnitude larger than the HUDF would be necessary.
Future surveys with wide area coverage and deep imaging have a substantially better opportunity to detect the starbursting progenitors of quasars. The Pan-STARRS project is planning a Medium Deep Survey with magnitude limits of and 777http://pan-starrs.ifa.hawaii.edu/, which could find massive quasar progenitors in -band dropout samples at . The Large Synoptic Survey Telescope would make short work of finding the most massive high-redshift galaxies if its -band Single Visit Depth is comparable to its target depth888http://www.lsst.org/Science/docs/SRD_summary.pdf. The Supernovae Acceleration Probe (SNAP) is planning a weak lensing survey of to and a wide-area () survey with a depth of 999http://snap.lbl.gov. If a near-IR HgCdTe device flies with the mission and reaches similar sensitivities down to over the same area, SNAP could detect the progenitors of quasars at redshifts approaching . The Dark Universe Explorer mission will survey with a composite -band in the red optical and will reach an effective limiting magnitude (Réfrégier et al., 2006), which should detect massive spheroids at . The James Webb Space Telescope easily has enough sensitivity to detect massive quasar progenitors out to (with stellar masses ), but currently suggested observations, such as a Deep-Wide Survey with a 100 arcmin2 area and limiting magnitude of at (Gardner et al., 2006), would be too narrow to find such rare objects at the highest redshifts.
6. Discussion
The discovery of very massive high-redshift galaxies would provide an interesting new perspective on the structure formation process. While the larger abundance of less-massive galaxies allow the redshift evolution of such systems to be researched by characterizing the statistical properties of populations of objects, the rarity of the most massive galaxies will likely limit our ability to draw inferences about their formation from population studies. If the most massive galaxies at the current epoch were a largely heterogeneous population, their rarity could prove a significant limitation in unravelling the various modes for their formation.
Fortunately, the most massive galaxies today are a roughly homogeneous population. Studies of the color bimodality of galaxies (e.g., Strateva et al., 2001; Bell et al., 2004; Baldry et al., 2004) show that the most luminous galaxies are almost uniformly red (). Such galaxies populate the center of galaxy clusters and their properties are roughly uniform between clusters at the same epoch (e.g., Bower et al., 1992; Gladders & Yee, 2000). Importantly, these massive galaxies have been demonstrated to contain supermassive black holes with mass (i.e. M87, Harms et al., 1994; Macchetto et al., 1997). The large SMBH masses directly connect the population of the most massive galaxies at low redshift to the luminous quasars at , since SMBHs are the most credible engine to power quasars, and suggest that the most luminous high-redshift quasars evolve into a roughly homogeneous population at the current epoch. Our calculations support this possibility, under the condition that the most massive galaxies undergo little star formation and their stellar populations evolve passively from to the present. Observed cluster ellipticals have stellar formation epochs of at least (e.g., van Dokkum & Franx, 2001; Gebhardt et al., 2003). We note that this picture does not preclude future major mergers between spheroids at lower redshifts (e.g., van Dokkum, 2005; Bell et al., 2006), which may have some relation to core-cusp bimodality (e.g., Faber et al., 1997; Lauer et al., 2006, Kormendy et al., in preparation, Krause et al., in preparation, though see Ferrarese et al. (2006)) that is the primary heterogeneity in massive galaxies. Even so, this bimodality exists primarily in systems with , with more luminous systems mostly displaying surface brightness cores.
The connection between the most massive galaxies in the present epoch and quasars at , forged by their shared SMBH masses, and the uniformity of the most massive local galaxies permits an argument for a single evolutionary scenario for the formation of the most massive galaxies from very high-redshifts to the present day. The appeal of a single mode of formation for the most massive galaxies stems primarily from the difficulty in forming luminous quasars at high-redshifts with SMBHs, the problem popularized by Efstathiou & Rees (1988). Finding a robust way of growing SMBHs quickly in the limited time available before is problematic, but the success of the Li et al. (2006) simulation of quasar in producing a SMBH with a mass of has provided some hope that high-redshift quasars can be explained naturally in the context of the formation of rare density peaks in our cosmology. The calculations performed in this paper provide a detailed characterization of the observable ramifications of this scenario, the foremost being the possible detection of the star-bursting progenitors of quasars at higher redshifts () with massive stellar populations () in wide-area, Lyman-break dropout samples or through wide-area IR searches for systems with rest-frame optical breaks at and stellar masses of .
7. Conclusions
Combining hydrodynamical simulations of the hierarchical formation of a quasar (Li et al., 2006), stellar population synthesis models (Leitherer et al., 1999; Vázquez & Leitherer, 2005), AGN spectral templates (Vanden Berk et al., 2001; Marconi et al., 2004), models for the wavelength-dependent attenuation owing to interstellar and intergalactic absorption (Calzetti et al., 1994, 2000; Madau, 1995), and the transmissivity of telescopes, filters, and detectors, the photometric properties of a massive quasar host galaxy are calculated at redshifts . The photometric properties of the quasar host galaxy reflect three main evolutionary phases in its formation; a starburst-dominated phase at , an AGN phase at that includes optical quasar activity at , and a passive-evolution phase at . The photometric properties of the system are then compared with color-selection techniques for finding high-redshift galaxies. The main findings of these calculations follow.
-
•
At very high-redshifts , multiple gas-rich mergers gives rise to star formation rates of , building a stellar spheroid of by (Li et al., 2006). Our calculations show that these star formation rates naturally give rise to a photometric starburst phase with strong rest-frame UV and blue optical emission that satisfy HST ACS/NICMOS Lyman-break criteria for galaxies at (e.g. Bouwens et al., 2004; Bouwens & Illingworth, 2006). Over this epoch, the near-infrared luminosity of the system peaks at with , , and in AB magnitudes.
-
•
During the phase of AGN activity (), IGM absorption blue-ward of causes the system to satisfy both -band dropout criteria for LBGs in GOODS (e.g. Stanway et al., 2003; Giavalisco et al., 2004a) and the SDSS -band dropout selection for high-redshift quasars (e.g. Fan et al., 2003). At higher redshifts IGM absorption begins to attenuate the -band flux and push the quasar host galaxy towards the locus of L-dwarfs in the vs. color-color space. During this phase, the quasar host galaxy is usually -band magnitudes fainter than the Fan et al. (2003) sample selection flux limit.
-
•
At lower redshifts () after the starburst and AGN activity has declined, the quasar host galaxy satisfies -dropout criteria for galaxies at (e.g., Giavalisco et al., 2004b; Yan et al., 2005). The quasar descendant also satisfies Balmer break selection techniques designed to identify massive and evolved galaxies at (e.g., Wiklind et al., 2007a, b).
- •
-
•
The area and depth necessary to find the most massive high-redshift galaxies in photometric surveys is estimated from our photometric modeling and the redshift-dependent abundance of dark matter halos (Press & Schechter, 1974; Sheth & Tormen, 1999). Existing surveys, such as the IRAC Shallow Survey or NOAO Deep-Wide Field Survey, may be large enough to find the massive descendants of quasars. Surveys of significant fractions of the sky () in the and or similar bands, such as the UKIRT Deep Sky Survey, will be necessary to find the starbursting progenitors of at high-redshifts (). Future surveys, such as Pan-STARRS, the Large Synoptic Survey Telescope, or the Supernovae Acceleration Probe, should have the necessary area and depth to find the most massive high-redshift galaxies.
-
•
If future surveys contain a -dropout massive quasar progenitor at , evidence for star formation at in the form of a Balmer/4000Å break could be detected in the vs. color-color space.
The remarkable luminosity and early-formation time of the massive progenitor galaxies of quasars could enable their detection at very high-redshifts . The detection of these massive galaxies would help settle outstanding questions about how the rarest structures form in the cosmology and what evolutionary processes give rise to quasars. As observations must ultimately determine the existence and properties of the most massive high-redshift galaxies, we eagerly anticipate future efforts to detect and characterize these extraordinary quasar progenitors.
References
- Abel et al. (2002) Abel, T., Bryan, G. L., & Norman, M. L. 2002, Science, 295, 93
- Baldry et al. (2004) Baldry, I. K., Glazebrook, K., Brinkmann, J., Ivezić, Ž., Lupton, R. H., Nichol, R. C., & Szalay, A. S. 2004, ApJ, 600, 681
- Barmby et al. (2004) Barmby, P., et al. 2004, ApJS, 154, 97
- Barnes & Hernquist (1996) Barnes, J. E., & Hernquist, L. 1996, ApJ, 471, 115
- Barnes & Hernquist (1991) Barnes, J. E., & Hernquist, L. E. 1991, ApJ, 370, L65
- Barth et al. (2003) Barth, A. J., Ho, L. C., & Sargent, W. L. W. 2003, ApJ, 583, 134
- Barton et al. (2004) Barton, E. J., Davé, R., Smith, J.-D. T., Papovich, C., Hernquist, L., & Springel, V. 2004, ApJ, 604, L1
- Baugh et al. (1998) Baugh, C. M., Cole, S., Frenk, C. S., & Lacey, C. G. 1998, ApJ, 498, 504
- Beckwith et al. (2006) Beckwith, S. V. W., et al. 2006, AJ, 132, 1729
- Bell et al. (2006) Bell, E. F., et al. 2006, ApJ, 640, 241
- Bell et al. (2004) —. 2004, ApJ, 608, 752
- Bershady et al. (1999) Bershady, M. A., Charlton, J. C., & Geoffroy, J. M. 1999, ApJ, 518, 103
- Bertoldi et al. (2003) Bertoldi, F., Carilli, C. L., Cox, P., Fan, X., Strauss, M. A., Beelen, A., Omont, A., & Zylka, R. 2003, A&A, 406, L55
- Bohlin et al. (1978) Bohlin, R. C., Savage, B. D., & Drake, J. F. 1978, ApJ, 224, 132
- Bondi (1952) Bondi, H. 1952, MNRAS, 112, 195
- Bouwens & Illingworth (2006) Bouwens, R. J., & Illingworth, G. D. 2006, Nature, 443, 189
- Bouwens et al. (2003) Bouwens, R. J., et al. 2003, ApJ, 595, 589
- Bouwens et al. (2004) —. 2004, ApJ, 616, L79
- Bower et al. (1992) Bower, R. G., Lucey, J. R., & Ellis, R. S. 1992, MNRAS, 254, 601
- Bremer et al. (2004) Bremer, M. N., Jensen, J. B., Lehnert, M. D., Schreiber, N. M. F., & Douglas, L. 2004, ApJ, 615, L1
- Brodwin et al. (2006) Brodwin, M., et al. 2006, ApJ, 651, 791
- Bromm & Larson (2004) Bromm, V., & Larson, R. B. 2004, ARA&A, 42, 79
- Bullock et al. (2001) Bullock, J. S., Kolatt, T. S., Sigad, Y., Somerville, R. S., Kravtsov, A. V., Klypin, A. A., Primack, J. R., & Dekel, A. 2001, MNRAS, 321, 559
- Bunker et al. (2004) Bunker, A. J., Stanway, E. R., Ellis, R. S., & McMahon, R. G. 2004, MNRAS, 355, 374
- Bunker et al. (2003) Bunker, A. J., Stanway, E. R., Ellis, R. S., McMahon, R. G., & McCarthy, P. J. 2003, MNRAS, 342, L47
- Calzetti (1997) Calzetti, D. 1997, AJ, 113, 162
- Calzetti et al. (2000) Calzetti, D., Armus, L., Bohlin, R. C., Kinney, A. L., Koornneef, J., & Storchi-Bergmann, T. 2000, ApJ, 533, 682
- Calzetti et al. (1994) Calzetti, D., Kinney, A. L., & Storchi-Bergmann, T. 1994, ApJ, 429, 582
- Cardelli et al. (1989) Cardelli, J. A., Clayton, G. C., & Mathis, J. S. 1989, ApJ, 345, 245
- Carilli et al. (2004) Carilli, C. L., et al. 2004, AJ, 128, 997
- Chary et al. (2005) Chary, R.-R., Stern, D., & Eisenhardt, P. 2005, ApJ, 635, L5
- Chen & Marzke (2004) Chen, H.-W., & Marzke, R. O. 2004, ApJ, 615, 603
- Cohen et al. (2003) Cohen, M., Wheaton, W. A., & Megeath, S. T. 2003, AJ, 126, 1090
- Coil et al. (2006) Coil, A. L., Newman, J. A., Cooper, M. C., Davis, M., Faber, S. M., Koo, D. C., & Willmer, C. N. A. 2006, ApJ, 644, 671
- Cowie & Hu (1998) Cowie, L. L., & Hu, E. M. 1998, AJ, 115, 1319
- Cox (2000) Cox, A. N. 2000, Allen’s astrophysical quantities (Allen’s astrophysical quantities, 4th ed. Publisher: New York: AIP Press; Springer, 2000. Editedy by Arthur N. Cox. ISBN: 0387987460)
- Cox et al. (2006a) Cox, T. J., Di Matteo, T., Hernquist, L., Hopkins, P. F., Robertson, B., & Springel, V. 2006a, ApJ, 643, 692
- Cox et al. (2006b) Cox, T. J., Dutta, S. N., Di Matteo, T., Hernquist, L., Hopkins, P. F., Robertson, B., & Springel, V. 2006b, ApJ, 650, 791
- Croom et al. (2005) Croom, S. M., et al. 2005, MNRAS, 356, 415
- Daddi et al. (2003) Daddi, E., et al. 2003, ApJ, 588, 50
- Davé et al. (2006) Davé, R., Finlator, K., & Oppenheimer, B. D. 2006, MNRAS, 370, 273
- Davé et al. (1999) Davé, R., Hernquist, L., Katz, N., & Weinberg, D. H. 1999, ApJ, 511, 521
- Di Matteo et al. (2005) Di Matteo, T., Springel, V., & Hernquist, L. 2005, Nature, 433, 604
- Dickinson et al. (2003) Dickinson, M., Giavalisco, M., & The Goods Team. 2003, in The Mass of Galaxies at Low and High Redshift, ed. R. Bender & A. Renzini, 324–+
- Dickinson et al. (2004) Dickinson, M., et al. 2004, ApJ, 600, L99
- Dunlop et al. (2006) Dunlop, J. S., Cirasuolo, M., & McLure, R. J. 2006, ArXiv Astrophysics e-prints
- Efstathiou & Rees (1988) Efstathiou, G., & Rees, M. J. 1988, MNRAS, 230, 5P
- Egami et al. (2005) Egami, E., et al. 2005, ApJ, 618, L5
- Eisenhardt et al. (2004) Eisenhardt, P. R., et al. 2004, ApJS, 154, 48
- Ellis et al. (2001) Ellis, R., Santos, M. R., Kneib, J.-P., & Kuijken, K. 2001, ApJ, 560, L119
- Eyles et al. (2006) Eyles, L., Bunker, A., Ellis, R., Lacy, M., Stanway, E., Stark, D., & Chiu, K. 2006, ArXiv Astrophysics e-prints
- Eyles et al. (2005) Eyles, L. P., Bunker, A. J., Stanway, E. R., Lacy, M., Ellis, R. S., & Doherty, M. 2005, MNRAS, 364, 443
- Faber et al. (1997) Faber, S. M., et al. 1997, AJ, 114, 1771
- Fabian (1999) Fabian, A. C. 1999, MNRAS, 308, L39
- Fagotto et al. (1994) Fagotto, F., Bressan, A., Bertelli, G., & Chiosi, C. 1994, A&AS, 105, 29
- Fan et al. (2004) Fan, X., et al. 2004, AJ, 128, 515
- Fan et al. (2001a) —. 2001a, AJ, 122, 2833
- Fan et al. (2006) —. 2006, AJ, 131, 1203
- Fan et al. (2001b) —. 2001b, AJ, 121, 31
- Fan et al. (2003) —. 2003, AJ, 125, 1649
- Fan et al. (2000) —. 2000, AJ, 120, 1167
- Faucher-Giguere et al. (2007) Faucher-Giguere, C.-A., Lidz, A., Zaldarraiga, M., & Hernquist, L. 2007, ArXiv Astrophysics e-prints
- Fazio et al. (2004) Fazio, G. G., et al. 2004, ApJS, 154, 10
- Ferrarese et al. (2006) Ferrarese, L., et al. 2006, ApJS, 164, 334
- Ferrarese & Merritt (2000) Ferrarese, L., & Merritt, D. 2000, ApJ, 539, L9
- Finlator et al. (2006) Finlator, K., Davé, R., Papovich, C., & Hernquist, L. 2006, ApJ, 639, 672
- Fitzpatrick (1986) Fitzpatrick, E. L. 1986, AJ, 92, 1068
- Ford et al. (1998) Ford, H. C., et al. 1998, in Proc. SPIE Vol. 3356, p. 234-248, Space Telescopes and Instruments V, ed. P. Y. Bely & J. B. Breckinridge
- Franx et al. (2003) Franx, M., et al. 2003, ApJ, 587, L79
- Fukugita et al. (1996) Fukugita, M., Ichikawa, T., Gunn, J. E., Doi, M., Shimasaku, K., & Schneider, D. P. 1996, AJ, 111, 1748
- Gao et al. (2005) Gao, L., White, S. D. M., Jenkins, A., Frenk, C. S., & Springel, V. 2005, MNRAS, 363, 379
- Gardner et al. (2006) Gardner, J. P., et al. 2006, Space Science Reviews, 123, 485
- Gebhardt et al. (2000) Gebhardt, K., et al. 2000, ApJ, 539, L13
- Gebhardt et al. (2003) —. 2003, ApJ, 597, 239
- Genzel et al. (1998) Genzel, R., et al. 1998, ApJ, 498, 579
- Giavalisco et al. (2004a) Giavalisco, M., et al. 2004a, ApJ, 600, L103
- Giavalisco et al. (2004b) —. 2004b, ApJ, 600, L93
- Gladders & Yee (2000) Gladders, M. D., & Yee, H. K. C. 2000, AJ, 120, 2148
- Gordon et al. (2003) Gordon, K. D., Clayton, G. C., Misselt, K. A., Landolt, A. U., & Wolff, M. J. 2003, ApJ, 594, 279
- Granato et al. (2004) Granato, G. L., De Zotti, G., Silva, L., Bressan, A., & Danese, L. 2004, ApJ, 600, 580
- Grazian et al. (2006) Grazian, A., et al. 2006, A&A, 449, 951
- Guimaraes et al. (2007) Guimaraes, R. N., Petitjean, P., Rolline, E. B., De Carvalho, R. R., Djorgovski, G., Srianand, R., Aghaee, A., & Castro, S. 2007, ArXiv Astrophysics e-prints
- Harford & Gnedin (2003) Harford, A. G., & Gnedin, N. Y. 2003, ApJ, 597, 74
- Häring & Rix (2004) Häring, N., & Rix, H.-W. 2004, ApJ, 604, L89
- Harms et al. (1994) Harms, R. J., et al. 1994, ApJ, 435, L35
- Hernquist (1989) Hernquist, L. 1989, Nature, 340, 687
- Hopkins et al. (2006a) Hopkins, P. F., Hernquist, L., Cox, T. J., Di Matteo, T., Robertson, B., & Springel, V. 2006a, ApJS, 163, 1
- Hopkins et al. (2007a) Hopkins, P. F., Hernquist, L., Cox, T. J., Robertson, B., & Krause, E. 2007a, ArXiv Astrophysics e-prints
- Hopkins et al. (2006b) Hopkins, P. F., Hernquist, L., Cox, T. J., Robertson, B., & Springel, V. 2006b, ApJS, 163, 50
- Hopkins et al. (2005) Hopkins, P. F., Hernquist, L., Martini, P., Cox, T. J., Robertson, B., Di Matteo, T., & Springel, V. 2005, ApJ, 625, L71
- Hopkins et al. (2006c) Hopkins, P. F., Lidz, A., Hernquist, L., Coil, A. L., Myers, A. D., Cox, T. J., & Spergel, D. N. 2006c, ArXiv Astrophysics e-prints
- Hopkins et al. (2007b) Hopkins, P. F., Richards, G. T., & Hernquist, L. 2007b, ApJ, 654, 731
- Hu & Cowie (2006) Hu, E. M., & Cowie, L. L. 2006, Nature, 440, 1145
- Hu et al. (2002) Hu, E. M., Cowie, L. L., McMahon, R. G., Capak, P., Iwamuro, F., Kneib, J.-P., Maihara, T., & Motohara, K. 2002, ApJ, 568, L75
- Irwin et al. (1991) Irwin, M., McMahon, R. G., & Hazard, C. 1991, in ASP Conf. Ser. 21: The Space Distribution of Quasars, ed. D. Crampton, 117–126
- Iye et al. (2006) Iye, M., et al. 2006, Nature, 443, 186
- Jannuzi & Dey (1999) Jannuzi, B. T., & Dey, A. 1999, in ASP Conf. Ser. 191: Photometric Redshifts and the Detection of High Redshift Galaxies, ed. R. Weymann, L. Storrie-Lombardi, M. Sawicki, & R. Brunner, 111–+
- Kashikawa et al. (2006) Kashikawa, N., et al. 2006, ApJ, 648, 7
- Katz et al. (1992) Katz, N., Hernquist, L., & Weinberg, D. H. 1992, ApJ, 399, L109
- Kauffmann et al. (1999) Kauffmann, G., Colberg, J. M., Diaferio, A., & White, S. D. M. 1999, MNRAS, 303, 188
- Kauffmann & Haehnelt (2000) Kauffmann, G., & Haehnelt, M. 2000, MNRAS, 311, 576
- Kennicutt (1998) Kennicutt, R. C. 1998, ApJ, 498, 541
- Kim & Croft (2007) Kim, Y.-R., & Croft, R. 2007, ArXiv Astrophysics e-prints
- King (2003) King, A. 2003, ApJ, 596, L27
- Kodaira et al. (2003) Kodaira, K., et al. 2003, PASJ, 55, L17
- Koester et al. (2007) Koester, B. P., et al. 2007, ArXiv Astrophysics e-prints
- Kormendy & Richstone (1995) Kormendy, J., & Richstone, D. 1995, ARA&A, 33, 581
- Kroupa (2001) Kroupa, P. 2001, MNRAS, 322, 231
- Kroupa (2002) —. 2002, Science, 295, 82
- Kurk et al. (2004) Kurk, J. D., Cimatti, A., di Serego Alighieri, S., Vernet, J., Daddi, E., Ferrara, A., & Ciardi, B. 2004, A&A, 422, L13
- Labbé et al. (2006) Labbé, I., Bouwens, R., Illingworth, G. D., & Franx, M. 2006, ApJ, 649, L67
- Labbé et al. (2005) Labbé, I., et al. 2005, ApJ, 624, L81
- Lanzetta et al. (1996) Lanzetta, K. M., Yahil, A., & Fernandez-Soto, A. 1996, Nature, 381, 759
- Larson & Tinsley (1978) Larson, R. B., & Tinsley, B. M. 1978, ApJ, 219, 46
- Lauer et al. (2006) Lauer, T. R., et al. 2006, ArXiv Astrophysics e-prints
- Lawrence et al. (2006) Lawrence, A., et al. 2006, ArXiv Astrophysics e-prints
- Lee et al. (2006) Lee, K.-S., Giavalisco, M., Gnedin, O. Y., Somerville, R. S., Ferguson, H. C., Dickinson, M., & Ouchi, M. 2006, ApJ, 642, 63
- Lehnert & Bremer (2003) Lehnert, M. D., & Bremer, M. 2003, ApJ, 593, 630
- Leitherer et al. (1999) Leitherer, C., et al. 1999, ApJS, 123, 3
- Li et al. (2006) Li, Y., et al. 2006, ArXiv Astrophysics e-prints
- Lynden-Bell (1969) Lynden-Bell, D. 1969, Nature, 223, 690
- Macchetto et al. (1997) Macchetto, F., Marconi, A., Axon, D. J., Capetti, A., Sparks, W., & Crane, P. 1997, ApJ, 489, 579
- Madau (1995) Madau, P. 1995, ApJ, 441, 18
- Madau et al. (1996) Madau, P., Ferguson, H. C., Dickinson, M. E., Giavalisco, M., Steidel, C. C., & Fruchter, A. 1996, MNRAS, 283, 1388
- Magdziarz & Zdziarski (1995) Magdziarz, P., & Zdziarski, A. A. 1995, MNRAS, 273, 837
- Magorrian et al. (1998) Magorrian, J., et al. 1998, AJ, 115, 2285
- Maiolino et al. (2004) Maiolino, R., Schneider, R., Oliva, E., Bianchi, S., Ferrara, A., Mannucci, F., Pedani, M., & Roca Sogorb, M. 2004, Nature, 431, 533
- Marconi et al. (2003) Marconi, A., et al. 2003, ApJ, 586, 868
- Marconi et al. (2004) Marconi, A., Risaliti, G., Gilli, R., Hunt, L. K., Maiolino, R., & Salvati, M. 2004, MNRAS, 351, 169
- McKee & Ostriker (1977) McKee, C. F., & Ostriker, J. P. 1977, ApJ, 218, 148
- Mihos & Hernquist (1994) Mihos, J. C., & Hernquist, L. 1994, ApJ, 431, L9
- Mihos & Hernquist (1996) —. 1996, ApJ, 464, 641
- Mo et al. (1998) Mo, H. J., Mao, S., & White, S. D. M. 1998, MNRAS, 295, 319
- Mobasher et al. (2005) Mobasher, B., et al. 2005, ApJ, 635, 832
- Nagamine et al. (2006) Nagamine, K., Cen, R., Furlanetto, S. R., Hernquist, L., Night, C., Ostriker, J. P., & Ouchi, M. 2006, New Astronomy Review, 50, 29
- Nagamine et al. (2005a) Nagamine, K., Cen, R., Hernquist, L., Ostriker, J. P., & Springel, V. 2005a, ApJ, 627, 608
- Nagamine et al. (2005b) —. 2005b, ApJ, 618, 23
- Nagamine et al. (2004) Nagamine, K., Springel, V., & Hernquist, L. 2004, MNRAS, 348, 421
- Narayanan et al. (2006) Narayanan, D., et al. 2006, ApJ, Submitted
- Night et al. (2006) Night, C., Nagamine, K., Springel, V., & Hernquist, L. 2006, MNRAS, 366, 705
- Noguchi (1988) Noguchi, M. 1988, A&A, 203, 259
- Oke (1974) Oke, J. B. 1974, ApJS, 27, 21
- Ouchi et al. (2005) Ouchi, M., et al. 2005, ApJ, 620, L1
- Ouchi et al. (2004) —. 2004, ApJ, 611, 660
- Overzier et al. (2006) Overzier, R. A., Bouwens, R. J., Illingworth, G. D., & Franx, M. 2006, ArXiv Astrophysics e-prints
- Papovich et al. (2001) Papovich, C., Dickinson, M., & Ferguson, H. C. 2001, ApJ, 559, 620
- Papovich et al. (2006) Papovich, C., et al. 2006, ApJ, 640, 92
- Pei (1992) Pei, Y. C. 1992, ApJ, 395, 130
- Porciani et al. (2004) Porciani, C., Magliocchetti, M., & Norberg, P. 2004, MNRAS, 355, 1010
- Porciani & Norberg (2006) Porciani, C., & Norberg, P. 2006, MNRAS, 371, 1824
- Power et al. (2003) Power, C., Navarro, J. F., Jenkins, A., Frenk, C. S., White, S. D. M., Springel, V., Stadel, J., & Quinn, T. 2003, MNRAS, 338, 14
- Press & Schechter (1974) Press, W. H., & Schechter, P. 1974, ApJ, 187, 425
- Reddy & Steidel (2004) Reddy, N. A., & Steidel, C. C. 2004, ApJ, 603, L13
- Reddy et al. (2006) Reddy, N. A., Steidel, C. C., Erb, D. K., Shapley, A. E., & Pettini, M. 2006, ArXiv Astrophysics e-prints
- Réfrégier et al. (2006) Réfrégier, A., et al. 2006, in Proc. SPIE Vol. 6265, p. 62651Y, Space Telescopes and Instrumentation I, ed. J. C. Mather, H. A. MacEwen & M. W. M. de Graauw
- Richard et al. (2006) Richard, J., Pello, R., Schaerer, D., Le Borgne, J.-F., & Kneib, J.-P. 2006, ArXiv Astrophysics e-prints
- Robertson et al. (2006a) Robertson, B., Cox, T. J., Hernquist, L., Franx, M., Hopkins, P. F., Martini, P., & Springel, V. 2006a, ApJ, 641, 21
- Robertson et al. (2006b) Robertson, B., Hernquist, L., Cox, T. J., Di Matteo, T., Hopkins, P. F., Martini, P., & Springel, V. 2006b, ApJ, 641, 90
- Rodrigues et al. (1997) Rodrigues, C. V., Magalhaes, A. M., Coyne, G. V., & Piirola, V. 1997, ApJ, 485, 618
- Salpeter (1955) Salpeter, E. E. 1955, ApJ, 121, 161
- Sanders & Mirabel (1996) Sanders, D. B., & Mirabel, I. F. 1996, ARA&A, 34, 749
- Sanders et al. (1988a) Sanders, D. B., Soifer, B. T., Elias, J. H., Madore, B. F., Matthews, K., Neugebauer, G., & Scoville, N. Z. 1988a, ApJ, 325, 74
- Sanders et al. (1988b) Sanders, D. B., Soifer, B. T., Elias, J. H., Neugebauer, G., & Matthews, K. 1988b, ApJ, 328, L35
- Santos (2004) Santos, M. R. 2004, MNRAS, 349, 1137
- Schmidt (1959) Schmidt, M. 1959, ApJ, 129, 243
- Schneider et al. (2001) Schneider, D. P., et al. 2001, AJ, 121, 1232
- Schneider et al. (1991) Schneider, D. P., Schmidt, M., & Gunn, J. E. 1991, AJ, 101, 2004
- Shapley et al. (2005) Shapley, A. E., Steidel, C. C., Erb, D. K., Reddy, N. A., Adelberger, K. L., Pettini, M., Barmby, P., & Huang, J. 2005, ApJ, 626, 698
- Shen et al. (2007) Shen, Y., et al. 2007, ArXiv Astrophysics e-prints
- Sheth & Tormen (1999) Sheth, R. K., & Tormen, G. 1999, MNRAS, 308, 119
- Silk & Rees (1998) Silk, J., & Rees, M. J. 1998, A&A, 331, L1
- Skrutskie et al. (1997) Skrutskie, M. F., et al. 1997, in ASSL Vol. 210: The Impact of Large Scale Near-IR Sky Surveys, ed. F. Garzon, N. Epchtein, A. Omont, B. Burton, & P. Persi, 25–+
- Soifer et al. (1984) Soifer, B. T., et al. 1984, ApJ, 278, L71
- Soifer et al. (1987) Soifer, B. T., Sanders, D. B., Madore, B. F., Neugebauer, G., Danielson, G. E., Elias, J. H., Lonsdale, C. J., & Rice, W. L. 1987, ApJ, 320, 238
- Somerville et al. (2001) Somerville, R. S., Primack, J. R., & Faber, S. M. 2001, MNRAS, 320, 504
- Spergel et al. (2003) Spergel, D. N., et al. 2003, ApJS, 148, 175
- Spinrad et al. (1998) Spinrad, H., Stern, D., Bunker, A., Dey, A., Lanzetta, K., Yahil, A., Pascarelle, S., & Fernández-Soto, A. 1998, AJ, 116, 2617
- Springel (2005) Springel, V. 2005, MNRAS, 364, 1105
- Springel et al. (2005a) Springel, V., Di Matteo, T., & Hernquist, L. 2005a, ApJ, 620, L79
- Springel et al. (2005b) —. 2005b, MNRAS, 361, 776
- Springel & Hernquist (2003) Springel, V., & Hernquist, L. 2003, MNRAS, 339, 289
- Stanway et al. (2003) Stanway, E. R., Bunker, A. J., & McMahon, R. G. 2003, MNRAS, 342, 439
- Stanway et al. (2004a) Stanway, E. R., Bunker, A. J., McMahon, R. G., Ellis, R. S., Treu, T., & McCarthy, P. J. 2004a, ApJ, 607, 704
- Stanway et al. (2004b) Stanway, E. R., et al. 2004b, ApJ, 604, L13
- Stanway et al. (2005) Stanway, E. R., McMahon, R. G., & Bunker, A. J. 2005, MNRAS, 359, 1184
- Stark et al. (2006) Stark, D. P., Bunker, A. J., Ellis, R. S., Eyles, L. P., & Lacy, M. 2006, ArXiv Astrophysics e-prints
- Steidel et al. (1995) Steidel, C. C., Pettini, M., & Hamilton, D. 1995, AJ, 110, 2519
- Steidel et al. (1996) Steidel, C. C., Giavalisco, M., Pettini, M., Dickinson, M., & Adelberger, K. L. 1996, ApJ, 462, L17+
- Steidel & Hamilton (1992) Steidel, C. C., & Hamilton, D. 1992, AJ, 104, 941
- Steidel & Hamilton (1993) —. 1993, AJ, 105, 2017
- Stern et al. (2005a) Stern, D., et al. 2005a, ApJ, 631, 163
- Stern et al. (2005b) Stern, D., Yost, S. A., Eckart, M. E., Harrison, F. A., Helfand, D. J., Djorgovski, S. G., Malhotra, S., & Rhoads, J. E. 2005b, ApJ, 619, 12
- Stiavelli et al. (2004) Stiavelli, M., Fall, S. M., & Panagia, N. 2004, ApJ, 610, L1
- Strateva et al. (2001) Strateva, I., et al. 2001, AJ, 122, 1861
- Taniguchi et al. (2005) Taniguchi, Y., et al. 2005, PASJ, 57, 165
- Telfer et al. (2002) Telfer, R. C., Zheng, W., Kriss, G. A., & Davidsen, A. F. 2002, ApJ, 565, 773
- Thompson et al. (2005) Thompson, R. I., et al. 2005, AJ, 130, 1
- Toomre (1977) Toomre, A. 1977, in Evolution of Galaxies and Stellar Populations, 401–+
- Toomre & Toomre (1972) Toomre, A., & Toomre, J. 1972, ApJ, 178, 623
- Tremaine et al. (2002) Tremaine, S., et al. 2002, ApJ, 574, 740
- van Dokkum (2005) van Dokkum, P. G. 2005, AJ, 130, 2647
- van Dokkum & Franx (2001) van Dokkum, P. G., & Franx, M. 2001, ApJ, 553, 90
- van Dokkum et al. (2004) van Dokkum, P. G., et al. 2004, ApJ, 611, 703
- Vanden Berk et al. (2001) Vanden Berk, D. E., et al. 2001, AJ, 122, 549
- Vanzella et al. (2006) Vanzella, E., et al. 2006, A&A, 454, 423
- Vázquez & Leitherer (2005) Vázquez, G. A., & Leitherer, C. 2005, ApJ, 621, 695
- Verma et al. (2007) Verma, A., Lehnert, M. D., Foerster Schreiber, N. M., Bremer, M. N., & Douglas, L. 2007, ArXiv Astrophysics e-prints
- Vignali et al. (2003) Vignali, C., Brandt, W. N., & Schneider, D. P. 2003, AJ, 125, 433
- Volonteri et al. (2003) Volonteri, M., Haardt, F., & Madau, P. 2003, ApJ, 582, 559
- Wake et al. (2004) Wake, D. A., et al. 2004, ApJ, 610, L85
- Walter et al. (2003) Walter, F., et al. 2003, Nature, 424, 406
- Walter et al. (2004) Walter, F., Carilli, C., Bertoldi, F., Menten, K., Cox, P., Lo, K. Y., Fan, X., & Strauss, M. A. 2004, ApJ, 615, L17
- Warren & Hewett (2002) Warren, S., & Hewett, P. 2002, in ASP Conf. Ser. 283: A New Era in Cosmology, ed. N. Metcalfe & T. Shanks, 369–+
- Warren et al. (2007) Warren, S. J., et al. 2007, MNRAS, 375, 213
- Warren et al. (1987) Warren, S. J., Hewett, P. C., Irwin, M. J., McMahon, R. G., & Bridgeland, M. T. 1987, Nature, 325, 131
- Wechsler et al. (2002) Wechsler, R. H., Bullock, J. S., Primack, J. R., Kravtsov, A. V., & Dekel, A. 2002, ApJ, 568, 52
- Weinberg et al. (2002) Weinberg, D. H., Hernquist, L., & Katz, N. 2002, ApJ, 571, 15
- Werner et al. (2004) Werner, M. W., et al. 2004, ApJS, 154, 1
- Wiklind et al. (2007a) Wiklind, T., Mobasher, B., Dickinson, M., Ferguson, H. C., Giavalisco, M., Grogin, N. A., & Panagia, N. 2007a, IAU Symposium, 235, 368
- Wiklind et al. (2007b) Wiklind, T., Dickinson, M., Ferguson, H. C., Giavalisco, M., Mobasher, B., Grogin, N. A., & Panagia, N. 2007b, ApJ, submitted.
- Williams et al. (1996) Williams, R. E., et al. 1996, AJ, 112, 1335
- Willott et al. (2003) Willott, C. J., Rawlings, S., Jarvis, M. J., & Blundell, K. M. 2003, MNRAS, 339, 173
- Wyithe & Loeb (2003) Wyithe, J. S. B., & Loeb, A. 2003, ApJ, 595, 614
- Yan et al. (2004) Yan, H., et al. 2004, ApJ, 616, 63
- Yan et al. (2006) Yan, H., Dickinson, M., Giavalisco, M., Stern, D., Eisenhardt, P. R. M., & Ferguson, H. C. 2006, ApJ, 651, 24
- Yan et al. (2005) Yan, H., et al. 2005, ApJ, 634, 109
- Yan & Windhorst (2004) Yan, H., & Windhorst, R. A. 2004, ApJ, 612, L93
- Yan et al. (2003) Yan, H., Windhorst, R. A., & Cohen, S. H. 2003, ApJ, 585, L93
- York et al. (2000) York, D. G., et al. 2000, AJ, 120, 1579
- Yoshida et al. (2003) Yoshida, N., Abel, T., Hernquist, L., & Sugiyama, N. 2003, ApJ, 592, 645
- Yoshida et al. (2006) Yoshida, N., Omukai, K., Hernquist, L., & Abel, T. 2006, ApJ, 652, 6
- Young et al. (1986) Young, J. S., Schloerb, F. P., Kenney, J. D., & Lord, S. D. 1986, ApJ, 304, 443
- Zamorani et al. (1981) Zamorani, G., et al. 1981, ApJ, 245, 357