The Origin of the soft excess in AGN
Abstract
We discuss various ideas for the origin of the soft X–ray excess seen in AGN. There are clear advantages to models where this arises from atomic processes in partially ionised rather than where it is a true continuum component. However, current data cannot distinguish between models where this material is seen in reflection or absorption. While higher energy data may break the degeneracies, we also suggest that strong outflows are extremely likely to be present, lending more physical plausibility to an absorption origin. This more messy picture of NLS1’s means that they are probably not good places to test GR, but they do give insight into the spectra expected from the first QSO’s in the early Universe.
Physics Department, University of Durham, Durham DH1 4ED, UK
1. Introduction
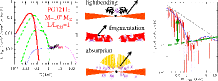
Many AGN show X–ray spectra which rise smoothly below 1 keV above the extrapolated 2–10 keV emission. This soft X-ray excess is generally fairly featureless. It cannot be resolved into a series of emission lines with gratings, though there are some discrete emission/absorption features superimposed on it. Thus it looks like an apparent continuum component, but it is at far too high a temperature to be simply the high energy tail of the accretion disc emission. Fig 1a shows the soft excess in PG1211+104 which is at much higher energies than predicted from the expected accretion disc spectrum for the best estimates of mass and for this object (Gierlinski & Done 2004).
The next most obvious continuum origin for the soft excess is as Compton scattered disc emission. The observed rollover at keV implies an electron temperature of keV, and the shape of the spectrum implies a large optical depth (Gierlinski & Done 2004). This low temperature, high optical depth Comptonisation region is in addition to the high temperature, low optical depth Comptonisation which makes the 2–10 keV component, extending up to high energies. However, while this fits the shape of the soft excess (Fig 1a), it predicts that it should relate to the disc emission as this provides the source of seed photons for the low temperature Comptonisation. A survey of PG Quasars in the XMM–Newton database shows that this is not the case. All these objects show a soft excess with very similar temperature of 0.1–0.2 keV, yet span a range of over a factor 10 in disc temperature. This makes it very unlikely that the soft excess is from Comptonisation (Gierlinski & Done 2004).
What then is the origin of the soft X–ray excess? The apparently fixed temperature is much easier to explain if it arises from atomic rather than continuum processes. One potential physical association is with the large increase in opacity between 0.7–3 keV due to OVII/OVIII and Fe L shell absorption. This opacity jump from partially ionised material can produce a soft excess in two different geometries, one where the material is optically thick and out of the line of sight, seen via reflection (e.g. from an accretion disc). Alternatively, the material can be optically thin and in the line of sight, seen in absorption (e.g. a wind above the disc). We discuss each of these possiblities in detail below.
2. Reflection
The reflection probablility is set by the balance between photoelectric absorption and electron scattering. The higher the photoelectric absorption, the less likely the photon is to be reflected before being absorped so the lower the reflected fraction. The increase in absorption opacity between 0.7–3 keV means a decrease in reflection between these energies, and so to a big rise in the reflected emission below 0.7 keV. This continuum reflection is enhanced by emission lines from the partially ionised material, especially OVII/VIII Ly at 0.6–0.7 keV as well as Ly lines from C,N and Fe L transitions (see e.g. Ross & Fabian 2005). However, while such partially ionised reflection spectra have long been realised to match well to the energy of the soft X-ray excess (e.g. Czerny & Zycki 1994), the preponderance of sharp atomic features in the models rules this out. If this is the origin of the soft excess, then these features must be blurred into a pseudo–continuum by strong velocity shear such as is produced by reflection from a rotating disc (Cunningham 1975; Fabian et al 1989). Such models can match the shape of the soft excess, and importantly the parameters required for the relativistic smearing to make the soft excess can be the same as those required to produce the associated iron K line emission (Fabian et al 2002; 2004; 2005; Miniutti & Fabian 2004; Crummy et al 2006, though these also show that the highest signal–to–noise spectra require multiple reflection components).
However, these parameters are uncomfortably extreme. The size of the soft X-ray excess, parameterised as a ratio at 0.5 keV of the data to the (extrapolated) power law fit to the 2–8 keV spectrum, can be . Yet for isotropic illumination, the reflected emission below 1 keV cannot be larger than the illuminating flux, so limiting the size of the soft excess to (e.g. Sobolewska & Done 2006).
The objects with these large soft X–ray excesses tend to be Narrow Line Seyfert 1 galaxies. The large reflected fraction could be produced in anisotropic illumination models, e.g. where the X–ray source is extremely close to the black hole so that lightbending suppresses the observed direct continuum flux and enhances the disc illumination (Miniutti & Fabian 2004). Alternatively, the disc might fragment into inhomogeneous regions which hide a direct view of the intrinsic source flux (Fabian et al 2002; 2005). These reflection geometries are sketched in Fig 1b.
As well as the reflected fraction being unexpectedly large, the amount of relativistic smearing required is also extreme. Crummy et al (2006) show that most of the PG Quasars require an inner disc radius which implies an extreme spin black hole and an reflection emissivity which is much more centrally peaked than expected from gravitational energy release. While this can be produced in the lightbending scenario, this predicts that the objects with largest reflection enhancement should have the strongest smearing which is not always seen (Crummy et al 2006; Sobolewska & Done 2006).
3. Absorption
The same physical process of the opacity increase between 0.7–3 keV can also produce the soft excess via absorption, plausibly from a wind from the accretion disc (Gierlinski & Done 2004, see Fig 1c). Again, relativistic velocity shear is required to smear out the characteristic atomic features into a pseudo–continuum but the difference between this and the reflection model is that these motions are no longer Keplarian, so cannot be used to simply infer the inner disc radius (and hence black hole spin).
The absorption model fits the data from PG1211+104, a NLS1 with a large soft X–ray excess, as well as the reflection model. There is still some reflection present in the data, but neither solid angle nor smearing are extreme. However, for 1H0707-495, a NLS1 with an extremely large soft X–ray excess, there is also a strong sharp drop at 7 keV which cannot be well matched by the simple smeared absorption (Sobolewska & Done 2006). However, this could be an artifact of the very simple velocity field (Gaussian!) assumed in the model. A wind with coherent velocity structure produces P Cygni line profiles in resonance absorption lines such as He– and H–like iron K at 6.7 and 6.95 keV. Including such profiles for the iron line emission gives an excellent fit to the sharp drop at keV in 1H0707-495 (Done et al 2006).
4. Variability Behaviour
Since both the reflection models and the absorption models can give comparable fits to the XMM–Newton spectra, we look instead at variability properties in order to distinguish between them. The observed XMM–Newton r.m.s. variability spectra typically peak in the 0.7–3 keV region, strongly supporting the association of the soft excess with atomic processes. In the reflection model this pattern of variability can be produced by decomposing the spectrum into a variable power law together with a more or less constant reflected component. The higher fraction of the power law flux in the 0.7–3 keV bandpass fits the observed peak in the r.m.s. variability (Ponti et al 2006). It is hard to understand why the reflected flux remains constant while the illuminating power law varies, though again the lightbending model can reproduce this behaviour (Miniutti & Fabian 2004). By contrast, in the absorption model, the variable power law flux induces correlated changes in the ionisation state of the absorber, . Higher power law flux gives higher ionisation and less absorption in the 0.7–3 keV band, while lower illumination gives lower ionisation and more absorption. These ionisation changes amplify the 0.7–3 keV variability, fitting the peaked r.m.s. variability spectra (Gierlinski & Done 2006).
5. Conclusions
Neither spectra nor spectral variability in the 0.3–10 keV bandpass of XMM–Newton can distingush between the reflection and absorption origin of the soft X–ray excess. Suzaku data extending the bandpass beyond 10 keV may give the first direct test between the models as reflection predicts somewhat higher fluxes in the 10–50 keV bandpass than absorption (Sobolewska & Done 2006).
More generally, we might have to use physical plausibility arguments, especially as both reflection and absorption models are subject to systematic uncertainties e.g. an unknown ionisation distribution with distance for reflection and with velocity and column density and covering factor for the associated emission in absorption (Sobolewska & Done 2006, Schurch & Done 2006). We expect that the NLS1 galaxies are messy, embedded in a powerful wind, as these are typically high sources. Physically it is unlikely that these objects give us a clean view of the accretion disc, so their spectra probably cannot be used for studies of General Relativity without understanding more of the messy environment around a high accretion rate black hole. Nonetheless, despite these difficulties, it is very important to try to understand these spectra as they are the local (high signal to noise) examples of the high mass accretion rates expected in the early Universe from the first QSO’s.
References
- (1) Crummy J., Fabian A. C., Gallo L., Ross R. R., 2006, MNRAS, 365, 1067
- (2) Cunningham C.T., 1975, ApJ, 202, 788
- (3) Czerny B., Zycki P.T., 1994, ApJLett, 431 5
- (4) Done C., Sobolewska M.A., Gierlinski M., Schurch N.J., MNRAS, in press.
- (5) Fabian A. C., Rees M. J., Stella L., White N. E., 1989, MNRAS, 238, 729
- (6) Fabian A. C., et al., 2002, MNRAS, 331, L35
- (7) Fabian A. C., et al., 2004, MNRAS, 353, 1071
- (8) Fabian A. C., Miniutti G., Iwasawa K., Ross R. R., 2005, MNRAS, 361, 795
- (9) Gierliński M., Done C., 2006, MNRAS, L64
- (10) Gierliński M., Done C., 2004, MNRAS, 349, L7
- (11) Miniutti G., Fabian A. C., 2004, MNRAS, 349, 1435
- (12) Ponti G., et al., 2006, MNRAS, 368, 903
- (13) Ross R., Fabian A.C., 2005, MNRAS, 358, 211
- (14) Schurch N. J., Done C., 2006, MNRAS, 762
- (15) Sobolewska M., Done C., 2006, MNRAS, in press