11email: acmilone@das.inpe.br 22institutetext: Universidade Federal do Rio Grande do Sul (UFRGS), Instituto de Física, Departamento de Astronomia, Av. Bento Gonçalves 9500, Porto Alegre, RS, 91501-970, Brazil
The elliptical galaxies NGC 1052 and NGC 7796:
Abstract
Context. Understanding how each early-type galaxy forms and evolves is one of the objectives of the extragalactic astrophysics and cosmology. The spatial distribution of the stellar populations inside a spheroidal system and their kinematical properties supply important informations about the formation process. Specifically, the reconstruction of the star formation history is crucial in this context.
Aims. We have performed a detailed stellar population analysis using long slit spectroscopic observations up to almost one effective radius of two different early-type galaxies of low density regions of the local Universe: NGC 1052, a E4 Liner prototype of a loose group that has a stellar rotating disc, and NGC 7796, a E1 of the field which shows a kinematically distinct core. The mean luminosity-weighted stellar age, metallicity, and /Fe ratio along both photometric axes of them have been obtained in order to reconstruct the star formation history in their kinematically distinct subsystems.
Methods. We have measured Lick indices and computed their radial gradients. They were compared with the predicted ones of simple stellar population models. We have also applied a stellar population synthesis.
Results. The star characteristics are associated with their kinematics: they are older and -enhanced in the bulge of NGC 1052 and core of NGC 7796, while they show a strong spread of /Fe and age along the disc of NGC 1052 and an outwards radial decreasing of them outside the core of NGC 7796. The age variation is possibly connected to the /Fe one.
Conclusions. Both galaxies were formed by processes in which the star formation occurred firstly at the bulge (NGC 1052) and nucleus (NGC 7796) 12-15 Gyr ago on short timescales (0.1-1 Gyr) providing an efficient chemical enrichment by SN-II. In the disc of NGC 1052, there is some spread of age and formation timescales around its stars. In NGC 7796, the star formation timescale had some outwards radial increasing along both axes.
Key Words.:
galaxies: elliptical and lenticular, cD – galaxies: stellar content – galaxies: individuals: NGC 1052 and NGC 77961 Introduction
A great effort has been spent to understand how the stellar populations are formed and evolve in the early-type galaxies. The early-type galaxies (or their nuclei) are not composed by a single-aged stellar population but they seem as a mix of simple stellar populations. Recent discoveries show that ellipticals are not merely a one-parameter family as a function of the global initial mass only (Yoshii & Arimoto 1987). It is known they are a two-parameter family, given by the fundamental plane. Many ellipticals have signatures of interaction with the environment. These galaxies might have had different star formation histories, with stellar populations differing in metallicity and/or age (Worthey, Faber & Gonzalez 1992). Crucial information on the above issues have been compiled from the radial gradients of the metal line-strength indices for field ellipticals (Davies, Sadler & Peletier 1993 and Kobayashi & Arimoto 1999) and for cluster ones (Jorgensen 1997 and Mehlert et al. 2003). The metal line-strength gradients in early-type galaxies, for example, can vary considerably, ranging from essentially featureless to structured profiles showing e.g. changes of slope possibly associated with kinematically decoupled cores (Bender & Surma 1992 and Morelli et al. 2004), or anomalies in the stellar populations (Carollo & Danziger 1994).
More recent studies about the stellar content of early-type galaxies have analyzed two dimensional spectroscopic data of their central parts in terms of kinematics and population parameters (e.g. Davies et al. 2001 and McDermid et al. 2006). Davies et al. (2001) have found two independent kinematic spatial subsystems in the E3 galaxy NGC 4365 which have the same luminosity-weighted age (nearly 14 Gyr) and the same overabundance for the Magnesium-to-Iron ratio indicating a common star formation history for both kinematically distinct components. McDermid et al. (2006) showed a summary of the results of two integral-field spectroscopic surveys using two instruments (SAURON and OASIS). These results let to analyze in details the relationship between kinematically distinct components and their host galaxies basically in terms of the stellar age distribution (presence or absent of young populations).
The metallicity radial gradients in bulges or early-type galaxies are related to the formation process of these spheroidal systems. A monolithic dissipative collapse of gas clouds associated with intense star formation can form a strong stellar metallicity gradient (Carlberg 1984, Chiosi & Carraro 2002 and Kawata 1999). On the other hand, it can also be induced by a hierarchical merging (Mihos & Hernsquist 1994 and Bekki & Shioya 1999). Kobayashi (2004), in a general point of view, concludes that the metallicity and age gradients are dependent on the galaxy merging history. Forbes, Sánchez-Blázquez & Proctor (2005) found there is a direct correlation between the strength of the metallicity gradient and the mass of the early-types.
Many galaxies show in the central region the Mg/Fe stellar abundance ratio larger than the solar one (i.e. an overabundance of the alpha-elements relative to the iron peak elements) which is interpreted as a consequence of the chemical enrichment given by type II supernovae relative to type Ia ones (Idiart, Michard & de Freitas Pacheco 2003). However, Calcium is found underabundant relative to Iron in ellipticals, through the analysis of different absorption lines of it, despite beeing an alpha-element like Magnesium: the Ca II triplet at 8600 Å (Saglia et al.2002), and the blue Lick index Ca4227 (Thomas, Maraston & Bender, 2003b).
Moreover, the radial gradients of Mg line-strength indices of Lick System can have equal or different behavior of those of Fe indices due to the galaxy formation process and the time scales of the star formation events.
Other studies have shown that the radial dependency of stellar /Fe, or specifically the Mg/Fe abundance ratio, can solve the star formation history inside a galaxy. Pipino, Matteucci & Chiappini (2006) have found that NGC 4697 was formed by an outside-in process because the Mg/Fe ratio is increasing outwards in that galaxy based on a chemical evolution analysis. However, the majority of the stellar populations studies in ellipticals have shown that the oversolar Mg/Fe abundance ratio is a global characteristic of an E galaxy (e.g. Mehlert et al 2003). It is still not obvious that the Mg/Fe abundance ratio is correlated to the global mass and/or the central velocity dispersion of the early-type galaxies (e.g. Henry & Worthey 1999 and Thomas et al. 2005).
At least, three kind of chemical evolution models have been proposed for ellipticals based on an occurrence of a internal galactic wind which rules the end of the star formation (Matteucci et al. 1998). During a long or short star burst, some amount of kinetical and thermal energy is transferred to the interstellar medium by the supernova explosions. When this energy is greater than the gravitational energy of the system, the interstellar material can be driven out of the galaxy by a global wind, which is produced by the supernovae. Thus the wind interrupts the star formation and the stellar populations evolve passively. One of them is called as the classic wind model (Larson 1974a, Larson 1974b, Arimoto & Yoshii 1987 and Matteucci & Tornambè 1987), which says that the star formation stops later in the more massive galaxies than less massive ones because their deeper gravitational potential wells. The consequence is to provide higher Mg/Fe abundance ratio in less massive galaxies (disagreeing to the observed). The other is named as the inverse wind model (Matteucci 1994), which establishes that the galactic wind occurs earlier in the more massive galaxies providing an efficient star formation and a higher Mg/Fe ratio. It is according to the relation Mg2- (or logFe- that has a weaker positive correlation). These chemical evolution models are based on the monolithic collapse of a gas cloud. The last one was also proposed by Matteucci (1994). It suggests that more massive ellipticals are formed by merging of proto-clouds providing higher relative velocities to the cloud-cloud collisions. The result is a more star formation effectiveness for the more massive galaxies so that galactic wind can happen earlier providing more Mg enrichment relative to Fe.
We have selected for the analysis of stellar populations two elliptical galaxies with intermediated masses ( 1011 ) of low density regions of the local Universe: NGC 1052, which belongs to a loose group, and NGC 7796 of the field. They are different in terms of stellar kinematics: NGC 1052 has a stellar rotating disc and NGC 7796 a kinematically distinct core. Some parameters of them are given in Table 1.
The E4 galaxy NGC 1052 is well studied for several aspects: it is classified as a LINER prototype, and it has a nuclear jet at radio, optical and X-ray frequencies (Kadler et al. 2004). This elliptical has neutral hydrogen too. It is third brightest member of a group with 11 galaxies identified by Giuricin et al. (2000). At V, R and I bands the isophotes, that follow de Vaucouleurs profile, change the ellipticity outwards from 0.10 up to 0.35 and they have an small isophotal twist too (Bender et al. 1988). Radial gradients of the and colours were observed in this galaxy (Peletier et al. 1990). The presence of nuclear gas was detected through HST Nicmos observation by Ravindranath et al. (2001). The NGC 1052 internal kinematics was analyzed by several authors. Binney et al. (1990), using dynamical models and photometric/spectroscopic data, have concluded that this elliptical has a rotating disc with inclination angle = 90o (a pure axisymmetric component) and it shows = 4.5 in R band and 8.0 in B band. Fried & Illingworth (1994) have calculated its rotation parameter = 0.83 0.05 and the logarithmic velocity dispersion radial gradient = -0.010 0.020. The Lick index Mg2 radial gradients along both photometric axes were firstly determined by Couture & Hardy (1988). Carollo, Danziger & Buson (1993) have measured the gradients of some Lick indices along the E-W direction only. Central values of several Lick indices of NGC 1052 were obtained by some works (e.g. Trager et al. 1998, Beuing et al. 2002 and Thomas et al. 2005) but the majority have only published the central Mg2 (e.g. Terlevich et al. 1981, who were the first ones). The stellar population analysis of NGC 1052 made by Raimann et al. (2001), using long slit spectroscopic data over one direction only, indicates a larger spatial spread in age than in metallicity so that the old metal-rich populations dominate the nucleus but the young population of 1 Gyr becomes important outside of the nuclear region. Thomas et al. (2005) have derived stellar age, [Z/H], [/Fe] for an extended sample of early-type galaxy nuclei. For NGC 1052, these parameters are: 21.7 Gyr, [Z/H] = +0.222 and [/Fe] = +0.390 dex. On the other hand, the recent study of Pierce et al. (2005) about the stellar ages, metallicities and abundances ratios of the region inside 0.3 of NGC 1052 and a sample of 16 globular clusters of it have found that its nucleus has a luminosity-weighted age 2 Gyr and [Fe/H] +0.6 dex. They have not found any strong radial gradients in either age and metallicity, but there is a strong gradient in -element abundance whose central value is very high. Moreover, for all observed globular clusters of NGC 1052, they have obtained an age of 13 Gyr. These results indicate NGC 1052 is a result of a recent merger (with starburst!) which did not induce the formation of a young population of globular cluster. Apparently, it is a puzzle for the evolutionary history of this LINER elliptical galaxy.
NGC 7796 is an isolated E+ galaxy, or E1 using the ellipticity at 25 mag.arcmin-2. According to JHKs surface photometry of Rembold et al. (2002), this galaxy shows boxy isophotes with constant ellipticity and position angle. Its surface brightness profile follows the r1/4 law with a decreasing value of from 16.3 arcsec (J band) to 10.7 arcsec (Ks band). According to Ferrari et al. (2002), NGC 7796 presents an warm and cold dust components with uniform spherical distributions inside the central region. A counter rotating core for the stellar component was detected by Bertin et al. (1994). In addition, the stellar velocity dispersion along the major photometric axis changes from 230 km.sec-1 at the r = 20 arcsec up to 270 km.sec-1 at the center. The radial profile of Mg2 was also observed by Bertin et al. (1994) and central values of several Lick indices were only obtained by Beuing et al. (2002) and Thomas et al. (2005). The stellar population for the central region was estimated having an age of 11.8 Gyr, [Z/H] = +0.248 dex and [/Fe] = +0.344 dex (Thomas et al. 2005).
The goal of this paper is to study in detail the radial distribution of the stellar populations along the main photometric directions in two different ellipticals, a LINER of a group NGC 1052 and the field galaxy NGC 7796, in order to understand the formation/evolution process of these galaxies, specially the star formation histories. The paper is organized as follows: Section 2 presents the observations, data reduction and kinematical measurements; Section 3 deals the Lick index measurements; Section 4 shows the radial gradients of some Lick indices; Section 5 presents the comparisons with the simple stellar population models; Section 6 describes the stellar population synthesis approach and Section 7 appoints the star formation histories of these galaxies. Finally, in Section 8 a general discussion of the results and conclusions are drawn.
2 Long slit spectroscopic observations, reductions and kinematical measurements
Long slit spectroscopic observations of NGC 1052 and NGC 7796 along their major and minor photometric axes were carried out on 1999 (August 12th and October 11th nights) at the Cassegrain focus with a Boller & Chivens spectrograph of the 1.60m telescope of the Observatório do Pico dos Dias (OPD) operated by the Laboratório Nacional de Astrofísica (LNA). The photometric parameters of NGC 1052 and NGC 7796 taken from the RC3 Catalogue and the extra-galactic data base NED are listed in Table 1; =75 km.s-1.Mpc-1 has been adopted.
The slit width was 2.08 arcsec and its length was 230 arcsec. The spatial angular scale was 1.092 arcsec.pixel-1. Adopting = 0.75, this corresponds to the linear scale of 111 pc.pixel-1 for NGC 1052 ( distance of 1723 km.s-1 from Faber et al. 1989) and 213 pc.pixel-1 for NGC 7796 ( as distance indicator, Tab. 1). The average seeing was = 2.0 arcsec.
The spectral range at the wavelength of rest is 4320-6360 Å and the sampling is 2.01 Å.pixel-1 using a grating of 600 lines.mm-1. The mean instrumental spectral resolution at 4400-6200 Å has = 71 km.s-1.
The total galaxy spectral exposures were divided in three equal of 30 minutes each one for the major axis observations and 2 30 minutes for the minor axis ones in order to perform the “cosmic rays” elimination and to obtain better signal-to-noise ratio for their aperture spectra.
Spectra of one G and seven K giants of the Lick sample (Worthey 1994 and http://astro.wsu.edu/worthey/) were collected in order to calibrate the absorption line-strengths to the Lick System. These stellar spectra were also used to perform the cross correlations with the galaxy spectra following the Tonry & Davis (1979) method. Spectrophotometric standard stars were observed as well.
| Parameter | NGC 1052 | NGC 7796 |
|---|---|---|
| Classifications | E4, LINER, Sy2 | E+ |
| 120∘ | 168∘ | |
| 0.3082 | 0.1290 | |
| -20.50 | -20.79 | |
| 11.41 | 12.46 | |
| (arcsec) | 33.7 | 21.2 |
| (mag.arcmin-2) | 12.15 | 12.20 |
| (arcsec) | 90.6 | 65.6 |
| 0.027 | 0.01 | |
| 1.01 | 1.00 | |
| (km.s-1) | 15106 | 329024 |
| Redshift | 0.00504 | 0.01097 |
| (km.s-1) | 20833 | 25911 |
| Mg2 (mag) | 0.2990.015 | 0.2370.003 |
| Size25 (arcminarcmin) | 3.63 2.51 | 2.34 2.04 |
| Environment | Group | Field |
2.1 Data reduction, spectrum extraction and sky subtraction
The digital images were processed and reduced using The NOAO Optical Astronomy Packages of IRAF. Firstly, the images were properly bias subtracted and flat field corrected. The cosmic ray hits above specific flux ratio thresholds were also removed in all of them.
The one-dimensional stellar spectra were extracted using apertures characterized by the FWHM of their profiles. The sky subtractions of them were made using two regions distant 55 arcsec from the profile centers and a second order chebyshev function to represent the sky level across the slit. These spectra were wavelength calibrated ( = 0.2-0.4 Å) using the line identifications in the Helium-Argon frames which were obtained immediately before or after each exposure.
The aperture spectra along the major axis of NGC 1052 ( = 120o) were extracted for the radial distances of 0.00, 1.10, 3.56, 6.84, 11.80, 20.21 and 37.03 arcsec each side of the center. They are adjacent each other and each aperture is always greater than the previous one in order to improve the spectral quality. The symmetric spectral extractions along its minor axis ( = 210o) were for the radial distances of 0.00, 2.18, 4.91, 9.42 and 18.0 arcsec. The obtained spectral signal-to-noise ratio per Angstrom, (Å-1) has been from 9 (minor axis) and 36 (major axis) for the most external spectra up to 34 (minor axis) and 83 (major axis) for the central ones. The S/N(Å-1) was measured in the spectral range 5800-5850 Å (wavelength of rest) according to the simple expression derived for the photon statistic by Cardiel et al. (1998).
The aperture spectra along the major axis of NGC 7796 ( = 168o) were obtained for the radial distances of 0.00, 1.10, 3.55, 7.10 and 13.21 arcsec and along the minor axis for the distances of 0.00, 1.09, 3.55, 6.93 and 12.5 arcsec. The spectral (S/N)(Å-1) has been from 17 (minor axis) or 26 (major axis) for the most external spectra up to 47 (minor axis) or 61 (major axis) for the central ones.
The extractions of the long slit aperture spectra of both galaxies adopted second order chebyshev functions to fit the background level across the slit at each wavelength. For NGC 1052, the sky windows were localized from 81 arcsec of the galactic center. For NGC 7796, the sky windows stayed at r 67.5 arcsec for the major axis extractions and at r 55.7 arcsec (0.91 r) for the minor axis ones. There were some flux residuals due to the poor subtraction of the telluric lines in the outer regions of the galaxies. However, these residuals are not in the spectrum windows of the Lick indices (except for Fe5406; see details in Sect. 3).
In the sky background windows, the contribution of the galaxy spectrum was smaller than 7.6% relative to the sky level in the OPD/LNA where V = 21.2 mag.arcsec-2 in the dark nights of August/October on 1999. For the central aperture of an unique exposure of NGC 1052 (major axis), the relative error of the sky subtraction increases from 1.4% in the red up to 2.2% in the blue region. For a respective exposure of NGC 7796, we have obtained 1.9% in the red and 3.1% in the blue. For the most distant apertures of an exposure for NGC 1052 (major axis), this error is 6.4% in the red and 9.5% in the blue; and for an analog exposure of NGC 7796, it is 5.7% in the red and 8.9% in the blue.
The relative difference between the sensitivity functions of distinct flux standard stars was 2.0% and 0.8% in the runs of August and October respectively. The influence of the flux calibration on the Lick index measurements is discussed in Section 3.
In summary, all aperture spectra of both galaxies were wavelength calibrated ( 0.30 Å) using He-Ar frames (obtained immediately before or after of each exposure), accordingly summed, flux calibrated, deredden using the respective line-of-sight Galactic extinction, put at the rest wavelength using the observed recession velocities (from the cross correlation measurements) and flux normalized at 5870 Å. The parameters and kinematical measurements of all long slit spectroscopic extractions are given in Tables 2 and 3 for NGC 1052 and Tables 4 and 5 for NGC 7796.
| Radius | Area | S/N | Rcc | ||
| (arcsec) | (arcsec2) | (Å-1) | (km.s-1) | (km.s-1) | |
| 0.00 | 4.53 | 83 | 018 | 22310 | 18.5 |
| 1.10 SE | 4.53 | 78 | -1918 | 22109 | 18.5 |
| 1.08 NW | 4.53 | 78 | +1618 | 22509 | 19.3 |
| 3.56 SE | 5.68 | 62 | -3616 | 21011 | 22.2 |
| 3.54 NW | 5.68 | 59 | +4416 | 22009 | 22.2 |
| 6.84 SE | 7.95 | 48 | -4017 | 21114 | 20.5 |
| 6.81 NW | 7.95 | 45 | +7517 | 21614 | 21.7 |
| 11.80 SE | 12.73 | 42 | -6018 | 21317 | 18.7 |
| 11.78 NW | 12.73 | 40 | +7917 | 21216 | 20.6 |
| 20.21 SE | 22.26 | 36 | -8321 | 21218 | 13.8 |
| 20.19 NW | 22.26 | 36 | +10818 | 18216 | 15.6 |
| 37.03 SE | 47.69 | 30 | -10530 | 18018 | 7.2 |
| 37.01 NW | 47.69 | 30 | +14930 | 16917 | 7.2 |
-
Column 1: Distance of the extraction region to the galaxy center. SE and NW correspond to Southeast and Northwest respectively.
-
Table Notes.
Column 6: cross correlation factor Rcc of the best stellar template (HR 8924).
| Radius | Area | S/N | Rcc | ||
| (arcsec) | (arcsec2) | (Å-1) | (km.s-1) | (km.s-1) | |
| 0.00 | 4.53 | 34 | 018 | 23624 | 17.1 |
| 2.17 SW | 4.53 | 25 | +1118 | 23432 | 18.0 |
| 2.19 NE | 4.53 | 24 | -2120 | 23332 | 15.0 |
| 4.90 SW | 6.82 | 17 | +818 | 21433 | 17.7 |
| 4.92 NE | 6.82 | 16 | +119 | 22037 | 15.6 |
| 9.41 SW | 11.92 | 12 | -521 | 23347 | 13.7 |
| 9.43 NE | 11.92 | 12 | +519 | 17725 | 14.0 |
| 18.00 SW | 23.80 | 9 | -629 | 18428 | 7.5 |
| 18.01 NE | 23.80 | 9 | -1029 | 14418 | 6.6 |
-
Column 1: SW and NE correspond to Southwest and Northeast respectively.
-
Column 6: as in Table 2.
| Radius | Area | S/N | Rcc | ||
| (arcsec) | (arcsec2) | (Å-1) | (km.s-1) | (km.s-1) | |
| 0.00 | 4.53 | 61 | 014 | 26110 | 26.6 |
| 1.09 S | 4.53 | 56 | -313 | 25711 | 28.1 |
| 1.09 N | 4.53 | 56 | +815 | 27414 | 24.0 |
| 3.55 S | 5.68 | 41 | +416 | 25520 | 21.9 |
| 3.55 N | 5.68 | 40 | +114 | 27120 | 25.4 |
| 7.10 S | 9.09 | 32 | +2017 | 23726 | 17.2 |
| 7.10 N | 9.09 | 31 | -818 | 26030 | 16.4 |
| 13.21 S | 16.35 | 26 | +5024 | 24033 | 10.6 |
| 13.21 N | 16.35 | 26 | +2524 | 24334 | 10.9 |
-
Column 1: S and N correspond to South and North respectively.
-
Table Notes.
Column 6: as in Table 2.
| Radius | Area | S/N | Rcc | ||
| (arcsec) | (arcsec2) | (Å-1) | (km.s-1) | (km.s-1) | |
| 0.00 | 4.53 | 47 | 014 | 26116 | 24.7 |
| 1.09 E | 4.53 | 44 | -215 | 26718 | 23.9 |
| 1.09 W | 4.53 | 44 | -115 | 26018 | 24.4 |
| 3.55 E | 5.68 | 31 | +1216 | 26526 | 19.5 |
| 3.55 W | 5.68 | 32 | -816 | 25328 | 20.3 |
| 6.93 E | 8.40 | 22 | +1821 | 25341 | 13.1 |
| 6.93 W | 8.40 | 22 | -3521 | 22432 | 12.3 |
| 12.50 E | 14.77 | 17 | +2834 | 26440 | 7.3 |
| 12.50 W | 14.77 | 17 | -2323 | 21533 | 10.6 |
-
Column 1: E and W correspond to East and West respectively.
-
Column 6: as in Table 2.
2.2 Stellar kinematical measurements with external comparisons
The line-of-sight rotation curve and the line-of-sight velocity dispersion radial profile of the stellar component along both photometric axes were measured for both galaxies using our kinematical data: and of the aperture spectra. We have also calculated the rotational parameter (V/)⋆, the kinematical misalignment and the logarithmic radial gradient of the velocity dispersion for both galaxies. Our data have been compared with the literature data.
We have been adopted for this purpose the cross correlation method (Tonry & Davies 1979) using the RVSAO (Radial Velocity Package of the Smithsonian Astrophysical Observatory) on IRAF enviroment (Kurtz & Mink 1998). The uncertainty of the geocentric radial velocity of each aperture spectrum is computed by , where FWHMpeak is the FWHM of the peak of the cross correlation function, is the ratio between the height of this peak and the amplitude of a sinusoidal noise for the function (Kurtz & Mink 1998). The heliocentric radial velocities of the stellar templates (K giants) came from the Duflot et al. (1995) Catalogue.
We had to apply an empirical calibration in order to transform the FWHMpeak into the galaxy velocity dispersion as made for example by de la Rosa, de Carvalho & Zepf (2001). This takes into account the instrumental resolution and closely obeys the relation FWHMpeak = 2 , where corresponds to the mean of the stellar auto-correlations divided by . A parabolic function fitting was adopted to fit the half of the height of the correlation peak. A third order polynomial function FWHMpeak() was obtained adopting correlations between artificially broadened spectra of six observed stars (HR 6136, HR 6159, HR 6299, HR 8841 and HR 8924) and the non-broadened stellar ones. The mean instrumental resolution = 71 10 km.s-1 (4400-6200 Å) was estimated by the template-template correlations. Gaussian convolutions were made to represent of 50 up to 400 km.s-1 with steps of 50 km.s-1.
The velocity dispersion errors were estimated as a function of the signal-to-noise ratio and itself. Six levels of artificial Poisson noises were applied to all artificially broadened spectra of HR 8924 in order to represent the S/N variation of 14 up to 85 Å-1. For each noisy broadened spectrum, the velocity dispersion was measured and compared with the actual value. After that, a second order polynomial function of the S/N(Å-1) was constructed for each one of the values (of 50 up to 400 km.s-1) to estimate the relative error of the velocity dispersion. For example, the typical error of = 200 km.s-1 varies from 4.% up to 16.% when the S/N(Å-1) changes from 85 to 14 Å-1.
The stellar kinematical results of all observed galaxy regions are shown in Tables 2 and 3 (NGC 1052) and Tabs. 4 and 5 (NGC 7796), including the Rcc factor of the respective best cross correlation. Our measurements of of the central aperture are in agreement with the catalog values, i.e. the relative differences are smaller than 9% for NGC 1052 and 3.5% for NGC 7796.
Figures 1a and 1b show respectively the rotation curve and the velocity dispersion radial profile of NGC 1052 along its major axis. Figures 2a and 2b show the same its the minor axis. Our results are also plotted together with those of Binney et al. (1990) for both photometric directions and Fried & Illingworth (1994) for the major axis only. Figures 3a and 3b show respectively the rotation curve and the velocity dispersion radial profile of NGC 7796 along its major photometric axis. Figures 4a and 4b show the same for its minor axis. Our data are plotted together with those of Bertin et al. (1994) whose observations were made along the major axis only (Figs. 3a-b).


In order to compare our results about velocity dispersion with the literature, the observed of the central spectra must be corrected of the aperture effect considering a typical value for the logarithmic radial gradient of (Jorgensen, Franx & Kjaergaard 1995).
Taking into account the observations over both axes and adopting = -0.040 from Jorgensen, Franx & Kjaergaard (1995), the mean values of of NGC 1052 and NGC 7796 are 2139 km.s-1 and 2508 km.s-1 respectively. They are in excellent agreement to the published ones. For NGC 1052, LEDA presents = 20833 km.s-1 from 24 measurements including Binney et al. (1990) and Fried & Illingworth (1994) who measured 24010 km.s-1 and 19515 km.s-1 respectively. For NGC 7796, LEDA shows = 25911 km.s-1 from two studies only; one of them is Bertin et al. (1994) who measured 2659 km.s-1. The individual for NGC 1052 are: 20710 km.s-1 (major axis) and 22024 km.s-1 (minor axis). For NGC 7796 they are: 25010 km.s-1 (major axis) and 25116 km.s-1 (minor axis).
For NGC 1052, the rotation curve along the major axis is similar to those acquired by Binney et al. (1990) and Fried & Illingworth (1994); see Fig. 1a. The rotation curve over the minor axis is in agreement to that of Binney et al. (1990); see Fig. 2a. Along the major axis, despite the present worse spatial resolution, our result shows nuclear stellar rotation like a rigid body (up to r = 4-7 arcsec with a projected angular velocity of 10 km.s-1.arcsec-1), a discontinuity region at r = 7-12 arcsec like a plateau, and a similar rigid body rotation outwards after this rotation discontinuity with an smaller projected angular velocity ( 2 km.s-1.arcsec-1). However, our result points out an increasing of Vrot outside of the observed region, differently from Binney et al. (1990) and Fried & Illingworth (1994) data that have both shown a constant value. Along the minor axis, no residual rotation is detected for the stellar component. The present line-of-sight velocity dispersion radial profile along the major axis is similar to those ones of Binney et al. (1990) and Fried & Illingworth (1994); see Fig. 1b. The profile along the minor axis is in agreement to that of Binney et al. (1990): Fig. 2b. For the major axis profile, the main difference is that the data of Binney et al. (1990) and Fried & Illingworth (1994) have shown more negative gradient (up to r = 10 arcsec) than our data. The calculated rotational parameter (V/)⋆ assumes the nuclear velocity dispersion corrected by the aperture effect using the own logarithmic radial gradient measured along the major axis direction in the present work ( = -0.046 0.015). Our maximum line-of-sight rotational velocity V is the average of the ones measured in each side of the Vrot radial profile which were calculated using a third polynomial fitting for the velocity curve that takes into account the errors in Vrot only. NGC 1052 is a spheroidal system flattened by the rotational residual motion around the minor axis. Its rotational parameter, considering all observed region ( 3.8 kpc 0.9 re), is (V/)⋆ = 0.89 ( 0.14) which is in close agreement to the one found by Fried & Illingworth (1994). Its maximum rotational velocity is 122 13 km.s-1 in the observed region, but it still appears to increase outwards. Its nuclear velocity dispersion is 204 10 km.s-1 (Coma normalized using own radial gradient). Its line-of-sight velocity dispersion radial profile inside 0.9 re is nearly symmetric. We could classify NGC 1052 as an oblate rotator, but it is better to conclude that NGC 1052 has a fast rotating stellar component because its rotational parameter does not reach unity. The estimated kinematic misalignment is about 3o, if the maximum projected rotational velocity along the minor axis is not zero. This indicates that the stellar disc of NGC 1052 has an inclination angle very near to 90o or, in other words, the photometric axes of this elliptical are direct projections of the kinematical axes. This corroborates the result of Binney et al. (1990).
For NGC 7796, the rotation curve and radial profile, both along the major axis, are in agreement with those ones of Bertin et al. (1994) up to r = 14 arcsec; see Figures 3a and 3b. NGC 7796 has no significant stellar rotation around both axes. Its rotational parameter (V/)⋆ is 0.15 ( 0.04). The velocity dispersion profiles inside the observed region ( 4.3 kpc 0.6 re) are nearly uniform; see Figures 3b and 4b. The logarithmic radial gradient measured over the major axis in the present work is = -0.028 0.030. The nuclear velocity dispersion is 253 10 km.s-1 (Coma normalized using this gradient). Its is very high, 62o. Bertin et al. (1994), whose long slit observations have greater spatial resolution (1.78 arcsec.pixel-1), have concluded that NGC 7769 has a counter rotating core inside r = 4 arcsec that our observations marginally corroborate. But, if the major axis rotation curve is considered up to r = 8 arcsec we would detect a kinematically decoupled inner component (r 3.5 arcsec) that has no rotation while “the main body” has a very small rotation (14 km.s-1). The minor axis rotation curve (Fig. 4a), considered only up to r = 7 arcsec, does not show any rotation inside r = 1.5 arcsec and it presents a tiny rotation (26 km.s-1) greater than another one about the major axis. Therefore, the core of NGC 7796 shows complex kinematics.


3 Measurements of the Lick indices
The Lick indices are measurements of optical absorption lines of spectra of stars and stellar composite systems like globular clusters and galaxies. They have been usually employed to quantity the luminosity-weighted mean ages, metallicities and abundance ratios (as -elements/Fe) of the composite stellar populations with ages 2 Gyr. The Lick indices of atomic lines are measured as equivalent widths (Å unity) considering a linear local pseudo-continuum, which is defined by two wavelength windows side by side of the central feature bandpass [, ]. The Lick indices of molecular lines quantify the absorbed flux in the index bandpass relative to that pseudo-continuum and it is expressed in the magnitude scale (here denoted by ). These line-strengths were originally measured in flux non-calibrated spectra with low resolution using one dimensional image detector (Image Digital Scanner, IDS, of the Lick Observatory). The spectral resolution of the Lick System is actually variable in the range 4000-6000 Å: FWHMLick = 8.4 - 11.5 Å with greater values in the red and blue edges (Worthey & Ottaviani 1997). The Lick indices are defined to be independent of the line-of-sight velocity dispersion of the stellar system. Therefore, the spectral broadening effect due to the velocity dispersion must be subtracted in quadrature.
The EW indices can be transformed into the MAG index scale and vice-verse: and
3.1 Lick calibration and index errors
The current instrumental resolution is nearly 71 km.s-1 considering the interval 4400-6200 Å so that 3 Å at 5300 Å. The respective one of the Lick System is = 220 km.s-1, or FWHMLick 9.2 Å at approximately the same range (Worthey & Ottaviani 1997). Note that . Therefore, we had to put all galaxy and IDS sample star spectra nearly to the Lick spectral resolution in order to measure suitably the absorption line indices. To make this, all spectra were broadened using adequate Gaussians. The appropriate spectral broadening was obtained from the result of the cross correlation of the actual Lick/IDS spectra (http://astro.wsu.edu/worthey/) with the observed stellar sample, subtracting the instrumental spectral resolution in quadrature, i.e. = + .
Firstly, all galaxy and star spectra were accurately reduced to the wavelength of rest and broadened to the Lick resolution accordingly. The indices of Fe4383 to Na D, including Mg1 and Mg2, were measured. However, two steps are still necessary in order to transform the index measurements to the Lick System: (i) a linear correction, and (ii) a correction for the line-of-sight velocity dispersion (Worthey & Ottaviani 1997). Both steps must be carefully done and they must be also used to estimate the final errors of the indices Lick. It is still necessary to compare the indices to the published ones, specifically those for the galaxy nuclei. We have adopted eight Lick standard stars (see Sect. 2).
The first step is made through linear correlations between the actual published stellar Lick indices and the measured ones in our adequately broadened stellar spectra, like = A + B (see Table 6). The angular coefficient stayed in the range 0.63 B 1.27, and fitting was smaller than 0.37 Å for the indices excluding the Fe5015 index ( = 0.63 Å) and 0.0062 mag for the ones. The range of the index values measured in the broadened spectra of the eight Lick standards were similar to those ones observed in the galaxies, i.e. Fe4383 in [4.50, 8.50 Å], Ca4455 in [0.50, 2.00 Å], Fe4531 in [3.00, 4.50 Å], Fe4668 in [5.00, 9.00 Å], H in [0.50, 2.10 Å], Fe5015 in [5.00, 7.00 Å], Mg b in [2.00, 5.00 Å], Fe5270 in [2.80, 4.20 Å], Fe5335 in [2.20, 4.20 Å], Fe5406 in [1.40, 3.00 Å], Fe5709 in [0.90, 1.60 Å], Fe5782 in [0.60, 1.50 Å], Na D in [1.80, 5.40 Å], Mg1 in [0.010, 0.230 mag], and Mg2 in [0.100, 0.400 mag].
The second step is based on the galaxy velocity dispersion that broadens the absorption lines of each spectrum. Except for the H Lick index, the general consequence is a decreasing of the index value. A simple way is to compute some artificial broadenings of our Lick observed stellar spectra to different representative of the line-of-sight galaxy . Again, we have assumed spectral broadening by Gaussian convolutions for going from 50 to 400 km.s-1 (with 50 km.s-1 steps). The correction factor is the ratio of the measured index in the stellar observed spectrum to the measured index in the spectrum of a given representative denoted by where is the equivalent width of the index for an unbroadened spectrum (i.e. = 0 km.s-1). We have computed a second order polynomial fit in order to determine the mean correction factor as a function of the actual velocity dispersion for each Lick index, = a + b + c); see Tab. 6. The respective fitting was always smaller than 0.08 Å, except for the Ca4455 index (0.14 Å).
| Fitting coefficients and errors | |||||||
|---|---|---|---|---|---|---|---|
| Index | A | B | a | b | c | ||
| (Å) | (Å) | (10-4km-1.s) | (10-6km-2.s2) | ||||
| Fe4383 | 0.6920 | 0.94864 | 0.2720 | 0.9990 | 0.0699 | 2.2919 | 0.0149 |
| Ca4455 | 1.3488 | 0.62615 | 0.2025 | 1.0085 | -5.0818 | 8.5130 | 0.1418 |
| Fe4531 | -0.3046 | 1.22950 | 0.3710 | 1.0083 | -4.6272 | 1.6660 | 0.0574 |
| Fe4668 | 0.1884 | 1.10060 | 0.3419 | 1.0005 | -0.6561 | 1.3835 | 0.0159 |
| H | -0.3155 | 1.12340 | 0.2026 | 1.0045 | -5.3309 | 1.7006 | 0.0754 |
| Fe5015 | -0.5575 | 1.18350 | 0.6288 | 0.9913 | 3.5982 | 1.7919 | 0.0286 |
| Mg b | -0.2062 | 1.10380 | 0.2202 | 1.0019 | -1.3020 | 2.6367 | 0.0261 |
| Fe5270 | -0.7634 | 1.27300 | 0.1708 | 0.9959 | 1.9521 | 1.7809 | 0.0215 |
| Fe5335 | -0.3890 | 1.19720 | 0.1422 | 1.0005 | -1.5167 | 6.1129 | 0.0186 |
| Fe5406 | -0.2449 | 1.22160 | 0.0725 | 1.0030 | -1.8058 | 5.2013 | 0.0298 |
| Fe5709 | 0.0660 | 1.16050 | 0.2494 | 1.0041 | -2.5330 | 3.0240 | 0.0370 |
| Fe5782 | 0.0465 | 1.23470 | 0.2014 | 0.9933 | 3.0617 | 4.7034 | 0.0420 |
| Na D | 0.0183 | 0.97408 | 0.0962 | 1.0012 | -0.8740 | 1.3064 | 0.0116 |
| () | () | ||||||
| Mg1 | 0.0305 | 0.98239 | 0.0057 | 0.9989 | 0.6306 | 0.3009 | 0.0258 |
| Mg2 | 0.0153 | 1.09010 | 0.0062 | 0.9995 | 0.1950 | 0.1189 | 0.0074 |
The final errors of the Lick indices for each aperture spectrum were computed considering a Poisson error of the respective measurement, the error of the computed heliocentric velocity and the error propagations due to both steps of the Lick transformation. The Poisson uncertainty of each index, or , was estimated as a function of the S/N(Å-1) of each extracted spectrum following the simple expressions of Cardiel et al. (1998).
In Table 7, the errors of the Lick indices and their respective propagations due to the Lick calibration are shown, as example, for two extreme spectral S/N(Å-1) ratios (83 from the central spectrum of NGC 1052 and 26 from one most external of NGC 7796). For higher S/N, the final errors of the Lick indices are basically determinated by the Lick transformation and, for lower S/N, the intrinsic errors of the measurements become important to determine the final errors, except for Ca4455 and Fe5335.
| Lick index errors | |||
|---|---|---|---|
| Index | Poisson+cz | linear corr. | corr. |
| S/N=83 Å-1 | |||
| (Å) | (Å) | (Å) | |
| Fe4383 | 0.128 | 0.170 | 0.173 |
| Ca4455 | 0.065 | 0.088 | 0.385 |
| Fe4531 | 0.091 | 0.292 | 0.165 |
| Fe4668 | 0.137 | 0.258 | 0.178 |
| H | 0.060 | 0.151 | 0.187 |
| Fe5015 | 0.114 | 0.466 | 0.047 |
| Mg b | 0.049 | 0.159 | 0.208 |
| Fe5270 | 0.054 | 0.145 | 0.088 |
| Fe5335 | 0.065 | 0.122 | 0.173 |
| Fe5406 | 0.048 | 0.070 | 0.125 |
| Fe5709 | 0.037 | 0.180 | 0.067 |
| Fe5782 | 0.036 | 0.153 | 0.115 |
| Na D | 0.038 | 0.063 | 0.095 |
| (mag) | (mag) | (mag) | |
| Mg1 | 0.0011 | 0.0038 | 0.0047 |
| Mg2 | 0.0013 | 0.0044 | 0.0024 |
| S/N=26 Å-1 | |||
| (Å) | (Å) | (Å) | |
| Fe4383 | 0.424 | 0.140 | 0.340 |
| Ca4455 | 0.196 | 0.010 | 0.728 |
| Fe4531 | 0.266 | 0.372 | 0.302 |
| Fe4668 | 0.409 | 0.313 | 0.314 |
| H | 0.155 | 0.175 | 0.068 |
| Fe5015 | 0.306 | 0.537 | 0.512 |
| Mg b | 0.157 | 0.181 | 0.320 |
| Fe5270 | 0.158 | 0.201 | 0.230 |
| Fe5335 | 0.194 | 0.172 | 0.535 |
| Fe5406 | 0.147 | 0.114 | 0.245 |
| Fe5709 | 0.120 | 0.207 | 0.092 |
| Fe5782 | 0.112 | 0.188 | 0.219 |
| Na D | 0.134 | 0.058 | 0.132 |
| (mag) | (mag) | (mag) | |
| Mg1 | 0.0034 | 0.0037 | 0.0035 |
| Mg2 | 0.0039 | 0.0049 | 0.0025 |
3.2 Influence of the sky subtraction and flux calibration
The subtraction of the sky background was satisfactory for all galaxy and stellar spectra. However, the poor subtraction of the telluric emission line HgI5460.74 Å has only affected the Fe5406 index in the outer regions of the galaxies. The residual of this line subtraction stays in the Fe5406 red continuum in the aperture spectra of NGC 1052 for r 11.78 arcsec (major axis) or for all apertures (minor axis). The regions of all sky line residuals have been changed in the minor axis spectra of NGC 1052 by linear interpolations. For NGC 7796, the red continuum and bandpass of Fe5406 are affected by that sky line beyond the radial distance of 7.10 arcsec (major axis) or 6.93 arcsec (minor axis). The other sky line residuals do not affect the Lick index measurements because they do not occur in the index bandpasses as well as their continuum windows.
All Lick indices were also measured in the flux non-calibrated spectra () of the galaxies according to the original procedure of the Lick/IDS System. We have computed the index differences, = - , where denotes flux calibrated spectra. There is no systematic disagreement for all indices because these differences are comparable or smaller than their errors: +0.02 Å and -0.009 mag. As an example, for the central major axis spectrum of NGC 1052 whose S/N ratio is 83 Å-1, these differences are: (Å) = +0.066 for Fe4383, +0.010 for Ca4455, +0.024 for Fe4531, +0.015 for Fe4668, -0.009 for H, -0.184 for Fe5015, +0.006 for Mg b, +0.003 for Fe5270, -0.005 for Fe5335, -0.003 for Fe5406, -0.003 for Fe5709, -0.005 for Fe5782 and -0.010 for Na D; and (mag) = -0.0103 for Mg1, and -0.0102 for Mg2. For the major axis spectrum of NGC 1052 at r = 20.21 arcsec, whose S/N ratio is 36 Å-1, they are: (Å) = +0.102 for Fe4383, +0.015 for Ca4455, -0.003 for Fe4531, -0.041 for Fe4668, -0.007 for H, -0.063 for Fe5015, -0.004 for Mg b, +0.003 for Fe5270, -0.008 for Fe5335, -0.003 for Fe5406, -0.003 for Fe5709, -0.002 for Fe5782 and -0.010 for Na D; and (mag) = -0.0118 for Mg1, and -0.0115 for Mg2. Therefore, if there is some influence of the flux normalization precision over the Lick index measurements, this is negligible.
3.3 Emission line corrections of some indices for NGC 1052
For the aperture spectra of NGC 1052 up to the radial distance r = 3.56 arcsec (major axis) and up to r = 4.92 arcsec (minor axis), some Lick indices are affected by nebular emission lines of this LINER. The H index, of course, is directly contaminated by its respective gas emission. The Mg1, Mg2 and Fe5015 features are severely affected by the [O III]4958Å emission line present in their blue continuum windows. The bandpass of Mg2 is still contaminated by the [N I]5198-5200Å emission doublet, hereafter as [N I]5199Å. Additionally, Fe5015 is strongly disturbed by the [O III]5007Å in its red continuum as well. The Mg b index has less contamination by the [N I]5199Å in its red continuum window. These indices must be carefully corrected, specifically the Mg b whose respective correction is more reliable. The corrections of Mg b, Mg1 and Mg2 were computed following the simple and accurate procedure described by Goudfrooij & Emsellem (1996). The H correction should be only applied through a suitable composite absorption-line templates that were actually constructed using the stellar population synthesis approach (Sect. 6). However, it is redundant because the synthesis method supplies directly the information which would be obtained from this stellar age indicator Lick index. On the other hand, the composite stellar population templates of the synthesis technique had to be adopted for computing the emission line corrections of the Magnesium indices. These corrections are based on the equivalent widths of the nebular lines that must be measured in the pure emission spectra at the Lick/IDS resolution, i.e. after the subtraction of an absorption line template from the observed spectrum. The corrections due to the presence of an emission line inside an index continuum window or an index bandpass are computed as a function of the emission line equivalent width measured in the continuum window or the index bandpass respectively, where and are constants of each index. For Mg b, 1.127 and for Mg1, 0.4475. For Mg2, 0.4158 and -1.086 mag.
The Mg1 and Mg2 corrections due to the [O III]4958Å line (in their blue continuums) were computed in the scale and they were after transformed to the one. Table 8 presents the equivalent widths of the [O III]4958Å and [N I]5199Å lines, measured exactly in the index continuum windows (at 4895.125-4957.625Å, the blue one of Mg1 and Mg2, and at 5191.375-5206.375Å, the red one of Mg b) and the [N I]5199Å line in the Mg2 bandpass (5154.125-5196.625 Å) as well as for the inner regions of NGC 1052. The equivalent widths of the emission lines were measured adopting a single Gaussian profile fit.
After taking into account the emission line corrections for the measurements of Mg1, Mg2 (2 corrections) and Mg b, finally these indices were calibrated to the Lick scale. Beyond those radial distances for NGC 1052, H, Mg b, Mg1 and Mg2 were directly measured without corrections. The Fe5015 index was not corrected neither adopted for both galaxies.
For NGC 7796, emission lines were not detected in the aperture spectra and the residual spectra as well (Sect 6).
| (Å) | |||
|---|---|---|---|
| R (arcsec) | [O III]4958λλ4895.125-4957.625 | [N I]5199λλ5191.375-5206.375 | [N I]5199λλ5154.125-5196.625 |
| major axis | |||
| 0.00 | -5.00.3 | -1.40.1 | -1.20.1 |
| 1.10 SE | -5.50.5 | -1.00.1 | -0.90.1 |
| 3.56 SE | -4.10.6 | -0.80.1 | -0.70.1 |
| 1.08 NW | -4.50.2 | -0.90.1 | -0.80.1 |
| 3.54 NW | -2.10.7 | -0.40.1 | -0.40.1 |
| minor axis | |||
| 0.00 | -4.10.2 | -0.700.05 | – |
| 2.17 SW | -3.11.5 | -0.880.09 | – |
| 4.90 SW | – | -0.810.10 | – |
| 2.19 NE | -3.20.6 | -0.820.05 | – |
| 4.92 NE | – | -0.150.10 | -3.10.2 |
| (Å) indices | ||||||||
|---|---|---|---|---|---|---|---|---|
| R (arcsec) | Fe4383 | Ca4455 | Fe4531 | Fe4668 | Mg b | Fe5270 | Fe5335 | Fe5406 |
| 0.00 | 6.14 0.30 | 2.35 0.30 | 4.42 0.32 | 8.81 0.35 | 4.21 0.23 | 2.46 0.17 | 2.61 0.21 | 2.02 0.15 |
| 1.10 SE | 6.52 0.30 | 2.50 0.30 | 3.60 0.32 | 8.53 0.36 | 5.03 0.23 | 2.29 0.17 | 2.49 0.21 | 1.96 0.14 |
| 3.56 SE | 5.89 0.33 | 2.44 0.32 | 3.77 0.35 | 8.80 0.40 | 4.37 0.25 | 2.55 0.19 | 2.20 0.23 | 1.82 0.16 |
| 6.84 SE | 5.72 0.40 | 2.42 0.35 | 3.07 0.39 | 8.18 0.46 | 5.09 0.27 | 2.67 0.23 | 2.05 0.28 | 1.73 0.20 |
| 11.80 SE | 6.11 0.44 | 2.38 0.37 | 3.50 0.42 | 6.86 0.50 | 4.75 0.29 | 2.58 0.25 | 2.74 0.33 | 2.12 0.23 |
| 20.21 SE | 4.62 0.47 | 2.91 0.43 | 4.42 0.47 | 8.39 0.55 | 4.10 0.30 | 2.84 0.27 | 2.49 0.35 | 2.30 0.25 |
| 1.08 NW | 5.98 0.30 | 2.43 0.30 | 3.78 0.32 | 8.93 0.36 | 4.94 0.28 | 2.59 0.17 | 2.67 0.21 | 1.93 0.15 |
| 3.54 NW | 6.79 0.33 | 2.46 0.31 | 3.70 0.35 | 8.22 0.36 | 5.07 0.24 | 2.49 0.19 | 2.71 0.23 | 1.99 0.16 |
| 6.81 NW | 6.44 0.40 | 2.33 0.35 | 3.61 0.39 | 7.77 0.45 | 5.16 0.26 | 3.01 0.22 | 2.62 0.28 | 1.92 0.19 |
| 11.78 NW | 4.86 0.42 | 2.28 0.36 | 2.85 0.40 | 8.12 0.50 | 4.54 0.28 | 2.80 0.25 | 2.48 0.31 | 1.62 0.21 |
| 20.19 NW | 5.62 0.45 | 2.36 0.36 | 2.83 0.43 | 5.55 0.51 | 4.55 0.28 | 3.03 0.26 | 1.76 0.30 | 1.39 0.21 |
| (Å) and (mag) indices | ||||||
|---|---|---|---|---|---|---|
| R (arcsec) | Fe5709 | Fe5782 | Na D | H | Mg1 | Mg2 |
| 0.00 | 1.09 0.16 | 0.98 0.17 | 6.46 0.11 | – | 0.181 0.004 | 0.331 0.004 |
| 1.10 SE | 0.94 0.16 | 0.91 0.17 | 6.03 0.11 | – | 0.172 0.004 | 0.303 0.004 |
| 3.56 SE | 0.91 0.17 | 0.86 0.18 | 4.59 0.12 | – | 0.148 0.004 | 0.304 0.004 |
| 6.84 SE | 1.20 0.20 | 0.39 0.20 | 3.84 0.14 | 0.68 0.19 | 0.174 0.005 | 0.329 0.005 |
| 11.80 SE | 1.31 0.22 | 0.58 0.22 | 3.33 0.15 | 1.28 0.22 | 0.138 0.006 | 0.298 0.006 |
| 20.21 SE | 1.22 0.23 | 0.26 0.22 | 3.36 0.16 | 1.08 0.23 | 0.148 0.006 | 0.294 0.006 |
| 1.08 NW | 1.11 0.16 | 0.91 0.17 | 6.31 0.11 | – | 0.178 0.004 | 0.322 0.004 |
| 3.54 NW | 1.02 0.17 | 0.73 0.18 | 5.41 0.12 | – | 0.164 0.004 | 0.317 0.004 |
| 6.81 NW | 1.23 0.20 | 1.05 0.21 | 4.51 0.14 | 0.61 0.18 | 0.168 0.005 | 0.330 0.005 |
| 11.78 NW | 0.94 0.20 | 0.62 0.22 | 3.91 0.15 | 1.19 0.21 | 0.147 0.006 | 0.304 0.006 |
| 20.19 NW | 1.06 0.21 | 0.74 0.22 | 3.32 0.16 | 1.28 0.23 | 0.125 0.006 | 0.291 0.006 |
-
Columns 6 and 7: mag unity.
| (Å) indices | ||||||||
|---|---|---|---|---|---|---|---|---|
| R (arcsec) | Fe4383 | Ca4455 | Fe4531 | Fe4668 | Mg b | Fe5270 | Fe5335 | Fe5406 |
| 0.00 | 7.09 0.63 | 2.39 0.48 | 3.84 0.54 | 8.46 0.66 | 5.44 0.39 | 2.60 0.30 | 2.86 0.43 | 2.09 0.29 |
| 2.17 SW | 5.80 0.84 | 2.39 0.48 | 3.67 0.69 | 8.84 0.86 | 4.92 0.47 | 2.59 0.38 | 2.48 0.54 | 1.98 0.37 |
| 4.90 SW | 4.99 1.17 | 2.67 0.71 | 2.17 0.90 | 6.64 1.16 | 4.07 0.55 | 1.88 0.49 | 2.49 0.67 | 1.95 0.47 |
| 9.41 SW | 6.68 1.66 | 2.42 0.95 | 3.61 1.25 | 7.21 1.60 | 5.51 0.76 | 3.40 0.70 | 3.03 0.98 | 2.33 0.70 |
| 2.19 NE | 6.95 0.86 | 2.56 0.61 | 3.27 0.69 | 8.68 0.87 | 5.03 0.48 | 2.61 0.39 | 3.24 0.58 | 1.99 0.38 |
| 4.92 NE | 5.32 1.25 | 2.40 0.74 | 3.43 0.97 | 7.56 1.23 | 5.53 0.60 | 2.59 0.53 | 2.66 0.74 | 2.01 0.52 |
| 9.43 NE | 4.27 1.75 | 1.90 0.69 | 1.80 1.16 | 4.12 1.51 | 4.38 0.63 | 1.39 0.63 | 1.56 0.77 | 1.49 0.56 |
| (Å) and (mag) indices | ||||||
|---|---|---|---|---|---|---|
| R (arcsec) | Fe5709 | Fe5782 | Na D | H | Mg1 | Mg2 |
| 0.00 | 1.08 0.25 | 0.87 0.27 | 6.74 0.21 | – | 0.183 0.007 | 0.285 0.007 |
| 2.17 SW | 0.91 0.29 | 1.15 0.34 | 5.85 0.25 | – | 0.172 0.008 | 0.306 0.008 |
| 4.90 SW | 0.95 0.36 | 1.21 0.42 | 5.41 0.31 | – | 0.178 0.010 | 0.348 0.011 |
| 9.41 SW | 0.90 0.47 | 0.76 0.55 | 2.04 0.40 | 0.88 0.56 | 0.168 0.012 | 0.333 0.014 |
| 2.19 NE | 0.95 0.30 | 1.26 0.35 | 5.52 0.25 | – | 0.179 0.008 | 0.303 0.009 |
| 4.92 NE | 1.25 0.39 | 1.42 0.46 | 3.93 0.32 | – | 0.183 0.011 | 0.460 0.012 |
| 9.43 NE | 1.18 0.45 | 1.30 0.50 | 2.90 0.38 | 0.73 0.54 | 0.157 0.012 | 0.301 0.014 |
-
Columns 6 and 7: mag unity.
| (Å) indices | ||||||||
|---|---|---|---|---|---|---|---|---|
| R (arcsec) | Fe4383 | Ca4455 | Fe4531 | Fe4668 | Mg b | Fe5270 | Fe5335 | Fe5406 |
| 0.00 | 5.25 0.35 | 2.65 0.36 | 3.41 0.35 | 9.22 0.41 | 4.93 0.25 | 2.84 0.20 | 2.42 0.26 | 1.83 0.18 |
| 1.09 S | 5.28 0.38 | 2.82 0.41 | 3.28 0.36 | 8.37 0.44 | 5.16 0.27 | 2.68 0.22 | 2.28 0.30 | 1.60 0.19 |
| 3.55 S | 5.22 0.48 | 2.71 0.47 | 3.59 0.44 | 7.50 0.53 | 5.47 0.34 | 2.80 0.27 | 2.87 0.39 | 1.30 0.24 |
| 7.10 S | 5.05 0.58 | 2.70 0.55 | 4.11 0.53 | 7.38 0.65 | 5.45 0.41 | 3.35 0.33 | 3.14 0.51 | 1.14 0.29 |
| 13.21 S | 5.26 0.68 | 2.72 0.59 | 3.59 0.59 | 5.82 0.73 | 5.42 0.44 | 3.01 0.37 | 2.25 0.52 | 0.51 0.30 |
| 1.09 N | 5.27 0.36 | 2.50 0.35 | 3.47 0.36 | 9.12 0.43 | 5.06 0.26 | 3.12 0.21 | 2.65 0.28 | 1.84 0.18 |
| 3.55 N | 4.60 0.45 | 2.63 0.44 | 3.76 0.43 | 8.42 0.52 | 4.99 0.32 | 3.10 0.26 | 2.56 0.36 | 1.81 0.24 |
| 7.10 N | 4.68 0.53 | 2.23 0.45 | 3.92 0.51 | 7.95 0.61 | 4.71 0.35 | 3.06 0.30 | 3.42 0.45 | 1.45 0.27 |
| 13.21 N | 4.49 0.66 | 2.53 0.55 | 4.70 0.60 | 7.36 0.72 | 4.35 0.41 | 3.60 0.37 | 3.26 0.55 | 1.35 0.32 |
| (Å) and (mag) indices | ||||||
|---|---|---|---|---|---|---|
| R (arcsec) | Fe5709 | Fe5782 | Na D | H | Mg1 | Mg2 |
| 0.00 | 0.81 0.18 | 0.66 0.19 | 5.06 0.13 | 1.56 0.19 | 0.155 0.005 | 0.345 0.005 |
| 1.09 S | 0.98 0.19 | 0.51 0.20 | 5.11 0.14 | 1.46 0.19 | 0.157 0.005 | 0.338 0.005 |
| 3.55 S | 1.09 0.23 | 0.58 0.25 | 4.82 0.17 | 1.79 0.24 | 0.191 0.005 | 0.359 0.006 |
| 7.10 S | 0.88 0.26 | 0.91 0.30 | 4.47 0.21 | 1.41 0.27 | 0.147 0.006 | 0.334 0.007 |
| 13.21 S | 0.05 0.26 | -0.18 0.28 | 4.26 0.23 | 1.43 0.30 | 0.153 0.007 | 0.311 0.008 |
| 1.09 N | 0.94 0.19 | 0.68 0.20 | 4.99 0.13 | 1.54 0.19 | 0.173 0.005 | 0.356 0.005 |
| 3.55 N | 0.87 0.22 | 0.67 0.24 | 4.39 0.16 | 1.66 0.23 | 0.184 0.006 | 0.353 0.006 |
| 7.10 N | 0.80 0.24 | 0.83 0.28 | 4.48 0.19 | 1.52 0.25 | 0.150 0.006 | 0.319 0.007 |
| 13.21 N | 0.55 0.27 | 0.77 0.32 | 3.99 0.23 | 1.02 0.28 | 0.140 0.007 | 0.306 0.008 |
-
Columns 6 and 7: mag unity.
| (Å) indices | ||||||||
|---|---|---|---|---|---|---|---|---|
| R (arcsec) | Fe4383 | Ca4455 | Fe4531 | Fe4668 | Mg b | Fe5270 | Fe5335 | Fe5406 |
| 0.00 | 5.33 0.42 | 2.88 0.44 | 3.05 0.39 | 8.33 0.48 | 5.10 0.30 | 2.50 0.24 | 2.60 0.33 | 1.67 0.22 |
| 1.09 E | 5.93 0.45 | 2.95 0.46 | 3.11 0.41 | 7.85 0.50 | 4.91 0.31 | 2.51 0.25 | 2.57 0.36 | 1.49 0.23 |
| 3.55 E | 5.43 0.58 | 2.64 0.53 | 2.70 0.49 | 6.72 0.62 | 4.66 0.37 | 2.88 0.32 | 3.05 0.48 | 1.31 0.29 |
| 6.93 E | 4.19 0.79 | 2.13 0.60 | 2.70 0.64 | 2.59 0.80 | 4.66 0.49 | 4.03 0.45 | 2.32 0.61 | 1.44 0.41 |
| 12.50 E | 2.90 0.94 | 2.40 0.72 | 1.90 0.74 | 8.03 1.02 | 3.99 0.55 | 3.54 0.51 | 2.46 0.73 | 0.58 0.43 |
| 1.09 W | 5.42 0.44 | 2.74 0.44 | 3.08 0.41 | 7.96 0.50 | 5.23 0.31 | 2.48 0.25 | 2.68 0.35 | 1.84 0.23 |
| 3.55 W | 4.77 0.54 | 2.94 0.54 | 2.98 0.48 | 6.41 0.60 | 5.02 0.38 | 2.69 0.31 | 2.80 0.46 | 1.54 0.29 |
| 6.93 W | 4.66 0.72 | 2.56 0.56 | 2.24 0.61 | 3.83 0.79 | 5.01 0.45 | 2.09 0.39 | 2.69 0.56 | 1.42 0.36 |
| 12.50 W | 2.57 0.88 | 1.45 0.51 | 2.02 0.73 | -4.62 0.94 | 4.33 0.49 | 3.10 0.47 | 2.92 0.64 | 0.84 0.40 |
| (Å) and (mag) indices | ||||||
|---|---|---|---|---|---|---|
| R (arcsec) | Fe5709 | Fe5782 | Na D | H | Mg1 | Mg2 |
| 0.00 | 0.68 0.20 | 0.50 0.22 | 4.74 0.15 | 1.11 0.20 | 0.178 0.005 | 0.366 0.006 |
| 1.09 E | 0.75 0.21 | 0.54 0.23 | 4.85 0.16 | 1.19 0.21 | 0.180 0.006 | 0.360 0.006 |
| 3.55 E | 1.17 0.27 | 0.31 0.28 | 4.55 0.21 | 1.08 0.25 | 0.169 0.007 | 0.326 0.007 |
| 6.93 E | 0.76 0.32 | 0.83 0.38 | 4.61 0.28 | 2.27 0.36 | 0.148 0.008 | 0.331 0.009 |
| 12.50 E | 0.17 0.35 | -0.09 0.39 | 4.53 0.32 | 1.52 0.40 | 0.158 0.009 | 0.341 0.010 |
| 1.09 W | 0.90 0.16 | 0.62 0.23 | 4.46 0.08 | 1.26 0.21 | 0.172 0.006 | 0.363 0.006 |
| 3.55 W | 0.84 0.20 | 0.70 0.28 | 4.32 0.10 | 1.31 0.25 | 0.163 0.007 | 0.345 0.007 |
| 6.93 W | 0.08 0.28 | 0.65 0.34 | 3.95 0.25 | 1.57 0.33 | 0.159 0.008 | 0.340 0.009 |
| 12.50 W | 0.89 0.35 | -0.02 0.36 | 4.43 0.29 | 1.40 0.38 | 0.148 0.009 | 0.283 0.0010 |
-
Columns 6 and 7: mag unity.
3.4 External comparisons of some Lick indices
In order to compare our measurements of the nuclear Lick indices, they must be corrected by the aperture effect as the central velocity dispersion was (see Subsection 2.2 and Jorgensen 1997). The adopted logarithmic radial gradients of the indices ( INDEX = or ) were = -0.050 including Fe except = -0.080, = 0, = -0.090, and = = -0.038 mag.dex-1.
The central Lick indices of both galaxies from the current work are shown in Table 17, in which the mean literature values of some indices are also presented from several sources: Terlevich et al. (1981), Davies et al. (1987), Burstein et al. (1988), Couture & Hardy (1988), Faber et al. (1989), Worthey, Faber & Gonzalez (1992), Carollo, Danziger & Buson (1993), Huchra et al. (1996) (all for Mg only), Trager et al. (1998) (not for Mg2), Beuing et al. (2002) and Thomas et al. (2005) (only for Mg b, Fe and H) for NGC 1052 and Bertin et al. (1994), Golev & Prugniel (1998) (both for Mg only), Beuing et al. (2002) and Thomas et al. (2005) (only for Mg b, Fe and H) for NGC 7796.
The estimate of the nuclear Mg2 based on the Mg- relation was made with the results of Bender, Burstein & Faber (1993). The predictions, using (NGC 1052) = 204 km.s-1 and (NGC 7796) = 253 km.s-1, are very near to our measurements: Mg = 0.296 mag and Mg = 0.315 mag, respectively for NGC 1052 and NGC 7796. Note that the literature values of Mg of NGC 7796 are smaller than our value and predicted one (see Tab. 1 and Tab. 17).
For all indices, the agreements with the literature values are good considering both errors. Note that the published Lick indices are non fully corrected (by the aperture effect and emission lines).
| (Å) and (mag) indices | ||||
|---|---|---|---|---|
| NGC 1052 | NGC 7796 | |||
| Index | our | literature | our | literature |
| Fe43830 | 5.62 0.30 | 6.11 0.45 | 4.97 0.35 | – |
| Ca44550 | 2.36 0.30 | 2.10 0.21 | 2.66 0.36 | – |
| Fe45310 | 3.36 0.47 | 3.62 0.30 | 3.22 0.35 | – |
| Fe46680 | 7.65 0.35 | 8.50 0.44 | 8.45 0.41 | – |
| Mg b0 | 3.83 0.23 | 5.63 0.14 | 4.67 0.25 | 5.20 0.25 |
| Fe52700 | 2.25 0.17 | 2.81 0.04 | 2.69 0.20 | 3.63 0.05 |
| Fe53350 | 2.39 0.21 | 2.74 0.07 | 2.30 0.26 | 2.98 0.06 |
| Fe54060 | 1.85 0.15 | 1.82 0.02 | 1.73 0.18 | 1.87 0.05 |
| Fe57090 | 1.00 0.16 | 0.98 0.02 | 0.76 0.18 | 1.01 0.04 |
| Fe57820 | 0.90 0.17 | 0.93 0.02 | 0.62 0.19 | 1.02 0.04 |
| Na D0 | 5.52 0.11 | 6.10 0.03 | 4.58 0.13 | 5.48 0.06 |
| Fe | 2.32 0.21 | 2.78 0.02 | 2.49 0.33 | 3.04 0.37 |
| H0 | – | 1.22 ? | 1.57 0.19 | 1.64 0.16 |
| Mg | 0.1490.004 | 0.1930.001 | 0.1370.005 | 0.1650.002 |
| Mg | 0.2930.004 | 0.3030.017 | 0.3260.005 | 0.2670.051 |
4 Radial gradients of the Lick indices
The calibrated/corrected Lick indices (except Fe5015) of the aperture spectra along both axes are shown in Tables 9 to 12 for NGC 1052 and Tables 13 to 16 for NGC 7796.
The Lick indices for which we have measured their radial gradients along both axes of two galaxies are Fe4383, Ca4455, Fe4531, Fe4668, Mg b, Fe5270, Fe5335, Fe, Fe5406, Fe5709, Fe5782 and Na D (including H, Mg1 and Mg2 for NGC 7796). The Fe index is an average value of two iron indices: Fe = (Fe5270+Fe5335) 2.
For the major axis of NGC 1052, we have used the aperture spectra up to r = 20.2 arcsec and for its minor axis up to 9.4 arcsec. For the major and minor axes of NGC 7796, we have used the spectra up to r = 13.2 and 12.5 arcsec respectively (all data).
Some atomic line-strengths are contaminated by molecular absorption, such as Fe4383 that is influenced by CH lines and Fe4668 by C2 lines of the Swan System (Tripicco & Bell 1995). Thomas, Maraston & Bender (2003a) re-called Fe4668 as C24668. However they affirmed that Fe4383 index is still very sensitive to the iron abundance.
The blue continuum of Na D index is partially contaminated by the same Sodium absorption of the interestellar medium of the Galaxy, but this influence performs equally for all spectra.
The distances to the galaxy center are normalized by the effective radius that is corrected considering the apparent ellipticity , so that = (1-)-1/2 at the major axis direction or = (1-)1/2 at the minor one (Davies, Sadler & Peletier 1993 and Kobayashi & Arimoto 1999).
We have computed the radial gradients of the Lick indices as a function of the logarithm of the normalized radius through a linear regression fit,
where = = is the linear regression constant. The linear fits are computed by the least square method that takes into account the data errors only on the Lick indices (like Kobayashi & Arimoto 1999).
In Table 18, we have shown the respective results of the fits: the own radial gradients and the index values at one .
In Figures 5, 6 and 7, the Lick indices as a function of the logarithm of the normalized radius along both axes are shown with their respective linear fits for NGC 1052. Figure 5 has the gradients of Fe4383, Fe4531, Fe4668, Fe5270, Fe5335 and Fe. Figure 6 shows the gradients of Fe5406, Fe5709, Fe5782, Ca4455, Mg b and Na D. Figure 7 presents the radial gradients of Mg1 and Mg2.
In Figures 8, 9 and 10, the Lick indices as a function of the logarithm of the normalized radius along both axes are presented with their respective linear fits for NGC 7796. Figure 8 has the gradients of Fe4383, Fe4531, Fe4668, Fe5270, Fe5335 and Fe. Figure 9 shows the gradients of Fe5406, Fe5709, Fe5782, Ca4455, Mg b and Na D. Figure 10 presents the radial gradients of H, Mg1 and Mg2.


| Gradients and Linear constants | ||||
|---|---|---|---|---|
| Lick Index | NGC 1052 | NGC 7796 | ||
| (Å.dex-1) | (Å) | (Å.dex-1) | (Å) | |
| Fe4383 | -0.81 0.24 | 5.16 0.26 | -0.44 0.39 | 4.65 0.38 |
| -2.04 0.64 | 3.99 0.59 | -2.17 0.50 | 3.09 0.47 | |
| Fe4531 | -0.29 0.24 | 3.25 0.26 | +0.72 0.39 | 4.31 0.38 |
| -1.57 0.64 | 1.70 0.59 | -0.92 0.50 | 1.99 0.47 | |
| Fe4668 | -1.34 0.24 | 6.80 0.26 | -1.73 0.39 | 6.52 0.38 |
| -5.15 0.64 | 3.08 0.59 | -5.80 0.50 | 0.97 0.47 | |
| Fe5270 | +0.38 0.24 | 3.00 0.26 | +0.34 0.39 | 3.33 0.38 |
| -0.67 0.64 | 1.82 0.59 | +0.67 0.50 | 3.32 0.47 | |
| -0.56 0.27 | – | – | – | |
| Fe5335 | -0.23 0.24 | 2.20 0.26 | +0.53 0.39 | 3.19 0.38 |
| -0.98 0.64 | 1.78 0.59 | +0.06 0.50 | 2.75 0.47 | |
| Fe | +0.07 0.23 | 2.61 0.25 | +0.44 0.39 | 3.26 0.38 |
| -0.82 0.64 | 1.80 0.59 | +0.37 0.73 | 3.04 0.69 | |
| Fe5406 | -0.11 0.24 | 1.77 0.26 | -0.63 0.39 | 0.94 0.38 |
| -0.17 0.64 | 1.81 0.59 | -0.64 0.50 | 0.90 0.47 | |
| Fe5709 | +0.12 0.24 | 1.19 0.26 | -0.50 0.50 | 0.41 0.53 |
| +0.26 0.64 | 1.23 0.59 | -0.34 0.50 | 0.49 0.47 | |
| Fe5782 | -0.30 0.24 | 0.45 0.26 | -0.41 0.39 | 0.49 0.38 |
| -0.10 0.64 | 1.12 0.59 | -0.34 0.50 | 0.49 0.47 | |
| Ca4455 | 0.00 0.49 | 2.44 0.50 | -0.10 0.80 | 2.51 0.74 |
| -0.51 1.08 | 1.97 0.95 | -0.89 0.91 | 1.84 0.78 | |
| Mg b | -0.38 0.18 | 4.44 0.19 | -0.18 0.58 | 4.93 0.55 |
| -0.28 0.89 | 4.63 0.80 | -0.63 0.70 | 4.32 0.64 | |
| Na D | -2.34 0.19 | 2.47 0.20 | -0.81 0.31 | 3.98 0.30 |
| -4.60 0.49 | 0.73 0.45 | -0.31 0.39 | 4.24 0.36 | |
| -4.01 0.14 | – | – | – | |
| H | – | – | -0.17 0.40 | 1.35 0.38 |
| – | – | +0.38 0.50 | 1.68 0.47 | |
| (mag.dex-1) | (mag) | (mag.dex-1) | (mag) | |
| Mg1 | -0.0280.004 | 0.1320.004 | -0.0180.011 | 0.1490.010 |
| -0.0150.016 | 0.1620.014 | -0.0240.013 | 0.1460.011 | |
| -0.0740.004 | – | – | – | |
| Mg2 | -0.0070.004 | 0.3040.004 | -0.0310.011 | 0.3120.010 |
| +0.0730.017 | 0.4000.016 | -0.0430.013 | 0.3070.012 | |
| -0.0740.004 | – | – | – | |
| -0.0610.019 | – | – | – | |
| -0.0680.029 | – | – | – | |
-
Columns 3 and 5: the linear regression constant of the fitting that represents the Lick index at one effective radius.
-
For Fe5270, Na D, Mg1 and Mg2, the third line shows their gradients measured in NGC 1052 by Carollo, Danziger & Buson (1993).
-
For Mg2 only, the fourth and fifth lines show the gradients measured respectively along the major and minor axis of NGC 1052 by Couture & Hardy (1988).
For NGC 1052, the majority of the gradients of the iron indices are practically zero considering their errors: Fe4531, Fe5335, Fe, Fe5406 and Fe5709 along the major axis and Fe5270, Fe5406, Fe5709 and Fe5782 along the minor axis. One of them is positive: that of Fe5270 at major axis. The Mg b, Mg1 and Mg2 gradients are actually negative. The Mg2 minor axis gradient was seriously affected by the emission line corrections for the aperture spectrum at r = 4.92 arcsec (see Tables 12 and 18). However, the Mg1 and Mg2 gradients are less stronger than the average ones for ellipticals (-0.038 mag.dex-1 as denoted by Jorgensen 1997) and the gradients of other Fe indices are still negative. The Ca4455 gradient is also zero along both axes. The Na D gradient is strongly negative at both axes and it is greater than the Mg b one. The Na D is probably contaminated by the interstellar absorption of NGC 1052 which should increase inwards. If Fe4383 and Fe4668 are actually contaminated by CH and C2 lines respectively, we would propose that might exist a negative radial gradient of the Carbon stellar abundance in NGC 1052.
For NGC 7796, the gradients of the Lick indices along the major axis are equal to the other ones along the minor axis for the majority of them. The exceptions are for Fe4383, Fe4531, Fe4668 and marginally H. Considering both directions and the uncertainties of the gradients, the majority of them for the iron indices are zero or positive (Fe4531, Fe5270, Fe5335, Fe, Fe5709 and Fe5782), while the Mg b gradient is zero and the Mg1 and Mg2 gradients are negative. However, the gradients of Fe4383, Fe4668 and Fe5406 are still negative. The Ca4455 gradient is zero. The Na D gradient is negative. The Na D can be contaminated by own internal interstellar absorption of NGC 7796 like NGC 1052. Due to the contribution of molecular lines in Fe4383 and Fe4668, a negative gradient of the Carbon stellar abundance can also be proposed for NGC 7796. The mean H gradient is also zero.
In order to derive the radial variations of the abundance ratios, we have analyzed the index variations directly on the index-index planes, where the direction of the vector age-metallicity-abundance ratio can be modeled properly (see Sect. 5). The stellar population synthesis helps to disentangle the age-metallicity degeneracy of the Lick indices as well (see Sect. 6).
4.1 External comparisons of some radial gradients
Couture & Hardy (1988) have measured the Mg2 gradient along both axes of NGC 1052 and their data are plotted in comparison with ours in Figure 7. The agreement is marginal because the errors of the Couture & Hardy (1988)’s measurements are greater. The Mg2 gradients measured by them are different from ours (see Tab. 18). The same exists when a comparison is made with the Mg2 gradient measured by Carollo, Danziger & Buson (1993) along the E-W direction. Carollo et al. (1993) have also computed the gradients of Fe5270, Na D and Mg1 along the same direction. Despite some agreement for the radial variation of them in the plots of Fig. 5 (Fe5270), Fig. 6 (Na D) and Fig. 7 (Mg1 and Mg2), the computed gradients are different of ours (Tab. 18). For Mg1 and Mg2 only, Carollo et al. (1993) should not have applied the emission line corrections.
No radial gradient of Lick index has already been quantified for NGC 7796. Bertin et al. (1994) have measured the radial profile of Mg2 along the major axis whose direct comparison with our data is presented in Figure 10. There is a systematic difference between the Bertin et al. (1994)’s data and our measurements ( -0.113 mag) although the Mg2 computed gradient using their data is very near to our result: -0.031 0.013 mag.dex-1. Note that the predicted Mg for NGC 7796 by the Mg- relation of Bender, Burstein & Faber (1993) is greater than that one using the observations of Bertin et al. (1994).
5 Comparisons with single-aged stellar population models
The single-aged stellar population (SSP) models of Thomas, Maraston & Bender (2003a), hereafter as TMB (2003a), have been adopted in order to make predictions about the spatial distribution of the stellar populations inside the observed regions of each galaxy in terms of chemical abundances and age. We have made direct comparisons of the measured Lick indices of each aperture spectrum with the theoretical ones of these SSP models.
The SSP models of TMB (2003a) are built using the evolutive stellar population synthesis of Maraston (1998). The main characteristic of the code of TMB (2003a) is to compute the influence of the abundance variations on the Lick indices, although this code uses the evolutive models of Maraston (1998) which are essentially based on the solar abundance ratios. The Lick indices of these SSP models are computed adopting the stellar fitting functions of Worthey (1994) and the response functions of Tripicco & Bell (1995). The abundance variations are only considered for the alpha-elements like Magnesium.
The TMB (2003a)’s SSP models assuming the IMF of Salpeter (1955) have been employed. We have used the SSP models with five ages (2, 6, 10, 12 and 15 Gyr), six global metallicities ([Z/Z⊙] = -2.25, -1.35, -0.33, 0.00, +0.35, +0.67 dex) and four alpha-element to iron ratios ([/Fe] = -0.3, 0.0, +0.3, +0.5 dex).
We have plotted, on planes Lick index versus Lick index, our data of all aperture spectra of NGC 1052 and NGC 7796 with the theoretical ones of TMB’s SSP models.
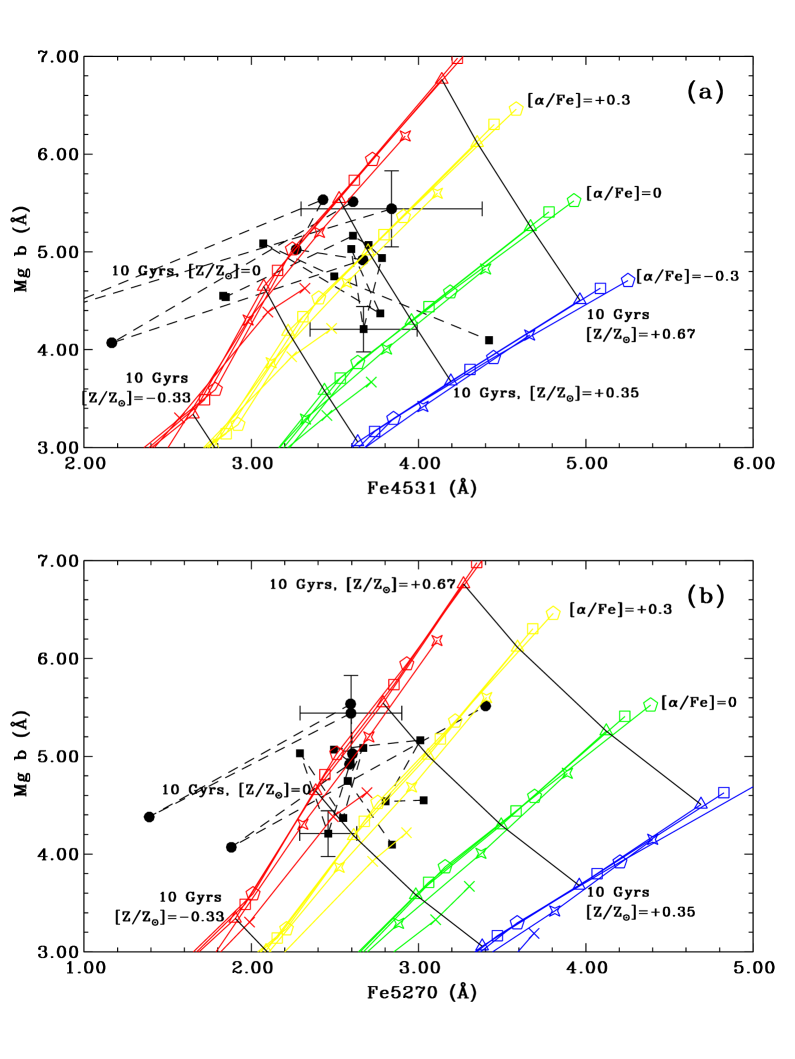
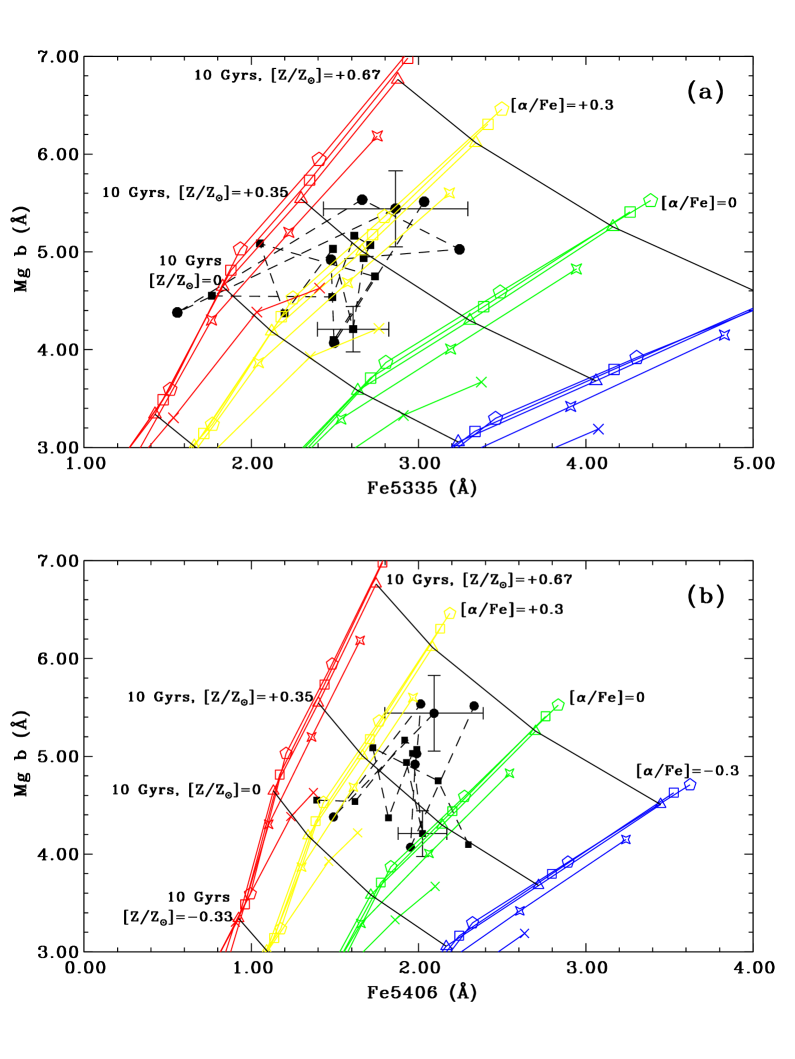
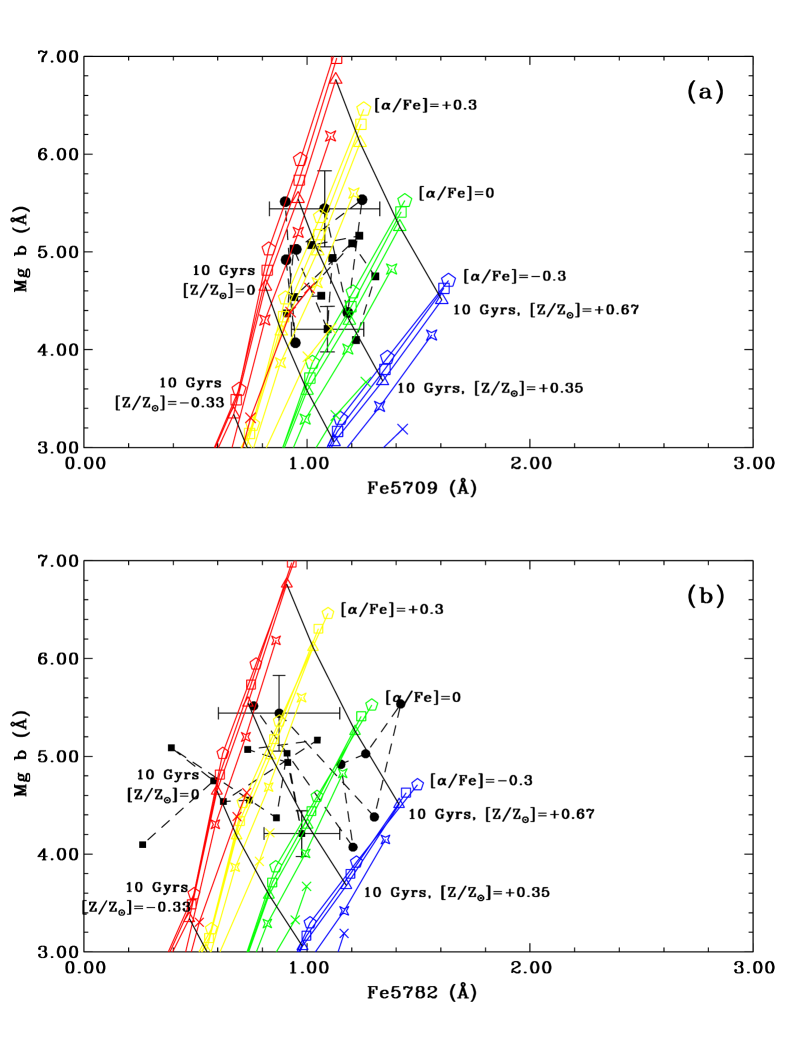
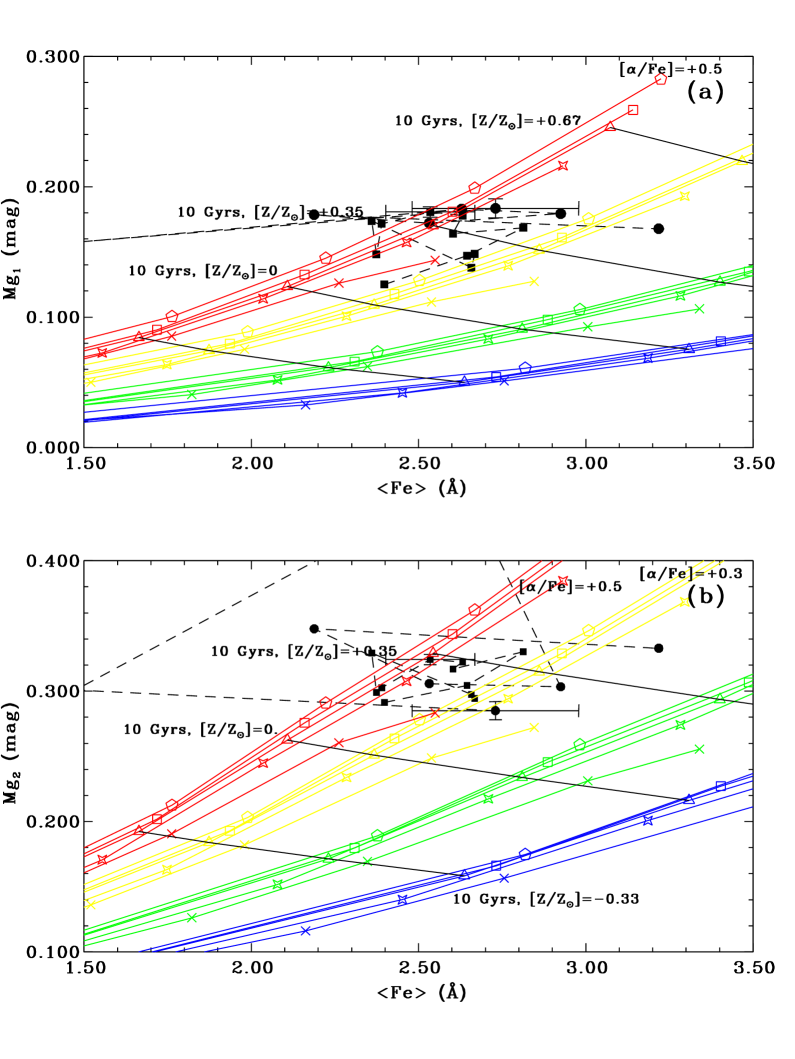
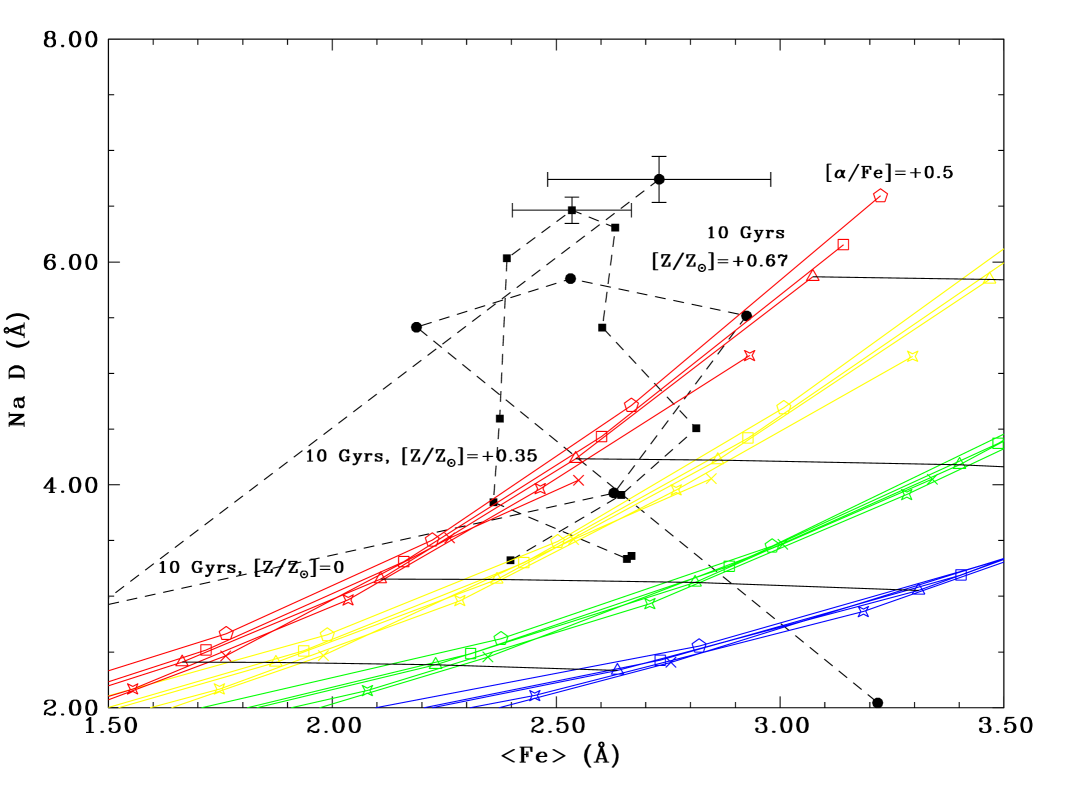
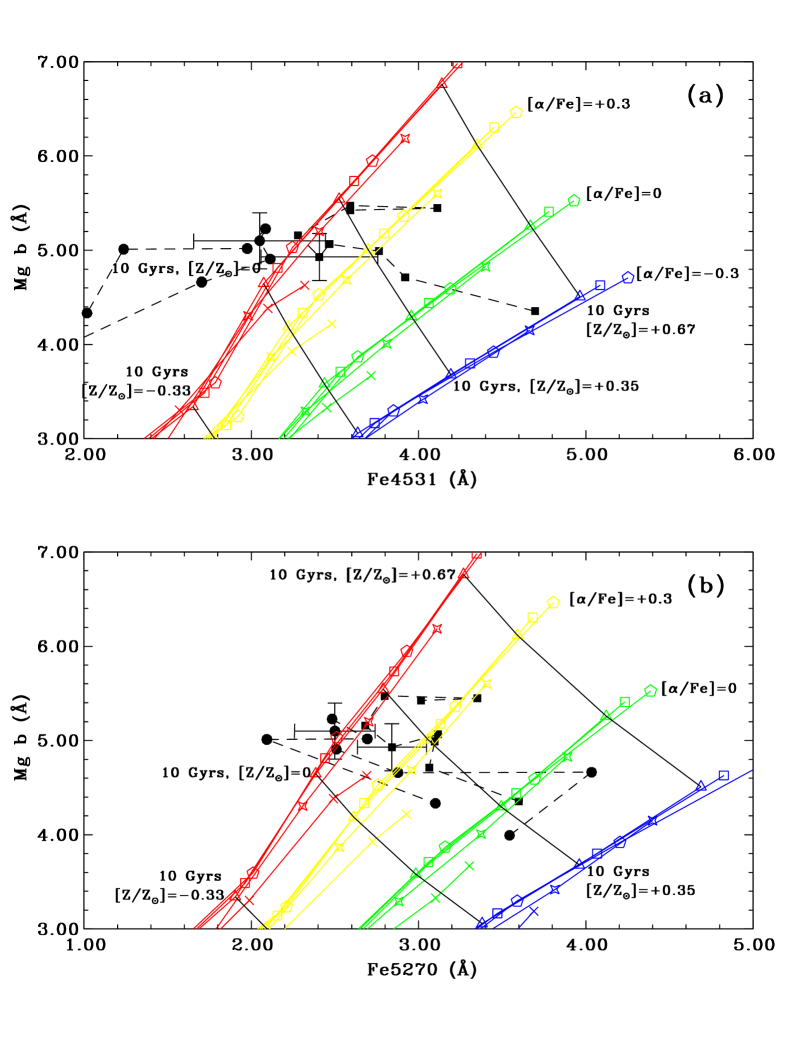
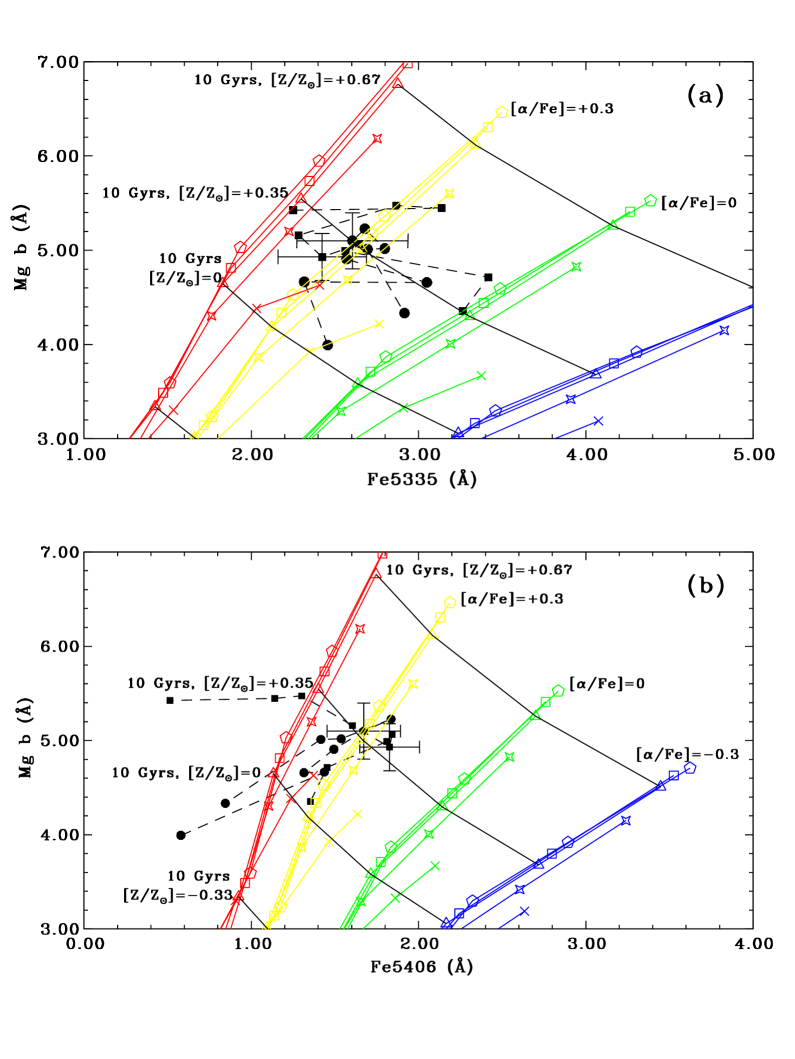
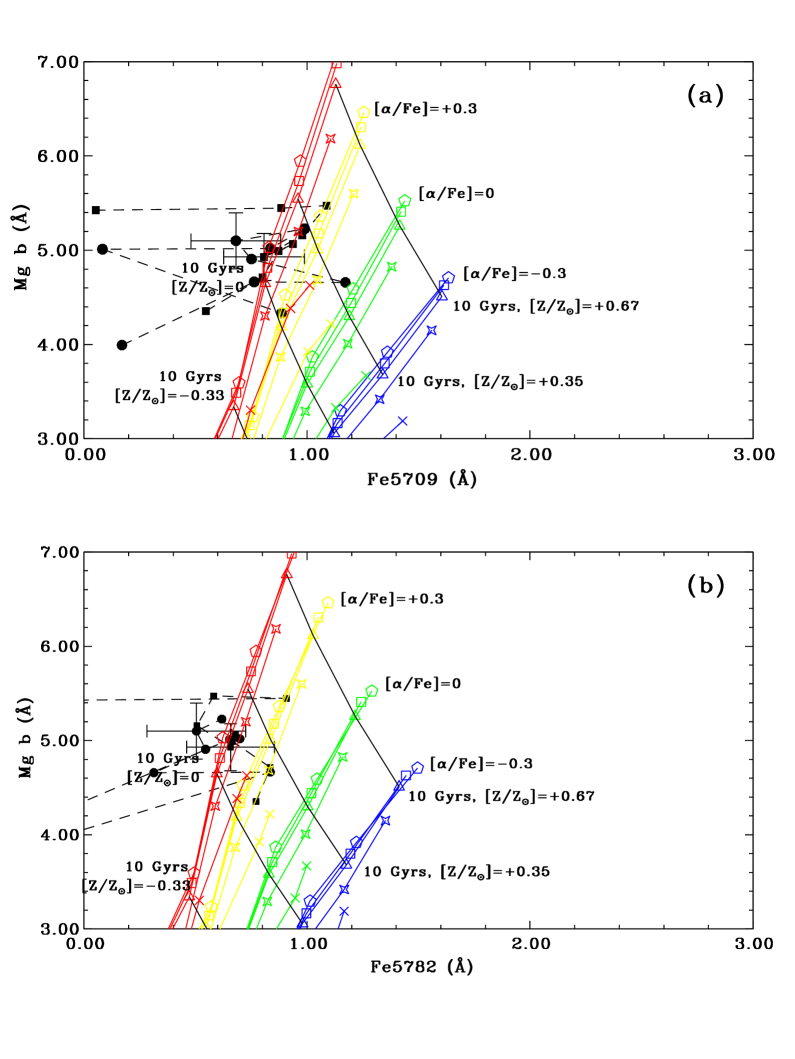
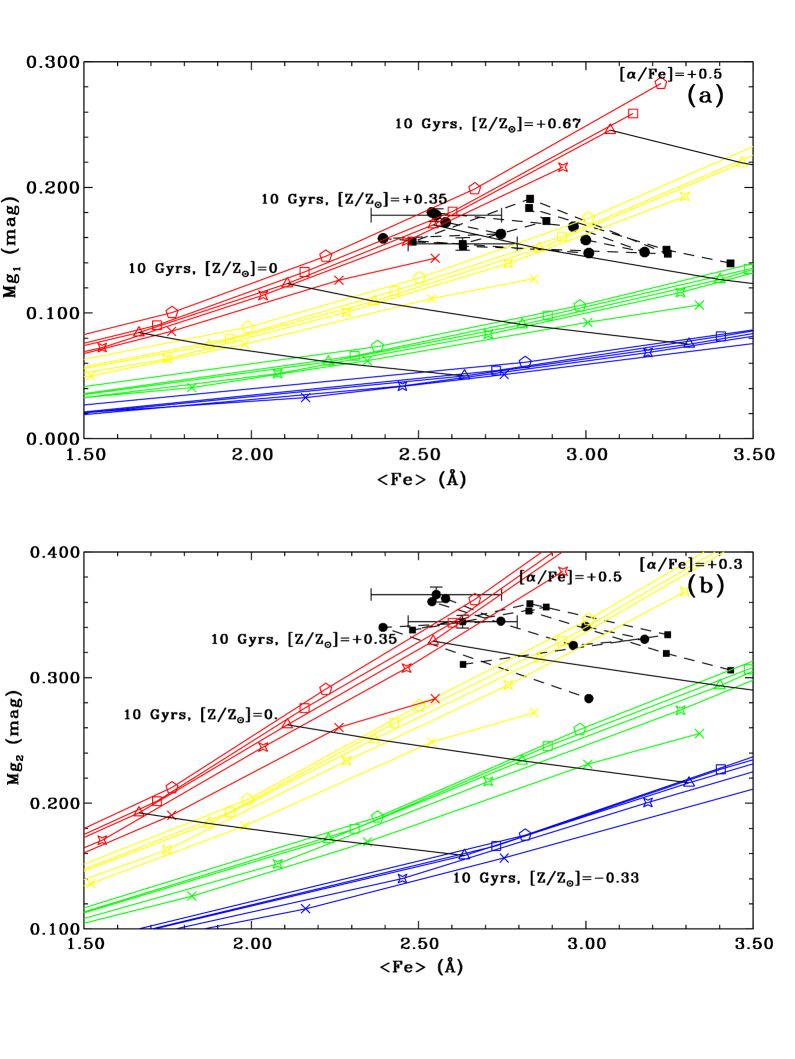
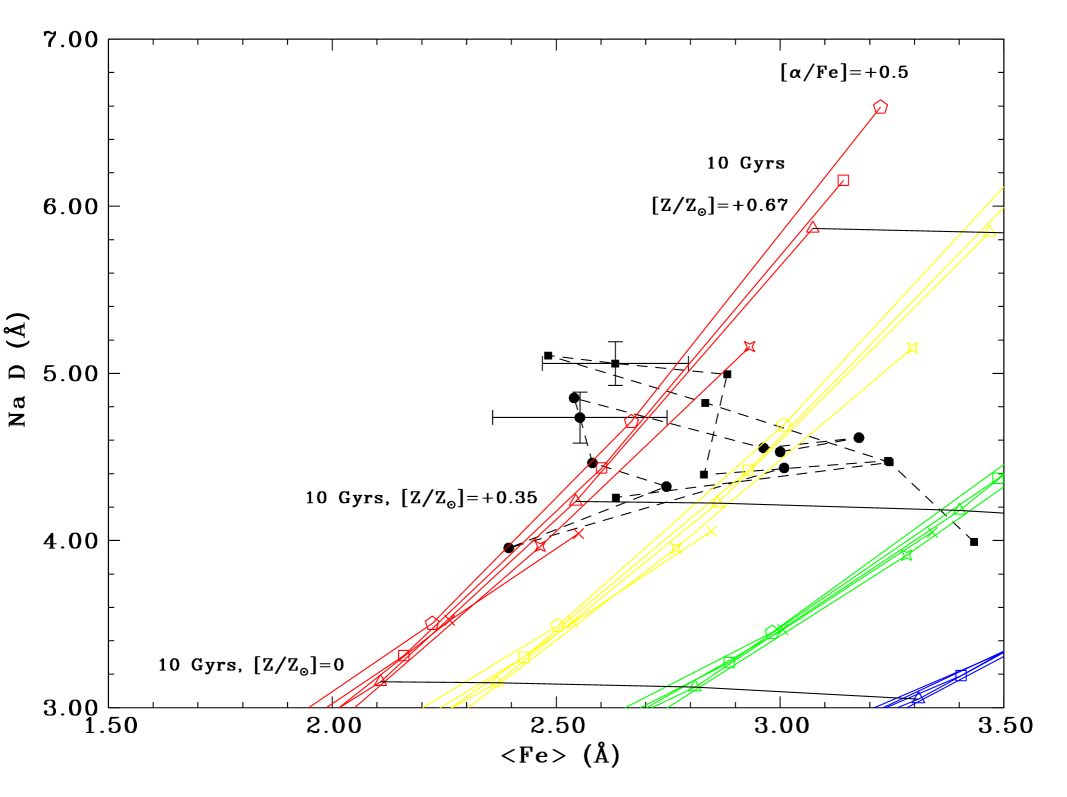
For NGC 1052, Figs. 11a/b, 12a/b and 13a/b show the Mg b index plotted versus some iron index: Mg b versus Fe4531 in Fig. 11a, Mg b versus Fe5270 in Fig. 11b, Mg b versus Fe5335 in Fig. 12a, Mg b versus Fe5406 in Fig. 12b, Mg b versus Fe5709 in Fig. 13a and Mg b versus Fe5782 in Fig. 13b. Figures 14a and 14b show Mg1 versus Fe and Mg2 versus Fe respectively. Figure 15 shows Na D versus Fe.
The Ca4455, Fe4383 and Fe4668 indices were not adopted because they are blended with other absorption lines: Ca4455 with atomic lines of Fe and Cr as TMB (2003a), and Fe4383 and Fe4668 with molecular lines of C2 and CH respectively.
For NGC 7796, Figs. 17a/b, 18a/b and 19a/b show respectively the same plots of Mg b index versus an iron index as for NGC 1052. Figures 20a and 20b show Mg1 versus Fe and Mg2 versus Fe respectively. Figure 21 shows Na D versus Fe respectively.
The plots present an element abundance indicator (Mg b, Mg1 and Mg2 for Magnesium and Na D for Sodium) versus an iron abundance indicator (Fe4531, Fe5270, Fe5335, Fe5408, Fe5709, Fe5782 and Fe). In all these plots, the predicted Lick indices of the SSPs are localized in four curve families, each one with a different -element/Fe ratio. Each curve family presents Lick indices of the SSPs with five ages and six metallicities that are distributed with very small dispersion in some restricted area (the age-metallicity degeneracy of Lick indices). The present index errors correspond to an mean imprecision of 0.1 dex for the [/Fe] determination in that plots.
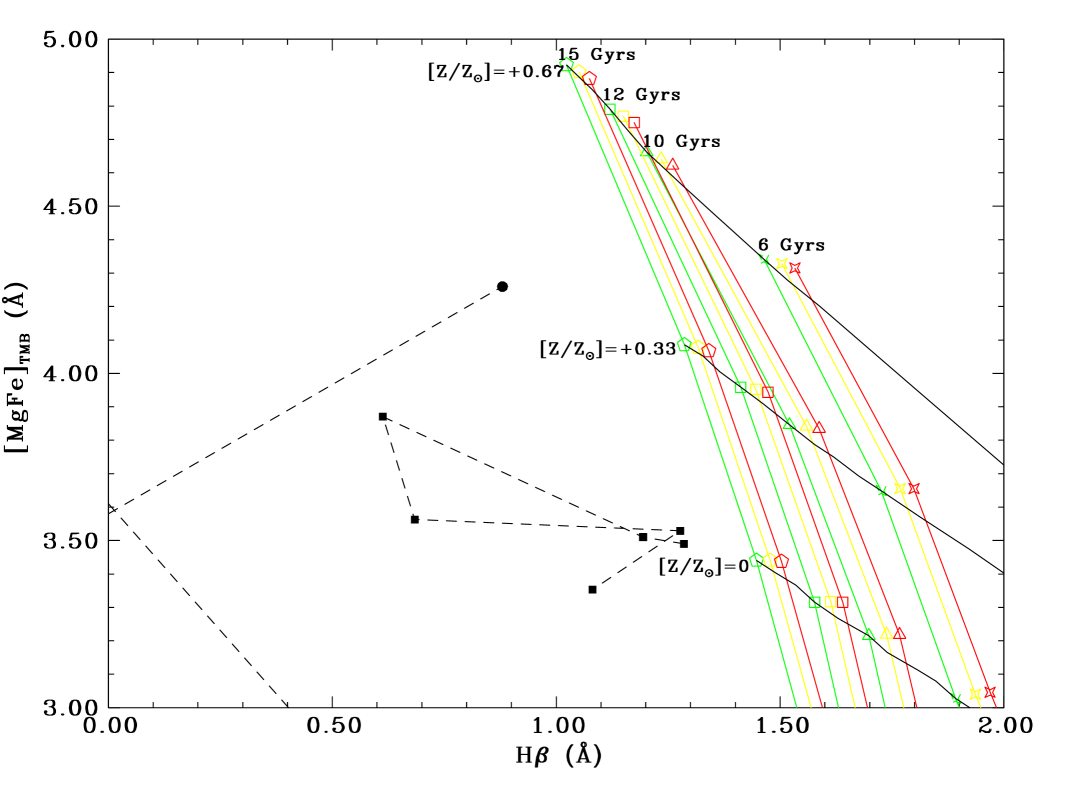
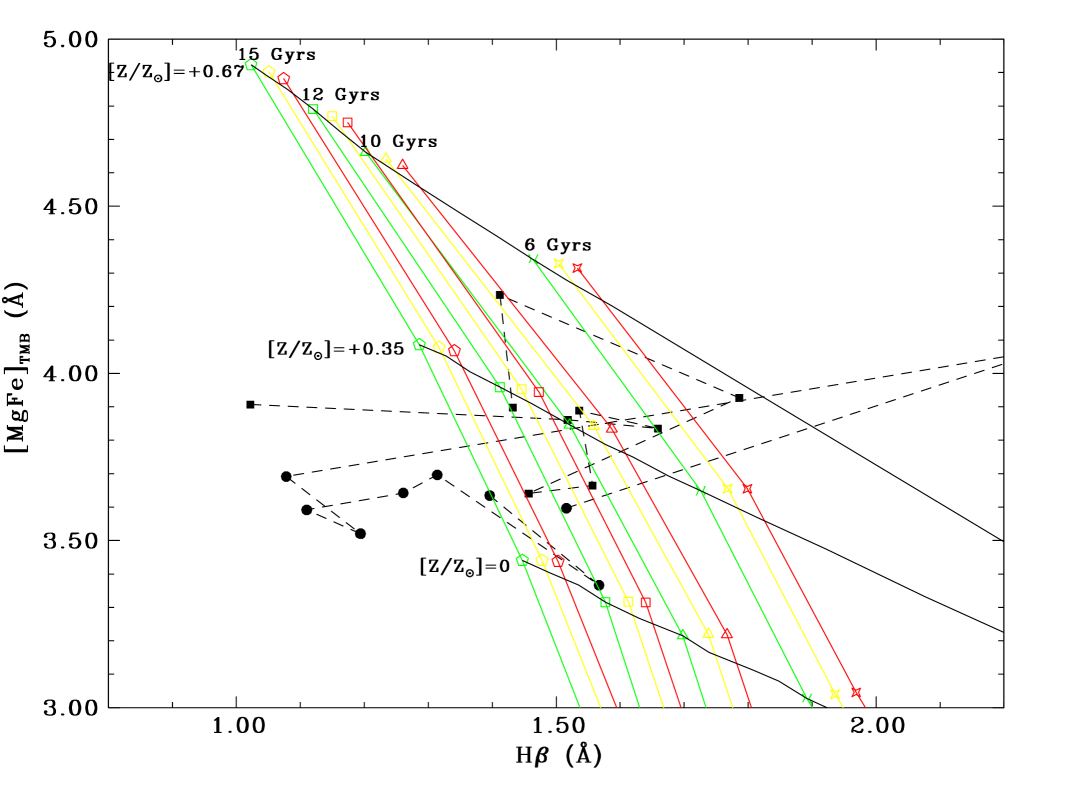
Figure 16 shows modified Lick (TMB 2003a) index versus H for NGC 1052 using the data of the more external spectra only. Figure 22 presents the same for NGC 7796 using all data. Both figures are commented ahead. The index of TMB (2003a) is a metallicity indicator: = . This index is insensitive to the /Fe ratio. The H Lick index is a stellar age indicator for SSPs with 2 Gyr or more.
For NGC 1052, we have obtained the following stellar population analysis using the Lick indices of all extracted spectra along both photometric axes.
The stellar populations inside the observed region of NGC 1052 present a variable alpha-enhancement (maybe between the solar ratio and [/Fe] = +0.5 dex). The luminosity-weighted mean global metallicity seems to change in the interval from [Z/Z⊙] = 0.0 up to +0.35 dex. None information about age can be obtained from these plots. All plots of Mg b vs. an iron index do not show a monotonic radial dependency for the /Fe ratio. On the other hand, the data of the central extracted spectrum indicate a little oversolar /Fe ratio (luminosity-averaged [/Fe] +0.2 0.2 dex) or nearly solar taking into account its error.
Therefore, the timescale of the star formation in the nucleus was 1 Gyr at least if we adopt the relation between the /Fe ratio and timescale from Thomas et al. (2005); see Section 7. Nearly the same timescale is obtained for the observed region along the minor axis direction, i.e. the bulge. However, the strong spread of the Mg/Fe ratio along the major axis or disc directly shows a great dispersion of the star formation timescale as well based on an unknown galaxy formation process. Therefore, in the disc of NGC 1052 the chemical enrichment of -elements by SN-II relative to the iron elements by SN-Ia should has happened in a heterogeneous way. None information about the star ages can be obtained because the H index is completely modified by nebular emission of this Liner.
The relation between the global metallicity, the iron abundance and the /Fe ratio by Salaris, Chieffi & Straniero (1993), immediately below, can be used to estimate one of them as a function of the other ones and to understand the interconnected variations of these quantities. For example, a constant value of the global metallicity with the increasing of the /Fe ratio together with the decreasing of the iron abundance, and a decreasing of Z due basically to a decreasing of /Fe are explained for this relation.
In the next paragraphs, we show the analysis in each index versus index plot for NGC 1052.
The Lick index data obtained along both axes are reasonably distributed in the same regions of the index vs. index planes.
The Mg b versus Fe4531 plot (Fig. 11a) and the Mg b versus Fe5782 plot (Fig. 13b) show the observed Lick indices of the extracted spectra with distribution basically between the curve families of the SSPs with [/Fe] = 0.0 and +0.5 dex at the region of the metallicities [Z/Z⊙] = 0.00 and +0.35 dex.
The Mg b versus Fe5270 plot (Fig. 11b) and the Mg b versus Fe5335 plot (Fig. 12a) show the indices of the spectra with distribution between the curves of the SSPs with [/Fe] = +0.3 (or below) and +0.5 dex at the region of [Z/Z⊙] = 0.00 and +0.35 dex.
The Mg b versus Fe5406 plot (Fig. 12b) and the Mg b versus Fe5709 plot (Fig. 13a) show the indices of the spectra with distribution between the curves of the SSPs with [/Fe] = 0.0 and +0.3 dex at the region of [Z/Z⊙] = +0.35 dex.
The Mg1 versus Fe plot (Fig. 14a) and the Mg2 versus Fe plot (Fig. 14b) show the indices of the spectra with distribution between the curves of the SSPs with [/Fe] = +0.3 and +0.5 dex at the region of [Z/Z⊙] = 0.00 and +0.35 dex.
The Na D versus Fe plot (Fig. 15) shows the indices of the spectra with distribution between the curves of the SSPs with [/Fe] = +0.3 and +0.5 dex (or higher!) basically at the region of [Z/Z⊙] = +0.35 dex; where the data of more central spectra are localized above the curve families with highest /Fe ratio. However, Na is not an -element. Moreover, the interstellar medium can increase the values of the Na D index. Therefore, the overabundance of Sodium relative to Iron is still an open question.
The versus H plot for NGC 1052 (Fig. 16) was made using the data basically along the major axis (6.8 arcsec r 20.2 arcsec). The data of NGC 1052 (r 11.8 arcsce) are concentrated outside of the region of the theoretical Lick indices of the SSPs, i.e. in the region of lower values of H than 1 Å, however nearby to the curves with [Z/Z⊙] = 0.0 and the highest ages. This indicates that there still is a gas emission contribution in the outer regions on the H line at least. The stellar ages in these regions are undetermined through the analysis of this Balmer line.
For NGC 7796, we have made the following stellar population analysis using the Lick indices of all extracted spectra along both photometric axes.
The stellar populations inside the observed region of NGC 7796 present a variable high alpha-enhancement (maybe between the solar ratio and [/Fe] = +0.5 dex). However, differently from NGC 1052, the plots of Mg b versus Fe5270 (Fig. 17b), maybe Mg b vs. Fe5335 (Fig. 18a), Mg1 vs. Fe (Fig. 20a) and Mg2 vs. Fe (Fig. 20b) show a radial dependency for the luminosity-weighted mean /Fe ratio that seems to be greater in the nucleus ([/Fe] +0.44 0.09 dex) than in the outer regions. The stellar populations in the observed region of NGC 7796 have a luminosity-averaged global metallicity between [Z/Z⊙] = 0.0 and +0.35 dex, or almost around +0.35 dex, with ages from 6 up to 12 Gyr (see Fig. 22).
Therefore, the timescale of the stellar formation in the nucleus was nearly 0.04 Gyr adopting the relation of Thomas et al. (2005); Section 7. Along both axis directions, there is strong spread of the Mg/Fe ratio that seems to have a monotonic radial dependency. This can be based on some inside-out galaxy formation process associated together with a possible outwards radial increasing of the star formation timescale. Therefore, in NGC 7796 the chemical enrichment of -elements (SN-II) relative to the iron elements (SN-Ia) should be occurred with a radial dependency.
In the following paragraphs, the analysis in each index-index plane is given.
In the planes index vs. index, the data obtained along both axes are reasonably distributed in the same regions. For example, the data of both central apertures are close each other.
The Mg b versus Fe4531 plot (Fig. 17a) shows the observed Lick indices of all extracted spectra with distribution basically along the curve families of the SSPs with [/Fe] = 0.00, +0.3 and +0.5 dex at the region of the metallicities [Z/Z⊙] = 0.0 and +0.35 dex; where the data of the central spectra are localized around the curve families with highest /Fe ratio for the major axis data only. Some minor axis data are outside of the SSP region.
The Mg b versus Fe5270 plot (Fig. 17b) shows the indices with distribution between the curves of the SSPs with [/Fe] = 0.0 and +0.5 dex at the region of [Z/Z⊙] = 0.0 and +0.35 dex. In this plot, the data are spread transversely to the /Fe family curves so that the data from the nucleus are located nearby the [/Fe] = +0.5 curve.
The Mg b versus Fe5335 plot (Fig. 18a) shows the indices with distribution along the curves of the SSPs with [/Fe] = 0.0, +0.3 and +0.5 dex basically at [Z/Z⊙] = +0.35 dex; where the data of the more central spectra are quite localized around the curves with higher /Fe abundance ratios.
The Mg b versus Fe5406 plot (Fig. 18b) shows the indices with distribution between the curves of the SSPs with [/Fe] = +0.3 and +0.5 dex at the region of [Z/Z⊙] = 0.00 and +0.35 dex.
The plots of Mg b vs. Fe5709 (Fig. 19a) Mg b vs. Fe5782 (Fig. 19b) show the indices with distribution along the curves of the SSPs with [/Fe] = +0.3 and +0.5 basically in the region of [Z/Z⊙] = 0.00 and +0.35 dex. Some data are outside of the SSP region in both plots.
The Mg1 versus Fe plot (Fig. 20a) shows the indices with distribution between the curves of the SSPs with [/Fe] = 0.0 and +0.5 dex basically along the [Z/Z⊙] = +0.35 dex region.
The Mg2 versus Fe plot (Fig. 24b) shows the indices with distribution between the curves of the SSPs with [/Fe] = 0.0 and +0.5 dex above and along the [Z/Z⊙] = +0.35 dex region.
Both Mg1 and Mg2 (vs. Fe) plots present the data distributed transversely to the /Fe curves so that the data from nucleus are located nearby the curve of the highest /Fe ratio and the data of the more external apertures are near to curves with smaller [/Fe].
The Na D versus Fe plot (Fig. 21) shows the indices with distribution between the curves of the SSPs with [/Fe] = 0.0 and +0.5 dex basically at [Z/Z⊙] = +0.35 dex; where the data of more spectra are localized around the curves with the highest /Fe ratio. However, Na is not an -element. Therefore, the overabundance of Sodium relative to Iron is still questionable.
The versus H plot (Fig. 22) was made using all data of NGC 7796. The data of NGC 7796 are concentrated around the region of the theoretical Lick indices of the SSPs with global metallicity [Z/Z⊙] = +0.35 dex, basically including the ages 6 Gyr, 10 Gyr and 12 Gyr and different [/Fe].
We have noted that the average dispersion of [/Fe] is nearly 0.35 dex inside the observed regions of both galaxies (the rotating disc or major axis of NGC 1052 and both main photometric directions of NGC 7796). This dispersion is still greater than the error of a single estimation of [/Fe], which is nearly 0.1 dex, when only one Lick index versus Lick index plot is adopted. Few plots (mainly Fig. 11a and Fig. 17a) have shown part of the data outside the curves grid whose reason might be basically due to the accuracy of the Lick calibration (see Tab. 6 for Fe4531 and Proctor et al. 2004).
6 Stellar Population Synthesis
For a good understanding of some properties of NGC 1052 and NGC 7796, such as the presence of central gas emission, a precise determination of the star formation process is necessary. Therefore, the age of the constituent stars in these galaxies is an important parameter to be determined.
The integrated spectrum of a given galaxy contains significant information on its stellar content and chemical enrichment (Bica & Alloin, 1986a). This information together with a stellar population synthesis method is used to determine the galaxy star formation history (Bica & Alloin, 1986b). In this work we have employed the stellar population synthesis method developed by Bica (1988) which is based on integrated spectra of star clusters and H ii regions, characterized by different ages and metallicities. In the present case, we have used seven components in the spectral base (G1, G2, G3, Y1, Y2, Y3 and RHII). The old components (G1, G2 and G3) have ages of 10, 13 and 15 Gyr and metallicities of the [Z/Z⊙] 0.0, -0.4 and -1.1 dex respectively. The components Y1, Y2 and Y3 have ages of 10, 25 and 80 Myr with metallicities of the [Z/Z⊙] -0.25, -0.4 and -0.5 dex respectively. The HII region represents a stellar population of 106 years old and with solar metallicity.
Basically the algorithm uses some EWs and continuum points measured in a given galaxy spectrum and compares them to those of a model computed from a base of simple stellar population elements (see in Rickes, Pastoriza & Bonatto 2004).
The corresponding selected EWs and continuum points for the base elements have been measured similarly as those for the observed galaxies, and are given in Tables 19 and 20. The base spectra are presented in Figure 23.

| (Å) | |||||||||
|---|---|---|---|---|---|---|---|---|---|
| Metallicity | |||||||||
| [Z/Z⊙] | Fe4383 | Ca4455 | Fe4531 | Fe5270 | Fe5335 | Fe5406 | Fe5709 | Fe5782 | |
| G1 | 0.00 | 6.00 | 2.76 | 4.06 | 2.77 | 1.65 | 1.50 | 1.36 | 1.14 |
| G2 | -0.4 | 3.28 | 0.94 | 2.94 | 2.99 | 1.70 | 1.46 | 1.30 | 0.80 |
| G3 | -1.1 | 2.42 | 0.40 | 2.10 | 1.59 | 0.95 | 0.77 | 0.57 | 0.52 |
| Y1 | -0.25 | 2.73 | 1.08 | 1.10 | 1.95 | 0.70 | 1.36 | 1.22 | 0.87 |
| Y2 | -0.4 | 2.58 | 0.49 | 0.78 | 1.06 | 0.71 | 0.89 | 0.70 | 0.28 |
| Y3 | -0.5 | 1.78 | 0.57 | 1.13 | 0.88 | 0.76 | 0.53 | 0.43 | 0.33 |
| RHII | 0.00 | 0.00 | 0.00 | 0.00 | 0.00 | 0.00 | 0.00 | 0.00 | 0.00 |
| 4475 | 4800 | 5100 | 5300 | 5546 | 5800 | 5822 | 6200 | |
|---|---|---|---|---|---|---|---|---|
| G1 | 0.67 | 0.78 | 0.79 | 0.91 | 0.97 | 1.01 | 1.01 | 0.94 |
| G2 | 0.83 | 0.92 | 0.91 | 0.97 | 0.98 | 0.99 | 1.01 | 0.94 |
| G3 | 0.90 | 0.96 | 0.95 | 0.97 | 0.99 | 0.99 | 0.99 | 0.93 |
| Y1 | 1.16 | 1.06 | 1.04 | 1.04 | 1.12 | 1.01 | 1.03 | 0.90 |
| Y2 | 1.52 | 1.34 | 1.22 | 1.17 | 1.04 | 1.04 | 1.03 | 0.90 |
| Y3 | 1.37 | 1.29 | 1.23 | 1.08 | 1.06 | 1.00 | 0.99 | 0.81 |
| RHII | 1.87 | 1.66 | 1.45 | 1.33 | 1.21 | 1.03 | 1.00 | 0.92 |
6.1 Synthesis results
The synthesis model presents the contribution of each base element to the flux at 5870 Å. The computed models along the major and minor axes of NGC 1052 and NGC 7796 are given in Tables 21, 22, 23 and 24. The values are also derived from the synthesis.
For NGC 1052, the old components (G1, G2 and G3) dominate the 5870 Å flux in the more central extractions. In its nucleus, these components contribute with 82.% ( 10.%) of the total flux (89.% for the major axis spectral extraction and 75.% for the minor axis one), while at 0.3 r this contribution seems to decrease to 71.% ( 8.%) along the major axis (or the stellar disc) while it remains the same (80 10.%) along the minor axis (or the bulge). The young components (Y1, Y2 and Y3) have a small increasing along the disc from the nucleus outwards: from 17 10.% (center) up to 25 5.% (at 0.3 r). Around the bulge the contribution of the young components is constant: at the 0.3 r it is also 16 9.%. In terms of stellar metallicity, the synthesis results have been also rebinned so that the G1+Y1, G2+Y2+Y3 and G3 contributions were summed in order to represent respectively the fractions for [Z/Z⊙] 0, -0.4 and -1 dex. The solar metallicity components dominate the nucleus (68 3.%) and its contribution decreases along the stellar disc (49 17.% at 0.3 r) while it remains constant around the bulge (65 6.% at 0.3 r). The fraction of the G2, Y2 and Y3 components (under-solar metallicities) is the same in the nucleus and around the bulge (26 5.%). However, it increases along the disc (41 6.% at 0.3 r). The extremely metal poor component G3 has a very small contributions around all observed region: 4 1.% at the nucleus, 7 5.% at 0.3 r of the minor axis (bulge) and 6 3.% at 0.3 r of the disc. The RHII component does not show any considerable contribution and spread. The synthesis results of NGC 1052 can be seen in Tabs. 21-22 (all apertures) and Figure 24 (nucleus, major axis observation).
The synthesis results for NGC 7796 are analogous to the NGC 1052 one. Moreover, there is more symmetry of them around the center for both axes than in NGC 1052. The old components dominate in the nucleus with 82.5 1.% of the total flux, (83.% for the major axis aperture and 82.% for the minor axis one), while at 0.3 r this contribution decreases to 73 3.% (75 8.% for the major axis and 71 1.% for the minor one). The young components Y1, Y2 and Y3 have an outwards radial increasing (14 1.%, at the nucleus, to 23 4.% outside). Along the both axes these components increase from the central part outwards: from 13 3.% up to 20 6.% at 0.3 r (major axis) and from 15 8.% up to 25 1.% at 0.3 r (minor axis). In terms of stellar metallicity, the synthesis results have been also rebinned on the same way applied for NGC 1052. The solar metallicity components dominate the nucleus (58 1.%) and its contribution decreases a little along the major axis (53 1.% at 0.3 r) and minor axis as well (54 11.% at 0.3 r). The fraction of the under-solar metallicity component is quite the same in the nucleus (31 1.%) and along both axes (34 2.% at 0.3 r). The extremely metal poor component G3 has a very small contributions around all observed region: 5 1.% at the nucleus, 8 1.% at 0.3 r of the major axis and 9 1.% at 0.3 r of the minor axis. Therefore, the template contributions along the major axis are analogous to these ones along the minor axis, i.e. there is a homogeneous stellar population spatial distribution along both directions. The RHII component does not show any considerable contribution. The synthesis results of NGC 7796 are given in Tabs. 23-24 (all apertures) and Figure 25 (nucleus, major axis observation).
| Flux fraction at 5870 Å | ||||||||
|---|---|---|---|---|---|---|---|---|
| R (arcsec) | G1 | G2 | G3 | Y1 | Y2 | Y3 | RHII | |
| (%) | (%) | (%) | (%) | (%) | (%) | (%) | (mag) | |
| 0.00 | 61.8 8.5 | 22.8 9.9 | 4.2 4.4 | 3.4 3.8 | 3.4 3.7 | 3.2 3.8 | 1.4 2.3 | 0.05 |
| 1.10 SE | 79.7 4.9 | 3.9 4.0 | 8.8 5.5 | 1.4 2.5 | 1.5 2.3 | 3.9 3.8 | 0.8 1.8 | 0.00 |
| 3.56 SE | 55.0 6.1 | 8.6 7.3 | 5.4 5.4 | 3.7 3.9 | 2.4 3.1 | 24.6 3.7 | 0.3 1.1 | 0.00 |
| 6.84 SE | 69.4 4.2 | 10.9 6.9 | 4.4 4.2 | 0.6 1.6 | 10.6 3.8 | 3.5 4.1 | 0.6 1.6 | 0.00 |
| 11.80 SE | 57.1 5.1 | 11.4 6.4 | 2.6 3.5 | 3.7 4.1 | 20.4 5.1 | 4.2 4.5 | 0.4 1.4 | 0.00 |
| 20.21 SE | 24.7 4.6 | 35.3 9.1 | 13.7 6.7 | 2.5 3.2 | 6.1 4.7 | 16.9 5.0 | 0.7 1.7 | 0.00 |
| 1.08 NW | 61.0 3.3 | 19.7 3.4 | 11.0 5.5 | 1.0 2.0 | 3.0 3.6 | 3.3 4.3 | 1.0 2.0 | 0.04 |
| 3.54 NW | 38.6 5.1 | 23.6 5.8 | 18.7 4.4 | 2.4 2.9 | 5.4 4.0 | 9.4 5.3 | 2.0 2.7 | 0.00 |
| 6.81 NW | 39.5 6.7 | 26.9 7.0 | 1.7 2.9 | 7.6 5.6 | 8.3 5.7 | 6.4 5.2 | 9.6 3.3 | 0.00 |
| 11.78 NW | 32.9 4.5 | 27.5 4.1 | 10.4 5.6 | 3.7 3.3 | 8.3 2.8 | 9.0 6.4 | 8.1 2.8 | 0.00 |
| 20.19 NW | 36.3 9.3 | 29.5 9.7 | 3.6 4.5 | 5.9 5.4 | 7.1 5.6 | 6.0 6.0 | 11.6 4.5 | 0.00 |
-
Last column: internal reddening, corresponding to the Galactic law.
| Flux fraction at 5870 Å | ||||||||
|---|---|---|---|---|---|---|---|---|
| R (arcsec) | G1 | G2 | G3 | Y1 | Y2 | Y3 | RHII | |
| (%) | (%) | (%) | (%) | (%) | (%) | (%) | (mag) | |
| 0.00 | 60.9 7.8 | 8.5 9.2 | 5.1 6.1 | 9.1 9.0 | 11.1 7.4 | 3.4 4.6 | 2.0 3.2 | 0.05 |
| 2.17 SW | 60.7 3.2 | 1.7 2.8 | 30.3 5.4 | 1.0 2.0 | 2.5 3.2 | 3.7 3.5 | 0.0 0.0 | 0.02 |
| 4.90 SW | 69.0 5.9 | 7.3 5.7 | 5.5 5.3 | 3.7 4.0 | 9.0 5.5 | 2.7 3.4 | 2.8 3.2 | 0.03 |
| 9.41 SW | 66.9 6.1 | 13.7 6.6 | 8.4 6.3 | 2.2 3.1 | 3.9 4.1 | 3.3 3.9 | 1.5 2.5 | 0.02 |
| 2.19 NE | 70.3 7.3 | 11.2 7.0 | 9.7 6.4 | 2.4 3.2 | 2.3 3.1 | 2.7 3.5 | 1.4 2.4 | 0.05 |
| 4.92 NE | 57.3 8.0 | 19.2 9.1 | 2.7 3.9 | 4.4 4.7 | 9.3 6.7 | 2.1 3.1 | 5.0 4.0 | 0.01 |
| 9.43 NE | 56.5 6.6 | 12.2 7.4 | 4.1 4.5 | 4.4 4.5 | 14.5 6.8 | 2.9 3.9 | 5.3 3.9 | 0.02 |
-
Last column: internal reddening, corresponding to the Galactic law.
| Flux fraction at Å | ||||||||
|---|---|---|---|---|---|---|---|---|
| R (arcsec) | G1 | G2 | G3 | Y1 | Y2 | Y3 | RHII | |
| (%) | (%) | (%) | (%) | (%) | (%) | (%) | (mag) | |
| 0.00 | 54.2 6.3 | 22.3 6.9 | 5.9 8.1 | 3.3 3.9 | 4.3 4.5 | 5.2 5.4 | 4.6 3.8 | 0.05 |
| 1.09 S | 44.3 9.5 | 29.7 9.5 | 7.2 6.4 | 3.9 4.4 | 7.0 5.9 | 2.7 3.5 | 5.1 3.9 | 0.04 |
| 3.55 S | 35.7 7.5 | 33.0 8.7 | 5.1 5.1 | 7.1 4.9 | 4.4 4.4 | 10.2 5.2 | 4.4 3.3 | 0.03 |
| 7.10 S | 49.3 6.8 | 22.9 7.0 | 8.4 6.2 | 3.3 4.0 | 5.6 4.9 | 7.5 5.7 | 2.9 3.2 | 0.01 |
| 13.21 S | 50.7 9.0 | 20.8 9.5 | 7.0 6.2 | 7.3 5.6 | 4.2 4.2 | 6.5 5.6 | 3.5 3.4 | 0.01 |
| 1.09 N | 51.7 9.5 | 21.8 10.1 | 6.0 6.2 | 4.9 4.9 | 7.6 5.9 | 3.2 4.1 | 4.8 4.0 | 0.03 |
| 3.55 N | 48.0 10.6 | 15.5 11.2 | 12.2 8.5 | 6.3 5.9 | 6.0 5.2 | 7.2 5.9 | 4.7 3.9 | 0.02 |
| 7.10 N | 43.0 10.5 | 18.7 10.0 | 8.1 6.9 | 9.6 6.4 | 6.6 5.3 | 7.6 6.2 | 6.3 4.5 | 0.02 |
| 13.21 N | 44.6 10.5 | 16.0 9.8 | 9.4 7.4 | 10.8 6.4 | 6.7 5.2 | 8.2 4.8 | 4.3 3.7 | 0.01 |
-
Last column: internal reddening, corresponding to the Galactic law.
| Flux fraction at Å | ||||||||
|---|---|---|---|---|---|---|---|---|
| R (arcsec) | G1 | G2 | G3 | Y1 | Y2 | Y3 | RHII | |
| (%) | (%) | (%) | (%) | (%) | (%) | (%) | (mag) | |
| 0.00 | 55.0 9.2 | 21.2 9.8 | 5.4 5.6 | 4.4 4.7 | 6.0 5.3 | 4.2 4.5 | 3.7 3.7 | 0.02 |
| 1.09 E | 54.5 9.0 | 25.2 9.9 | 4.5 5.2 | 3.4 3.6 | 2.5 3.2 | 3.4 3.9 | 6.5 3.4 | 0.01 |
| 3.55 E | 38.1 10.5 | 23.7 11.5 | 6.9 6.7 | 11.1 7.2 | 5.9 5.0 | 10.3 6.3 | 3.9 3.6 | 0.01 |
| 6.93 E | 36.9 8.0 | 24.0 9.3 | 10.0 7.6 | 10.6 6.1 | 8.0 5.2 | 7.7 5.5 | 2.9 3.1 | 0.02 |
| 12.50 E | 38.4 6.0 | 21.3 8.6 | 9.0 7.7 | 7.00 5.8 | 2.1 3.1 | 20.5 6.1 | 1.8 2.6 | 0.01 |
| 1.09 W | 52.2 6.7 | 20.5 7.3 | 5.8 5.1 | 4.8 4.8 | 10.9 5.1 | 3.9 4.2 | 1.8 2.7 | 0.02 |
| 3.55 W | 44.0 8.9 | 12.7 7.9 | 6.4 6.2 | 7.4 5.8 | 13.9 5.9 | 11.6 7.1 | 4.0 3.9 | 0.01 |
| 6.93 W | 54.0 8.2 | 9.5 7.3 | 9.0 7.3 | 7.6 5.4 | 10.8 5.1 | 5.1 5.1 | 4.0 3.8 | 0.02 |
| 12.50 W | 32.5 6.4 | 37.4 8.3 | 8.7 7.1 | 8.5 5.9 | 2.6 3.2 | 4.3 4.6 | 5.9 4.0 | 0.03 |
-
Last column: internal reddening, corresponding to the Galactic law.


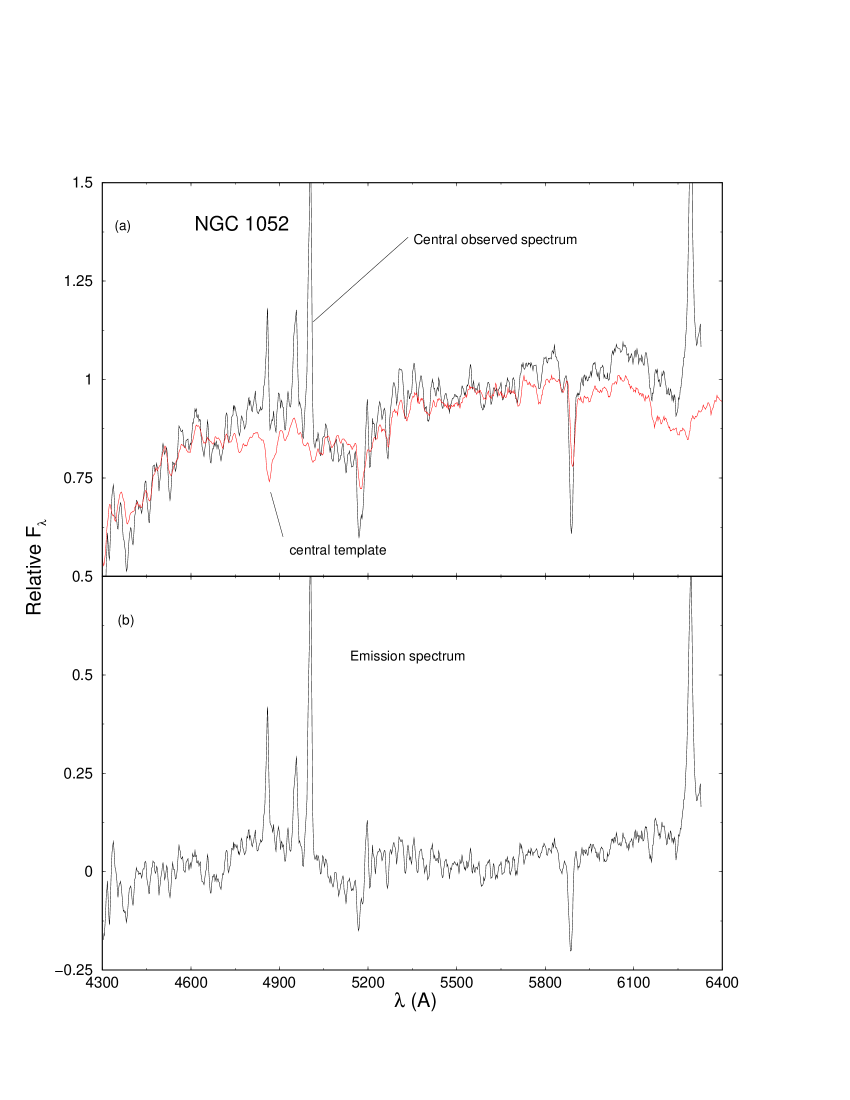
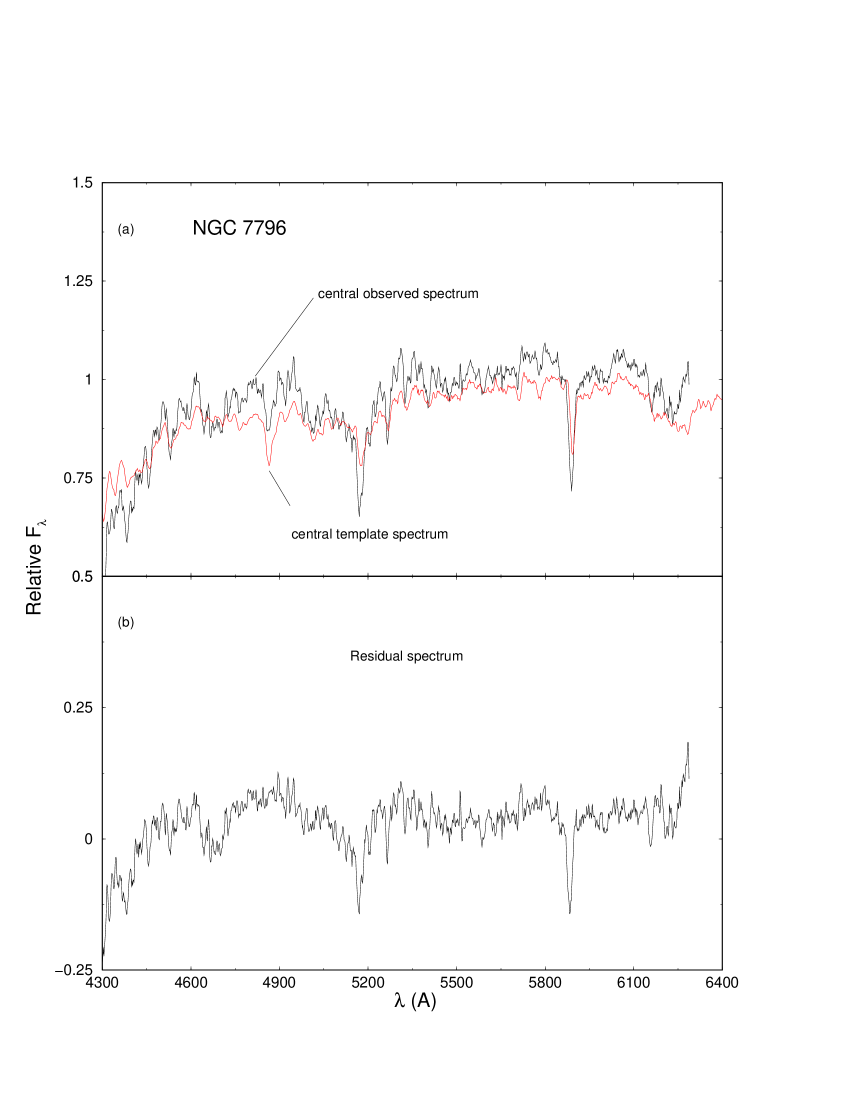
The spectra representing the composite stellar population of NGC 1052 and NGC 7796 have been constructed using the star cluster templates combined according to the proportions given by each synthesis result. We illustrate this procedure in Figures 26 and 27 respectively for NGC 1052 and NGC 7796, in which we show the synthesis for the central aperture using their major axis extractions only (top panel). The resulting residual spectrum for each galaxy, which is obtained after the subtraction of the population template, is shown in the bottom panel of both figures. For NGC 1052, it is a pure emission spectrum with some absorption lines. For NGC 7796, it is a pure absorption spectrum. On the synthetic spectra of both galaxy nuclei compared to the observed ones, we can note there are residuals for the Mg b and Na D absorptions that are greater than for the Fe lines possibly indicating some overabundance of those elements relative to iron.
The goodness of the stellar population synthesis method can be assessed by looking at the observed and synthetic spectra (Figs. 26 and 27).
7 Star formation history in NGC 1052 and NGC 7796
The star formation history of some region of a galaxy can be characterized by the luminosity-weighted mean age of the bulk of its stars and the timescale of the correspondent main episode. In order to find the luminosity-averaged age of a galaxy region we have made the stellar population synthesis described in Section 6. The formation timescale has been obtained through the the luminosity-averaged /Fe abundance ratio (see Sect. 5). The [/Fe] solar relative ratio is linearly proportional to the logarithm of the timescale of a star forming episode (Gyr), which is the FWHM of a gaussian star formation rate (Thomas et al. 2005):
Our results for [/Fe] and stellar age for NGC 1052 are divided into the bulge (minor axis data) and along the stellar disc (major axis data) as following: (i) /Fe is little oversolar and quite homogeneous in the galaxy center ([/Fe] = +0.2 0.2 dex) or around the bulge ([/Fe] = +0.4 0.1 dex) but it varies along the disc from the solar value up to [/Fe] = +0.5 dex and does not show a monotonic radial dependency (we point that the average dispersion of [/Fe] is greater than the error of a single estimation of it, see Sect. 5); (ii) the bulk of the stars is old, 10-15 Gyr, in the bulge (dominates 82.% of the V light) and there is only along the disc an outwards radial increasing of a intermediate-aged (or young) stellar population together to a small decreasing of the old component; (iii) the iron abundance seems to be constant over whole observed region applying the relation of Salaris, Chieffi & Straniero (1993) cited in Section 5; (iv) and the global metallicity changes from the solar value up to [Z/Z⊙] = +0.35 dex with a possible decreasing outwards along the disc only. These results corroborate part of the conclusions of other works (Raimamm et al. 2001, Thomas et al. 2005); read Section 1. Therefore, the star formation history in the bulge of NGC 1052 was dominated by an ancient episode (at 13 Gyr ago) with a timescale of 0.1 or 1 Gyr at least. The star formation timescale in the disc was heterogeoneous based on an unknown galaxy formation process.
For NGC 7796, the results for [/Fe] and stellar age are divided into the nucleus and along both photometric directions outwards: (i) /Fe is oversolar with a small dispersion in the nucleus ([/Fe] = +0.4 0.1 dex) and possibly it shows a monotonic radial dependency along both axes decreasing to the solar value outwards; (ii) the stars are old in the nucleus, 10-15 Gyr (dominate 83.% of the V light), and there is along both directions a small outwards decreasing of this component with a little homogeneous contribution of a intermediate-aged or young component; (iii) the iron abundance seems to be constant over whole observed region if we adopt the cited relation of Salaris, Chieffi & Straniero (1993), Section 5; (iv) and the mean global metallicity is oversolar with a possible outwards monotonic radial decreasing along both directions (or it has a high dispersion of 0.35 dex). The stellar population parameters of the nucleus agree with the results of Thomas et al. (2005); read Section 1. Therefore, the star formation in the center of NGC 7796 happened at 10-15 Gyr ago whose bulk of stars has a very small age spread (0.1 Gyr). The star formation should have continued outwards in order to explain the strong radial decreasing of the /Fe ratio.
The mass of the stellar content of each galaxy has been estimated applying the relation of Thomas et al. (2005) between the stellar mass and the central velocity dispersion valid to any environment. The stellar masses of NGC 1052 and NGC 7796 are 1.41011 and 2.91011 respectively.
8 Summary and conclusions
We have made a detailed stellar population analysis, adopting long slit spectroscopic observations, of two different early-type galaxies of low density regions of the local Universe: NGC 1052, a Liner of a group that shows a stellar rotating disc, and NGC 7796, a field spheroid with a counter rotating core. Both galaxies have stellar masses around 1011 . The spatial distributions of the mean luminosity-weighted stellar age, metallicity, and /Fe ratio along both photometric axes of them have been obtained in order to reconstruct the star formation history in their kinematically distinct subsystems. We have measured several Lick line-strength indices on the aperture spectra which were extracted from the galaxy center up to almost one effective radius. The Lick index radial gradients were also measured. We have confirmed the stellar kinematics of these spheroidal systems as well. The measured Lick indices were compared to the theoretical ones of the simple stellar population models of Thomas, Maraston and Bender (2003a) directly on the index versus index planes. We have applied a stellar population synthesis using a grid of star cluster templates from Bica (1988).
Based on the Lick index comparisons with the SSP models, both galaxies show a stellar overabundance of Magnesium relative to Iron, which shows a strong dispersion along the disc of NGC 1052 and it is almost constant in its bulge. It is higher in the nucleus of NGC 7796 and has an outwards radial decreasing along both axes of it. The variation of [/Fe] goes from 0.0 up to +0.5 dex. A plausible explanation for this points to a big spread of the star formation timescale inside these galaxies on their formation process. In the case of NGC 7796, the SN-Ia/SN-II ratio should has been crescent from the galaxy center outwards on a kind of an inside-out galaxy formation process.
The results of the population synthesis indicate that the nucleus of both ellipticals is dominate by old metal rich stars (13 Gyr, Z⊙). The populations are more homogeneous in the bulge of NGC 1052 than along its disc, where there is an outwards radial decreasing of the contribution of the older-richer components together with a respective rising proportion of the younger-metal poor ones. The results for NGC 7796 are analogous: older ages and higher metallicities in the nucleus but with a similar radial behavior of the age and Z variations along both axes.
Differently from Mehlert et al. (2003), the observed regions of NGC 1052 and NGC 7796 have a strong dispersion for the parameters of their stellar populations, specially for the /Fe ratio and age. Moreover, the star characteristics are associated with their kinematics: the stellar populations are older and -enhanced in the not rotating bulge of NGC 1052 and counter rotating core of NGC 7796, while they show a strong spread of /Fe and age along the rotating disc of NGC 1052 and an outwards radial decreasing of them outside the core of NGC 7796. The global metallicity has an outwards radial decreasing, while the iron abundance is nearly constant. The age variation is possibly connected to the /Fe one.
The abundances of Sodium and Carbon of the stellar content seem to have some spatial dispersion in both galaxies (maybe an outwards radial decreasing). However, probably there is some interstellar contribution to the Na D index. A careful analysis based on SSP models is still necessary because the models must consider the influence of the abundance variations of Na and C on the Lick indices.
Therefore, the bulk of the stars in the bulge of NGC 1052 and KDC of NGC 7796 was formed in an ancient short episode (maybe at 13 Gyr ago with a timescale of 0.1-1 Gyr) providing an efficient chemical enrichment by SN-II, while in the NGC 1052 disc and outer parts of NGC 7796 the star formation occurred later with larger temporal scales, having made the enrichment by SN-Ia important. Specifically, for NGC 7796 an inside-out formation is plausible, while a merging episode with a drawn out star formation is more acceptable for NGC 1052.
Acknowledgements.
A. Milone is thankful to FAPESP, Fundação de Amparo à Pesquisa do Estado de São Paulo (process numbers 2006/05029-3 and 2000/06695-0), and Proap-Capes/INPE as well. The authors thank to the referees by the relevant suggestions and comments that improved the manuscript. The IRAF (Image Reduction Analysis Facility) system was adopted for the data reduction and analysis. IRAF is distributed by the National Optical Astronomy Observatories, which are operated by the Association of Universities for Research in Astronomy, Inc., under cooperative agreement with the National Science Foundation.References
- (1) Arimoto, N. & Yoshii, Y. 1987, A&A, 173, 23
- (2) Bekki, K. & Shioya, Y. 1999, ApJ, 531, 108
- (3) Bender, R., Burstein, D. & Faber, S. M. 1993, ApJ, 411, 153
- (4) Bender, R., Doebereiner, S., & Moellenhoff, C. 1988, A&AS, 74, 385
- (5) Bender, R., & Surma, P. 1992, A&A, 258, 250
- (6) Bertin, G., Bertola, F., Buson, L. M., Danzinger, I. J., Dejonghe, H., Sadler, E. M., Saglia, R. P., de Zeeuw, P. T., & Zeilinger, W. W. 1994, A&A, 292, 381
- (7) Beuing, J., Bender, R., Mendes de Oliveira, C., Thomas, D. & Maraston, C. 2002, A&A 395, 431
- (8) Bica, E. 1988, A&A, 195, 79
- (9) Bica, E., & Alloin, D. 1986a, A&AS, 66, 171
- (10) Bica, E., & Alloin, D. 1986b, A&A, 162, 21
- (11) Bica, E., Arimoto, N., & Alloin, D. 1988, A&A, 202, 8
- (12) Binney, J. J., Davies, R. L., & Illingworth, G. D. 1990, ApJ, 361, 78
- (13) Burstein, D., Bertola, F., Buson, L. M., Faber, S. M. & Lauer, T. R. 1988, ApJ, 328, 440
- (14) Cardiel, N., Gorgas, J., Cenarro, J., & Gonzalez, J. J. 1998, A&AS, 127, 597
- (15) Carlberg, R. G. 1984, ApJ, 286, 403
- (16) Carollo, C. M., & Danziger, I. J. 1994, MNRAS, 270, 523
- (17) Carollo, C. M., Danziger, I. J., & Buson, L. 1993, MNRAS, 265, 553
- (18) Chiosi, C. & Carraro, G. 2002, MNRAS, 335, 335
- (19) Couture, J. & Hardy, E. 1988, AJ, 96, 867
- (20) Davies, R. L., Burstein, D., Dressler, A., Faber, S. M., Lynden-Bell, D., Terlevich, R. J. & Wegner, G. 1987, ApJS, 64, 581
- (21) Davies, R. L., Sadler, E. M., & Peletier, R. F. 1993, MNRAS, 262, 650
- (22) Davies, R. L., Kuntschner, H., Emsellem, E., Bacon, R., Bureau, M., Carollo, C. M., Copin, Y., Miller, B. W., Monnet, G., Peletier, R. F., Verolme, E. K. & de Zeeuw, P. T. 2001, ApJ, 548, L33
- (23) de la Rosa, I. G., de Carvalho, R. R. & Zepf, S. E. 2001, AJ, 122, 93
- (24) Duflot, M., Fehrenbach, C., Mannone, C., Burnage, R. & Genty, V. 1995, AAS, 110, 177
- (25) Faber, S. M., Wegner, G., Burstein, D., Davies, R. L., Dressler, A., Lynden-Bell, D. & Terlevich, R. J. 1989, ApJS, 69, 763
- (26) Ferrari, F., Pastoriza, M. G., Macchetto, F. D., Bonatto, C., Panagia, N., & Sparks, W. B. 2002, A&A, 389, 355
- (27) Fried, J. W., & Illingworth, G.D. 1994, AJ, 107, 992
- (28) Forbes, D. A., Sánchez-Blázquez, P. & Proctor, R. 2005, MNRAS, 361, L6
- (29) Giuricin, G., Marinoni, C., Ceriani, L., & Pisani, A. 2000, ApJ, 543, 178
- (30) Golev, V. & Prugniel, Ph. 1998, A&AS, 132, 255
- (31) Goudfrooij, P. & Emsellem, E. 1996, A&A, 305, L45
- (32) Henry, R. B. C. & Worthey, G. 1999, PASP, 111, 919
- (33) Huchra, J. P., Brodie, J. P., Caldwell, N., Christian, C. & Schommer, R. 1996, ApJS, 102, 29
- (34) Idiart, T. P., Michard, R., & de Freitas Pacheco, J. A. 2003, A&A, 398, 949
- (35) Jorgensen, I., Franx, M. & Kjaergaard, P. 1995, MNRAS, 276, 1341
- (36) Jorgensen, I. 1997, MNRAS, 288, 161
- (37) Kadler, M., Kerp, J., Ros, E., Falcke, H., Pogge, R. W. & Zensus, J. A. 2004, A&A, 420, 467
- (38) Kawata, D. 1999, PASJ, 51, 931
- (39) Kobayashi, C. 2004, MNRAS, 347, 740
- (40) Kobayashi, C., & Arimoto, N. 1999, ApJ, 527, 573
- (41) Kurtz, M. J. & Mink, D. J. 1998, PASP, 110, 934
- (42) Larson, R. B. 1974a, MNRAS, 166, 585
- (43) Larson, R. B. 1974b, MNRAS, 169, 229
- (44) Maraston, C. 1998, MNRAS, 300, 872
- (45) Matteucci, F. 1994, A&A, 288, 57
- (46) Matteucci, F. & Tornambè, A. 1987, 185, 51
- (47) Matteucci, F., Ponzone, R. & Gibson, B. K. 1998, A&A, 335, 855
- (48) McDermid, R. M., Bacon, R. Kuntschner, H., Emsellem, E., Shapiro, K. L., Bureau, M., Cappellari, M., Davies, R. L., Falc n-Barroso, J., Krajnovic, D., Peletier, R. F., Sarzi, M. & de Zeeuw, T. 2006, NewAR, 49, 521
- (49) Mehlert, D., Thomas, D., Saglia, R. P., Bender, R. & Wegner, G. 2003, A&A, 407, 423
- (50) Mihos, J. C. & Hernquist, L. 1994, ApJ, 427, 112
- (51) Morelli, L., Halliday, C. Corsini, E. M., Pizzella, A., Thomas, D., Saglia, R. P., Davies, R. L., Bender, R., Birkinshaw, M. & Bertola, F. 2004, MNRAS, 354, 753
- (52) Peletier, R. F., Davies, R. L., Illingworth, G. D., Davis, L. E., & Cawson, M. 1990, AJ, 100, 109
- (53) Pierce, M., Brodie, J. P., Forbes, D. A., Beasley, M. A., Proctor, R. & Strader, J. 2005, MNRAS, 358, 419
- (54) Pipino, A., Matteucci, F. & Chiappini, C. 2006, ApJ, 638, 739
- (55) Proctor, R. N., Forbes, D. A., Hau, G. K. T., Beasley, M. A., De Silva, G. M., Contreras, R. & Terlevich, A. I. 2004, MNRAS, 349, 1381
- (56) Raimann, D., Storchi-Bergmann, T., Bica, E., & Alloin, D. 2001, MNRAS, 324, 1087
- (57) Ravindranath, S., Ho, L. C., Peng, C. Y., Filippenko, A. V., & Sargent, W. L. W. 2001, AJ, 122, 653
- (58) Rembold, S. B., Pastoriza, M. G., Ducati, J. R., Rubio, M, & Roth, M. 2002, ApJ, 588, 344
- (59) Rickes, M. G., Pastoriza, M. G. & Bonatto, Ch. 2004, A&A, 419, 449
- (60) Salaris, M., Chieffi, A., & Straniero, O. 1993, ApJ, 414, 580
- (61) Saglia, R. P., Maraston, C., Thomas, D. & Bender, R. 2002, ApJ, 579, L13
- (62) Salpeter, E. E. 1955, ApJ, 121, 161
- (63) Terlevich, R., Davies, R. L., Faber, S. M. & Burstein, D. 1981, MNRAS, 196, 381
- (64) Thomas, D., Maraston, C., & Bender, R. 2003a, MNRAS, 339, 897
- (65) Thomas, D., Maraston, C., & Bender, R. 2003b, MNRAS, 343, 279
- (66) Thomas D., Maraston, C., Bender, R. & de Oliveira, C. M. 2005, ApJ, 621, 673
- (67) Tonry, J., & Davis, M. 1979, AJ, 84, 1511
- (68) Trager, S. C., Worthey, G., Faber, S. M., Burstein, D. & Gonzalez, J. J. 1998, ApJS, 116, 1
- (69) Tripicco, M. J. & Bell, R. A. 1995, AJ, 110, 3035
- (70) Worthey, G., Faber, S. M., & Gonzalez, J. J. 1992, ApJ, 398, 69
- (71) Worthey, G., & Ottaviani, D. L. 1997, ApJS, 111, 377
- (72) Worthey, G. 1994, ApJS, 95, 107
- (73) Yoshii, Y. & Arimoto, N. 1987, A&A, 188, 13