Unveiling the oldest and most massive galaxies at very high redshift
The identification and characterization of massive galaxies over a wide redshift range allow us to place stringent constraints on the cosmic history of galaxy mass assembly and on current models of galaxy formation and evolution. This work explores the existence of high redshift massive galaxies unveiled with Spitzer+IRAC, but missed by conventional selection techniques based on optical and near-infrared observations. To this end, we use multi-wavelength imaging data available for the GOODS-South field (130 arcmin2), and select a flux-limited sample from the IRAC 3.6 m image to Jy (m(AB)23.26). In order to identify the most extreme objects and to complement previously published selections in this field, we confine our study to the galaxies undetected by the optical HST+ACS imaging and close to the detection limit of the -band image ( AB). Our selection unveiled 20 galaxies on which we performed a detailed analysis. For each galaxy, we built a Spectral Energy Distribution (SED) based on optical-to-8m photometry. The SEDs were then used to estimate the photometric redshifts and to derive the main galaxies physical properties. Further constraints were also obtained from the available X-ray and 24m data. The majority of the sample (14 out of 20) sources show degenerate/bimodal solutions for the photometric redshifts. These can either be heavily dust-enshrouded () starbursts at with bolometric luminosities , or massive post-starburst galaxies in the redshift interval with stellar masses of . The remaining six galaxies present a less ambiguous photometric redshift: with the exception of one low- dusty source, these latter objects favour a low-extinction solution, with four of them showing best-fit photo-z solutions at . One galaxy, ID-6, the only source in our sample with both an X–ray and a 24 m detection, might be an extremely massive object at detected during a post-starburst phase with concomitant QSO activity responsible for the 24 m and X-ray emissions (although a lower- solution is not excluded). Our investigation of Spitzer-selected galaxies with very red SEDs and completely undetected in the optical reveals a potential population of massive galaxies at which appear to include significant AGN emissions. These sources may be the oldest stellar systems at , given that the estimated ages are close to the age of the Universe at that redshift. We found that these, previously unrecognized, optically obscured objects might provide an important contribution to the massive-end () of the high- stellar mass function and they would almost double it. Our suggested evidence in these mature high- galaxies of the widespread presence of hidden AGNs may have important implications for galaxy formation, due to their feedback effects on the surrounding ISM.
1 INTRODUCTION
Early attempts to estimate the luminosity and mass functions of galaxies have revealed a surprisingly low rate of evolution of the stellar mass between the present epoch and redshifts 1, and particularly so for the most massive systems (Fontana et al. 2004; Bundy et al. 2005; Franceschini et al. 2006). Deep extensive near-IR surveys have recently confirmed the presence of a numerous population of already massive galaxies at (e.g., Franx et al. 2003; van Dokkum et al. 2003; Cimatti et al. 2004; Daddi et al. 2004; Yan et al. 2004; Le Fevre et al. 2005; Papovich et al. 2006).
However, very little is currently known about the existence, number density and properties of massive galaxies beyond . Mobasher et al. (2005) have recently reported the discovery of a very massive () galaxy in the GOODS-South field at , although a lower- solution has been suggested by Dunlop et al. (2006). Using the Early Data Release (EDR) by the Ultra Deep Survey (UDS) component of the UKIRT Infrared Deep Sky Survey (UKIDSS), McLure et al. (2006) have found nine Lyman-break galaxy candidates at with stellar masses larger than . The formation epochs of such massive galaxies, and of their stellar population contents, cover a wide range of redshifts, whose upper boundary extends well into the re-ionization epoch (Panagia et al. 2005).
A complementary information is offered by very high-redshift quasars (Fan et al. 2003; Fan et al. 2004) located in highly metal-enriched interstellar environments (e.g. Dietrich et al. 2003; Freudling et al. 2003). These cases are a clear indication of already advanced evolutionary stages of the host galaxies at such high redshifts (e.g. Maiolino et al. 2006 and references therein), particularly considering that the identified atomic species are subject to delayed supernova enrichment, requiring activity at very high redshifts. Further information comes also from the detection of thermal dust continuum and molecular emissions in these quasars including the farthest known QSO at , SDSS J1148+5152, indicating the presence of large amounts of dust () and molecular gas () in their circumnuclear environments (Omont et al. 1996; Omont et al. 2003; Bertoldi et al. 2003; Robson et al. 2004). The formation of dust grains requires condensation processes in addition to the stellar activity required to produce the basic elements (C, Si), and in normal conditions occur in the expanding envelopes of evolved stars (AGB, late giants, with evolutionary timescales of ). If the dust heating came from starburst activity, as it has often been suggested, that would imply an enormous star formation rate (SFR) of several hundred to several thousand solar masses per year in the objects.
2 OBSERVATIONS AND SAMPLE SELECTION
Finally, the nuclear black-hole mass estimates of the highest- SDSS quasars range from several times to several times (e.g. Fan 2006), such that even with continuous Eddington-limited accretion they should have started to form at . Although direct dynamical estimates may suggest a kind of break of the relation between the black hole and the host galaxy mass at the highest redshifts (Walter et al. 2004; Peng et al. 2006), it is hard to imagine that such supermassive black holes do not reside in some kind of forming massive galactic bulge.
In conclusion, both directly detected high- galaxies and studies of the metal enriched circumnuclear media in quasars imply enhanced star formation activity at very high redshifts () in some specific cosmic sites. Establishing how frequent the latter are in representative cosmic volumes would set important constraints on galaxy formation models, particularly considering the fast decline of the dark matter halo mass function with increasing redshifts. Indeed, the number densities and mass functions of host galaxies at the highest redshifts are far from settled at the moment, while limited information is available only on the most luminous quasars (e.g. from SDSS & 2DF).
High redshift galaxies are currently selected using a variety of techniques. A very successful approach is based on the detection of the spectral break in the UV continuum blueward of the Ly due to the intervening Ly-forest. By construction, this technique is biased towards star-forming galaxies with rest-frame UV fluxes not strongly reddened by dust extinction (e.g. Steidel et al., 2003; Bouwens et al. 2006). This selection technique is biased against selecting high-redshift galaxies with red spectra, either due to dust extinction or to the presence of mature stellar populations. Thus, other approaches have been recently used to select high- galaxies in a way less affected by biases. A successful example is represented by near-IR surveys with or without additional color or photometric redshift selections (e.g. Cimatti et al. 2002; Franx et al. 2003; Abraham et al. 2004; Daddi et al. 2004), or pure flux-limited optically-selected samples with no color cuts (e.g. Le Fevre et al. 2005), or submillimeter/millimeter selection of dusty galaxies (Smail et al. 2002, Dannerbauer et al. 2004).
The main question is then: are there high redshift galaxies that are missed by the current optical and near-IR selection techniques?
The advent of Spitzer Space Telescope opened a new possibility in this respect as it allows to select samples in a spectral region (3–8m) that was not accessible from the ground. The selection of samples at these wavelengths becomes particularly important for the specific case of high redshift massive galaxies because the 3–8m selection allows to sample the rest-frame near-IR of the high- galaxy Spectral Energy Distributions (SEDs) and is therefore sensitive to their stellar mass rather than to their star formation activity, and also much less affected by dust extinction effects.
![[Uncaptioned image]](/html/astro-ph/0703276/assets/x9.png)
Figure 8 (continued)
![[Uncaptioned image]](/html/astro-ph/0703276/assets/x10.png)
Figure 8 (continued)
![[Uncaptioned image]](/html/astro-ph/0703276/assets/x11.png)
Figure 8 (continued)
In this work, we explored if there are high redshift massive galaxies missed by the conventional selection techniques, but that can be unveiled with Spitzer. For this purpose, we used the multi-wavelength deep imaging data available for the GOODS-South field (130 arcmin2, Giavalisco et al. 2004) and we searched for extreme galaxies in a way complementary to the other selections applied in previous surveys in the same field.
The paper is organized as follows. In Section 2 we present the multi-wavelength photometric data-set and our sample selection criteria. In Section 3 we discuss the model fitting to the observed SEDs, while in Section 4 we analyze the infrared colours of our sample. Section 5 illustrates the X-ray properties of the sample sources. In Section 6 we report the detection of a candidate massive galaxy at . Section 7 presents a general discussion of the statistical properties of our sample. Finally, in Section 8 we summarize the main results of this paper. We adopt for the cosmological parameters = 0.3 and , and . All magnitudes are given in the AB system.
With the aim of studying the multiwavelength photometry of extragalactic sources measured by different instruments, we need to measure the bulk of the emission from each object in each photometric band. Only with such kind of approach an SED can be considered reliable. In our work, we performed aperture photometry in each band.
2.1 Deep Near- and Mid-IR Photometric Imaging
As part of the GOODS project, the Spitzer Space Telescope has recently surveyed the CDFS field in the IR between 3.6 and 8.0 m using IRAC and in the range 24-160 m using MIPS. The fully reduced data were publicly released by the GOODS team and are available through the World Wide Web111http://data.spitzer.caltech.edu/popular/goods.
In this paper we exploit a galaxy catalogue that we have derived from the 3.6 m IRAC public raw data and recently used to derive the luminosity and mass function by morphological type (Franceschini et al. 2006). In order to obtain the most accurate SEDs, we have recomputed the fluxes of each source by performing aperture photometry in the four IRAC bands at the positions originally detected in the IRAC 3.6 m channel. Assuming that essentially all the sample sources are seen as point-like by the IRAC FWHM PSF imager, we computed with SExtractor (Bertin & Arnouts, 1996) the fluxes within a 3.8 arcsec diameter aperture. This choice is supported by an accurate analysis performed by the SWIRE team222http://data.spitzer.caltech.edu/popular/swire/20050603_enhanced_v1/. They constructed color-magnitude diagrams for various types of objects, in particular main-sequence stars. It was then found that the scatter in these diagrams is minimized through the use of a 3.8 diameter aperture, and corresponds to roughly twice the beamwidth. To obtain total fluxes, we then applied the correction factors indicated by the SWIRE team333See Note 2. We have independently verified that the IRAC/SWIRE aperture corrections are consistent with those derived by fitting the radial brightness profiles of stars in the GOODS fields. In the case of extended sources, we used Kron-like magnitudes (AUTOMAG output parameter in SExtractor). Our sample turned out to be % complete above 1 Jy (m3.6=23.9), % complete above 2 Jy (m3.6=23.15), % at 5 Jy (m3.6=22.15), and more than % above 10 Jy (m3.6=21.4).
The MIPS public dataset includes calibrated maps and a catalogue of 24 m sources with flux densities Jy. The photometry is based on a PSF fitting algorithm, where the SExtractor positions of the IRAC sources are used as input to the MIPS source extraction process. The MIPS 24 m PSF was generated from isolated sources in the image, and renormalized based on the aperture corrections published in the MIPS Data Handbook (v2.1, section 3.7.5, table 3.12).
To extend the 24 m sample to fainter fluxes, we have run an independent PSF fitting algorithm that we already successfully applied in the GOODS-xFLS/EN1 Science Verification field (Rodighiero et al. 2006). By these means we have extended the 24 m sample down to Jy.
2.2 Near-IR Ground-based Imaging
As part of GOODS, near-infrared imaging observations of the CDFS have been carried out in the , and bands, using the ISAAC instrument mounted on the ESO VLT. We made use of the publicly available , and imaging (version 1.0, released444http://www.eso.org/ science/goods/releases/20040430/ by the ESO/GOODS team in April 2004). This data release includes 21 fully reduced VLT/ISAAC fields in , and , covering 130 arcmin2 of the GOODS/CDFS region. It also includes mosaics of the coadded tiles as single FITS files in and bands, as well as the corresponding weight maps. To provide a homogeneous photometric calibration across the entire field, all images are rescaled to the same zero point (26.0). The final mosaics have a pixel scale of 0.15”.
We measured the , and band magnitudes with SExtractor at the positions of the 3.6 m IRAC selected sources through circular apertures with diameters of 2 arcsec. Mobasher et al. (2005) found that the photometric curve of growth converges at this aperture, which represents the best compromise between convergence of the total flux and the effects of systematic uncertainty in the background subtraction.
For undetected ISAAC sources, we have initially computed the upper limits to the flux by measuring the signal in 400 random sky positions. We used 2-arcsec aperture diameters and calculate the value of the standard deviation from the distribution of the measured aperture fluxes. We obtained 1 values of 26.12, 25.82 and 25.12 magnitudes for the , and band, respectively. However, given that the depth of the ISAAC imaging varies significantly across the CDFS field, we preferred to compute independent fluxes for each undetected source. Following the approach of Dunlop et al.(2006), we perfomed our own manual photometry through a 2-arcsec diameter aperture at the IRAC-selected positions.
2.3 ACS/HST Optical Imaging
The core of the GOODS project was the acquisition and data reduction of high-resolution HST/ACS imaging obtained as an HST Treasury Program (Giavalisco et al. 2004). The GOODS ACS/HST Treasury Program has surveyed two separate fields (the CDFS and the Hubble Deep Field North) with four broad-band filters: F435W(B), F606W(V), F775W(i) and F850LP(z). In August 2003 the GOODS team released version 1.0 of the reduced, stacked and mosaiced images for all the data acquired over the five epochs of observation. To improve the point spread function (PSF) sampling, the original images, which had a scale of 0.05 arcsec / pixel, have been drizzled on to images with a scale of 0.03 arcsec / pixel.
The dataset is complemented by the ACS/HST catalogues released by the HST/GOODS team in October 2004, containing the photometry in , , and bands. The source extraction and the photometric measurements have been performed by the GOODS team running a modified version of SExtractor on the version 1.0 images. We have considered aperture magnitudes using a 1 arcsec diameter. For undetected IRAC sources, photometry in the ACS , , and bands was measured as upper limits with the same procedure adopted for the ISAAC imaging. We used 1 arcsec diameter apertures and adopted the 3 value as an upper limit to the flux of undetected sources.
| ID | RA | DEC | b | v | i | z | J | H | K | [3.6] | [4.5] | [5.8] | [8.0] | [24] |
|---|---|---|---|---|---|---|---|---|---|---|---|---|---|---|
| J2000 | J2000 | mag | mag | mag | mag | mag | mag | mag | mag | mag | mag | mag | mag | |
| 1 | 53.12440 | -27.88268 | -27.61 | -27.72 | -27.15 | -26.94 | -25.41 | -25.65 | 24.49 | 22.72 | 22.35 | 22.13 | 21.62 | 18.69 |
| 2 | 53.22620 | -27.85910 | -27.61 | -27.72 | -27.15 | -26.94 | -26.19 | -24.97 | 23.95 | 22.58 | 22.32 | 21.92 | 22.20 | 19.03 |
| 3 | 53.06607 | -27.83178 | -27.61 | -27.72 | -27.15 | -26.94 | -25.78 | -25.17 | 23.67 | 22.22 | 22.06 | 21.94 | 22.08 | 19.27 |
| 4 | 53.19752 | -27.81387 | -27.61 | -27.72 | -27.15 | -26.94 | -26.86 | -25.06 | -24.86 | 23.17 | 22.85 | 22.83 | 21.82 | 18.78 |
| 5 | 53.16146 | -27.81118 | -27.61 | -27.72 | -27.15 | -26.94 | -25.45 | 24.94 | 24.15 | 22.11 | 21.81 | 21.60 | 21.37 | 19.63 |
| 6 | 53.15831 | -27.73355 | -27.61 | -27.72 | -27.15 | -26.94 | -25.65 | 24.68 | 24.42 | 22.22 | 21.65 | 21.32 | 20.85 | 19.27 |
| 7 | 53.15552 | -27.71871 | -27.61 | -27.72 | -27.15 | -26.94 | -25.37 | -25.06 | -24.30 | 23.26 | 23.02 | 22.71 | 22.93 | 20.70 |
| 8 | 53.19850 | -27.92742 | -27.61 | -27.72 | -27.15 | -26.94 | -26.27 | –* | 23.92 | 23.23 | 22.86 | 22.64 | 21.87 | 00.00 |
| 9 | 53.13935 | -27.89070 | -27.61 | -27.72 | -27.15 | -26.94 | -26.65 | -25.92 | 25.11 | 22.73 | 22.13 | 21.52 | 21.46 | 19.69 |
| 10 | 53.14963 | -27.87682 | -27.61 | -27.72 | -27.15 | -26.94 | -25.37 | -25.30 | -25.12 | 22.97 | 22.64 | 22.42 | 22.33 | 19.72 |
| 11 | 53.14664 | -27.87103 | -27.61 | -27.72 | -27.15 | -26.94 | -25.37 | -26.30 | 24.09 | 23.03 | 22.47 | 21.99 | 21.44 | 00.00 |
| 12 | 53.12938 | -27.87172 | -27.61 | -27.72 | -27.15 | -26.94 | -25.39 | -25.20 | -24.95 | 23.00 | 22.57 | 22.26 | 21.85 | 00.00 |
| 13 | 53.13809 | -27.86780 | -27.61 | -27.72 | -27.15 | -26.94 | -26.79 | -26.02 | 24.15 | 23.14 | 22.82 | 22.68 | 22.64 | 00.00 |
| 14 | 53.20188 | -27.84421 | -27.61 | -27.72 | -27.15 | -26.94 | -25.55 | -24.88 | 24.37 | 23.10 | 22.76 | 22.51 | 22.35 | 19.40 |
| 15 | 53.03842 | -27.82529 | -27.61 | -27.72 | -27.15 | -26.94 | -26.05 | -25.08 | 24.26 | 22.89 | 22.56 | 22.35 | 22.39 | 00.00 |
| 16 | 53.18194 | -27.81414 | -27.61 | -27.72 | -27.15 | -26.94 | -26.01 | -24.82 | -24.08 | 23.02 | 22.72 | 22.10 | 20.84 | 17.78 |
| 17 | 53.12701 | -27.80455 | -27.61 | -27.72 | -27.15 | -26.94 | -25.54 | -25.38 | 24.04 | 22.74 | 22.55 | 22.39 | 22.46 | 00.00 |
| 18 | 53.18047 | -27.77972 | -27.61 | -27.72 | -27.15 | -26.94 | -25.54 | -24.91 | 23.70 | 22.25 | 22.10 | 21.80 | 21.86 | 00.00 |
| 19 | 53.11983 | -27.74309 | -27.61 | -27.72 | -27.15 | -26.94 | -26.25 | -26.02 | 24.67 | 22.28 | 21.80 | 21.32 | 20.50 | 00.00 |
| 20 | 53.12762 | -27.70684 | -27.61 | -27.72 | -27.15 | -26.94 | -25.37 | -24.82 | 23.82 | 22.62 | 22.41 | 22.33 | 21.92 | 00.00 |
| **footnotetext: Source #8 is out of the band image. |
2.4 Sample Selection
Our main aim is to search for galaxies possibly missed by previous surveys and to find new candidates of high redshift massive systems. In a recent paper, Dunlop et al. (2006) made use of a -band selected sample brighter than AB mag to investigate the high- galaxy population in the GOODS-S field. They conclude that there is no convincing evidence for any galaxies with at .
In order to search for extreme galaxies “dark” at optical wavelengths and ultrafaint in the near-IR, and to be complementary with the selection applied by Dunlop et al. (2006) in the same field, we selected our sample starting from the Spitzer IRAC 3.6 m image, and applied the following selection criteria:
(1) flux-limited selection from the IRAC 3.6 m image down to Jy (m(AB)23.26).
(2) objects undetected in any of the optical HST+ACS images at the 1 level (i.e. )
(3) objects close to the detection limit of the VLT+ISAAC -band deep image ( AB, a complementary criterion to that of Dunlop et al. 2006, including objects with ).
In order to avoid potential photometric uncertainties from the blending due to the large IRAC PSF, we excluded from our sample a few blended sources. We found twenty sources satisfying the above conditions. This final sample was further investigated on ISAAC images: the twenty sources turned out to be all undetected in the -band (at least at the ISAAC sensitivity), while only two candidates showed a faint counterpart in the -band image. Three sources are undetected even in the -band ISAAC image.
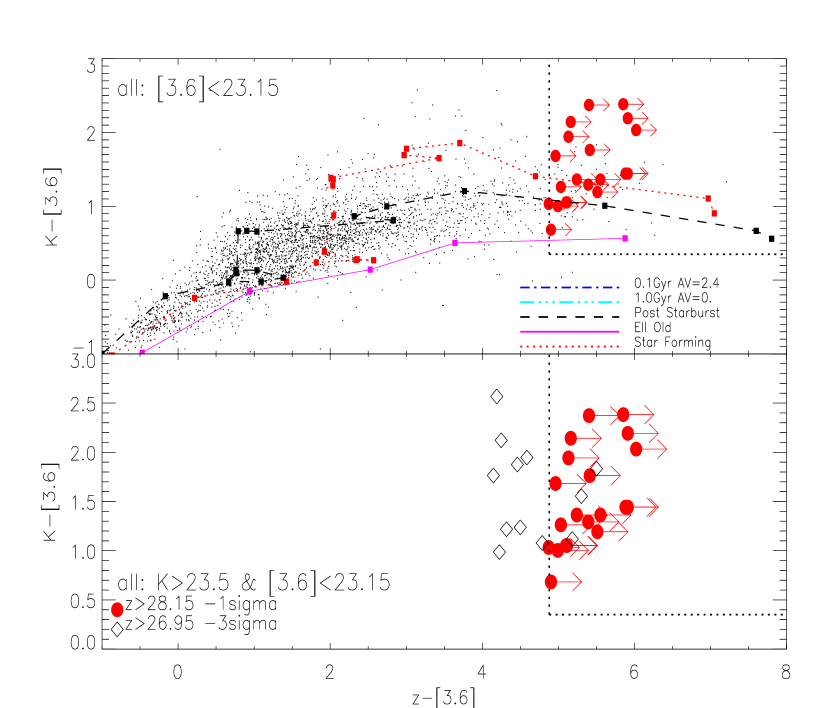
To illustrate the effects of our selection criteria, we report in Figure 1 the versus colours for our complete GOODS/CDFS sample with Jy (top panel). For comparison, we also show here the colour-colour plots of five spectral template SEDs: a 10-Gyr old passive elliptical, a star-forming and a post-starburst galaxy555 The synthetic spectra are taken from the set of template used in Fritz et al. (2007, submitted). The first is taken as representative of a galaxy during a post-starburst phase with a second main episode of star formation –forming of the total stellar mass– at years while the second is build with a main–impulsive burst at Gyr and a continuous star formation which is truncated at years., a solar-metallicity SSP with an age of 1 Gyr (unextinguished) and a younger extinguished SSP of 100 Myr (). The predicted colours are shown as a function of redshift starting from with increasing steps of 0.5 (the value falls in the bottom left part of the panel). The bottom panel zooms onto the colours of our candidate very-high-redshift objects undetected in the -band down to (1 limit), and, for comparison, an additiona sample of objects fainter than (3 limit). The meaning of the symbols is detailed in the caption of Figure 1.
We note that sources, falling in the colour-colour region populated by our final sample, escaped our selection criteria being all brighter in the - and -bands with respect to our imposed constraints ( and ).
A summary of the multiwavelength identifications of the 3.6 m objects is presented in Figure 2: for each sources we report here postage stamps of size in the ACS -band, in the ISAAC and IRAC bands and of in the 24 m MIPS band.
In order to look for any possible faint optical detection, we stacked together the images of all sample sources in the four ACS bands. The result of this stacking procedure is presented in Figure 3, showing the complete absence of optical signal at the position of the selected sources.
The photometric data used to construct the spectral energy distributions discussed in the next Sects. are presented in Table 1. Negative values correspond to upper limits. We adopt a common value of 10% (15%) of the measured fluxes as photometric errors for the IRAC (MIPS) bands, in order to reflect the systematic uncertainties of the instruments The main contributions to these uncertainties are due to the colour-dependence in the flat field and to the absolute calibration (see for example Lacy et al., 2005, and the IRAC and MIPS Data Handbook). For the ISAAC - and -band fluxes, we adopt as photometric error a standard value of 0.3 magnitudes (as derived from the standard deviation statistics from our set of Monte Carlo simulations discussed in Franceschini et al., 2006).
The observational SEDs for all our sample sources are plotted in Figs. 9 and below.
![[Uncaptioned image]](/html/astro-ph/0703276/assets/x13.png)
Figure 9 (continued).
2.5 Contamination by Galactic Stars
We have first considered the possibility that some sources within our sample could be misidentified Galactic cool stars.
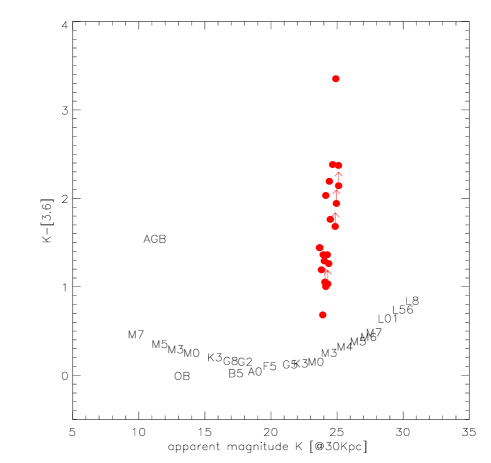
We verified that ultra-cool galactic stars (like M and L dwarfs) show colours (e.g. , see Figure 4) that are in general much bluer than those of our sources. Moreover, the peak of the stellar emissions of M dwarfs falls shortward (m) than observed in the SEDs of our sample666We made use of the colour predictions from the stellar model of Jarrett et al. (1994). We also used the spectral templates of the ISO standard stars available at http://www.iso.vilspa.esa.es/users/expl_lib/ISO/wwwcal/..
Another possible contaminant is represented by evolved dusty stars, like AGBs (in particular carbon stars). The spectra of these objects can in principle reproduce the SEDs of our sample in the 0.4-8.0 m interval range (see again Figure 4). However, the detection of several AGB stars in an area of only 130 armin2 at the magnitude limit of is much in excess of what is e.g. observed in the LMC (Cioni et al., 2006). In addition, such objects are so bright that they should be moved far away from our Galaxy (at least 15 Mpc) in order to match the observed fluxes of our sample objects.
Young stellar objects (YSOs) may also be considered. Although their spectra resemble those of our sources, they are usually associated with extended molecolar clouds in Galactic star-forming regions that are obviously absent in the GOODS-South field.
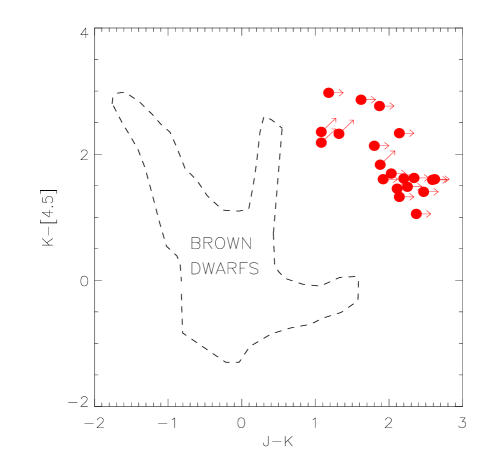
An interesting possibility is the potential contamination by Galactic brown dwarfs. Mannucci et al. (2006) have recently suggested that a pair of faint -dropout sources () in the CDFS are compatible with the expected colours of brown dwarfs. We checked this hypothesis in Figure 5, where we report the colour versus the colour for our candidate high-redshift galaxies. The -band magnitudes appearing in this plot correspond to our 2 value (). The dashed region indicates the expected colours for galactic brown dwarfs (adapted from Mannucci et al., 2006, that used the stellar models of Allard et al., 2001). Clearly, all sources in our sample present colours much redder than expected for brown dwarfs.
3 INFRARED COLOURS
3.1 Near-IR to IRAC Colours
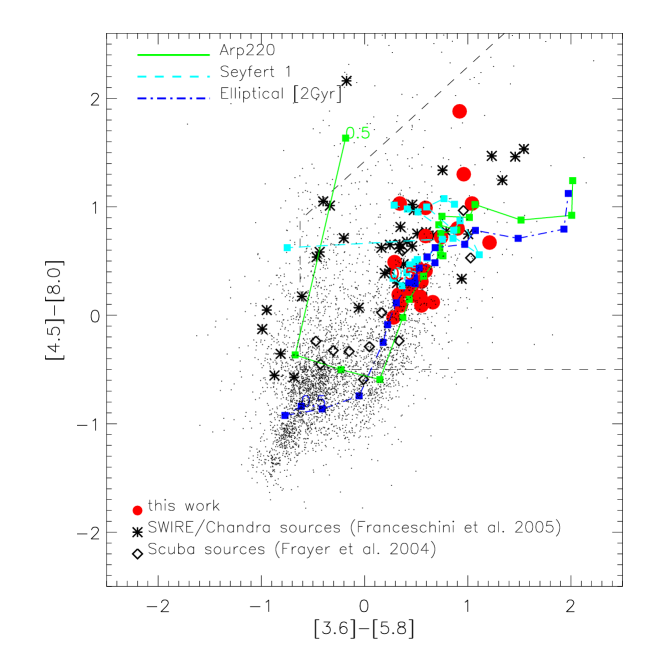
To start constraining the nature of our selected galaxies, we have first compared their mid-IR properties with recently suggested colour-colour diagnostic plots. While the composite spectra of the stellar populations in normal galaxies produce SEDs peaking at approximately 1.6 m, the UV to mid-IR continua of AGNs are dominated by power-law emission. Based on this, Lacy et al. (2004) used IRAC colours from the Spitzer First Look Survey to identify AGNs. A region in the versus colour plot where AGN are expected to lie is shown as a dashed-line contour in Figure 6.
The twenty near-IR dark objects of our sample are plotted as red filled circles. For comparison, we also report the colour distribution (dotted points) of the GOODS/MUSIC sample (Grazian et al. 2006) with Jy. The colour tracks for a dusty starburst (Arp220 - green solid lines), a Seyfert 1 galaxy (dashed cyan lines) and a passive elliptical (dot-dashed red lines) are also shown as a function of redshift, with increasing step size of 0.5, starting from (as marked in the plot for each templates). All sources fall within the AGN area. However, this is not necessarily an indication of an AGN dominance in our sample. Indeed, Fig. 6 also shows the colour distribution of a sample of SCUBA radio-selected sources detected at Spitzer wavelengths (open diamonds, Frayer et al. 2004), and the SWIRE/Chandra sample selected in the EN1 field by Franceschini et al. (2005, asterisks).
Clearly, both starforming galaxies, ellipticals and AGNs at can reproduce the IRAC colours of our sample, showing a limited diagnostic power by the test.
3.2 Near-IR – to – mid-IR colours
It is remarkable to note that half of our 3.6 m selected sources in our sample (11 out of 20) reveal a significant 24 m excess. Given the MIPS and IRAC limiting fluxes, this is inconsistent with a purely passive galaxy at any redshift, and is a clear indication for some activity taking place in the objects. The nature of this activity (star formation, AGN or the concomitance of both processes) will be subject of investigation in the present work.
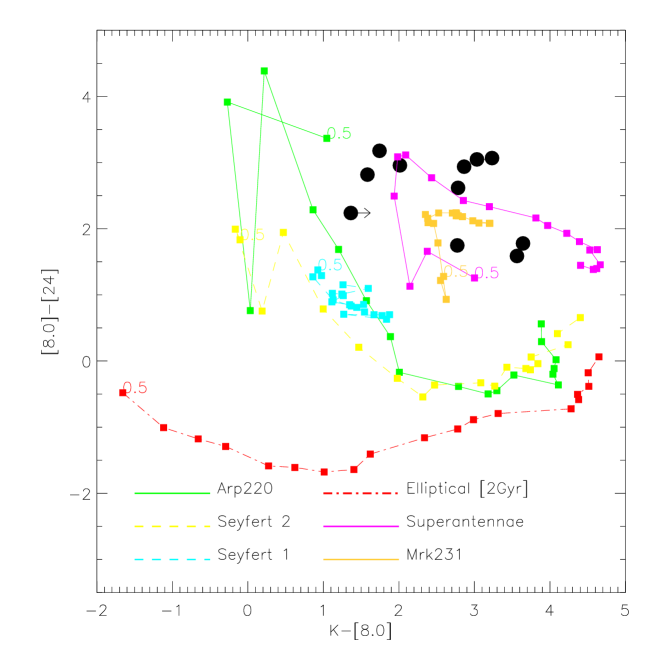
In Figure 7 the colour is shown as a function of the colour (see also Webb et al. 2006), where our sources are plotted as big filled circles. We also report here colour tracks for starbursts galaxies (Arp220 - green solid lines), AGNs (Seyfert 1 - dashed cyan lines, Seyfert 2 - dashed yellow line), a combined quasar/ultraluminous infrared galaxy (ULIRG) sources like the type-1 QSO Mrk 231 (orange solid lines), the type-2 quasar/ULIRG Superantennae (IRAS 19254s; Berta et al. 2003, magenta lines), and a passive elliptical (dot-dashed red lines). These templates are derived from the spectral library reported in Polletta et al. 2006 (see also Franceschini et al. 2005). The predicted colours are shown as a function of redshift with increasing step size of 0.5, starting from (as marked in the plot for each template).
The extremely red infrared colours of our sample are difficult to explain. The colour on the X-axis might be consistent with the SED of a starburst galaxy, like Arp220, or alternatively with a passively evolving galaxy, both at . Lower-redshift solutions require additional extinction () to that of the Arp220 spectrum. The very red ratio may be consistent alternatively with a moderate-redshift () dusty starburst (Arp220), or with a dusty quasar.
The combined set of colours are reproduced only by high redshift () ULIRGs with concomitant QSO activity (the type-2 quasar Superantennae, more marginally by the infrared-luminous type-1 QSO Mrk231). This colour-colour plot of Fig. 7 will be considered in later applications.
4 SPECTRAL ENERGY DISTRIBUTION ANALYSIS
4.1 Synthetic Spectral Models and Photometric Redshift Estimates
We made use of the code (Bolzonella et al. 2000) to estimate the photometric redshifts of each source. The whole broad-band photometric dataset available to us was exploited, with the exclusion of the 24 m flux (the stellar population synthesis model template spectra do not include dust emission). The fitting procedure was based on a maximum-likelihood algorithm and the quality of the fit is investigated by means of a statistics. The code computes the for a given number of templates, which differ for star formation histories, metallicities and ages, and finds the best-fitting template among them.
We used two stellar population synthesis models to fit the observed SEDs: Bruzual & Charlot (Bruzual & Charlot 2003, hereafter BC03) and the Maraston (2005, hereafter MA05) models. In both cases, we assumed exponentially decreasing star formation rates (SFR) parameterized by a time-scale . We have considered the following set of values for : 0.1, 0.3, 1, 2, 3, 5, 15, 30 Gyr. Moreover, we included a case with constant SFR, and a single burst model corresponding to an individual simple stellar population (SSP). For the BC03 model we used a Chabrier Initial Mass Function (IMF). The MA05 evolutionary tracks available to us have been generated with a Salpeter IMF. To convert mass estimates obtained with Salpeter IMF to Chabrier IMF we used a constant value of 0.23 dex (which corresponds to correct the masses computed with Salpeter IMF downwards by a factor 1.7). This value has been obtained by comparing the stellar masses estimated with BC03 models built with different IMFs for an observed spectroscopic sample of galaxies. In this way we obtained the mass difference expected for galaxies with the same colours.
The extinction parameter is allowed to span the widest conceivable range of values (with a step of 0.1). We assumed the extinction law by Calzetti et al. (2000), and the metallicity was set to the solar value, in order to minimize the number of free parameters at play. We also accounted for Lyman-series absorption due to HI clouds in the intergalactic medium, following the prescription of Madau (1995). Even if the reddening is formally allowed to reach extreme values, we remind that values of exceeding 5-6 magnitudes have been observed only in the inner part (i.e. the central 1-2 kpc) of local luminous IR galaxies (e.g. Mayya et al. 2004, Poggianti et al. 2001). In comparison, at high redshift () the dusty submillimeter galaxies have typical average extinction around (Smail et al. 2004, Knudsen et al. 2005). Another class potentially including heavily obscured sources is that of Distant Red Galaxies (DRGs) and dusty Extremely Red Objects (EROs). However, even in this case the reddening has typical values around 3.0 at (Cimatti et al. 2003, Moustakas et al. 2004, Stern et al. 2006, Papovich et al. 2006). An Hyper Extremely Red Object (HERO) has been proposed to lie at =2.4 with =4.5 mag (Im et al. 2002). However, no convincing evidence for galaxies with a global value of exceeding 5-6 mag has been reported until know.
4.2 Additional constraints from 24m flux
With the attempt of reducing the uncertainties in the extinction estimate, we have considered the MIPS 24 m flux in addition to the 0.4-8 m photometric data. The dust emission spectrum longwards of few m (restframe) has been modelled by assuming the observed IR SED of Arp220, and then compared to the flux detected in the MIPS band. The Arp220 IR template corresponds to the spectrum of an highly absorbed ultra-luminous IR starburst, a conservative choice for our analysis.
The predicted IR emission for each one of our objects is calculated as the difference between the unextinguished and the extinguished optical emission, assuming that all the flux absorbed by dust is re-processed and re-emitted longwards of few m. The Arp220 template is then rescaled in such a way that its bolometric emission between 8 and 1000 m coincides with the dust reprocessed luminosity. Finally, the properly scaled Arp220 SED is K-corrected and convolved with the MIPS filter response to compare with the observed 24 m flux or flux upper limit (see also Berta et al. 2004 ). With this procedure, we have been able to use the measured 24 m flux as a constraint on the maximum allowed to each photometric redshift solution.
If compared to other typical LIRG galaxies (e.g. the prototype local starburst M82), the ULIRG Arp 220 is characterized by a much more peaked FIR emission and dust self-absorption. The choice of such an extreme galaxy as an IR template then implies much higher bolometric infrared luminosities for a given 24 m flux, providing an indication of the maximun value of consistent with the observed 24 m flux.
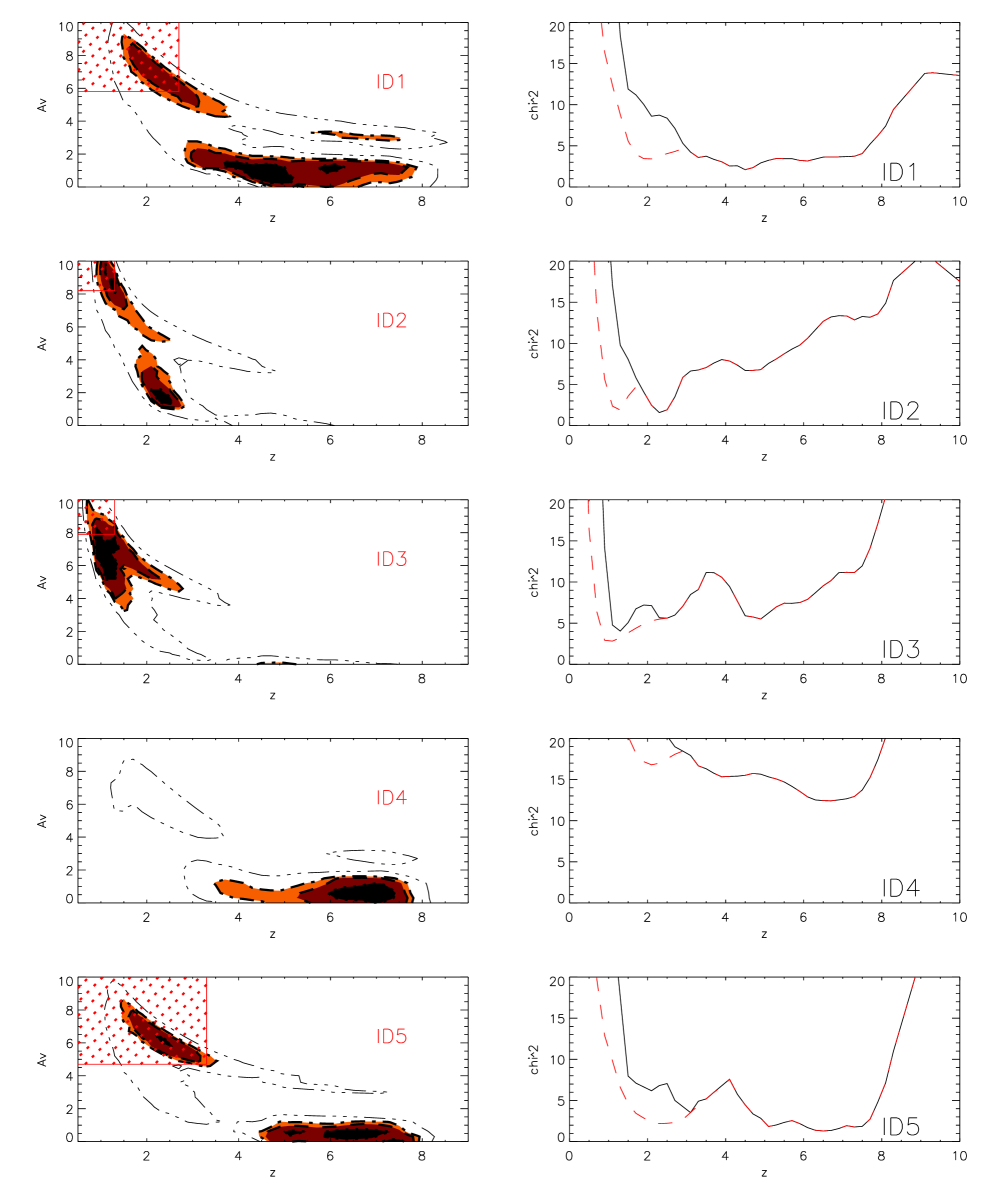
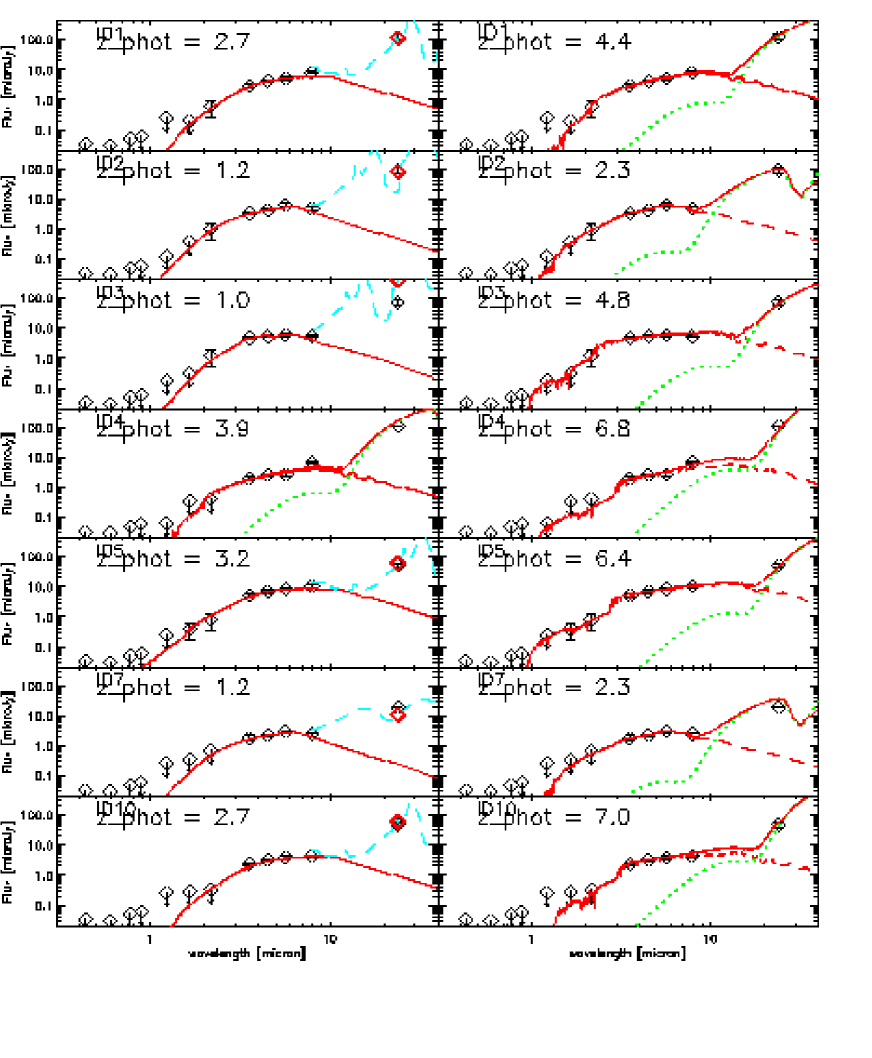
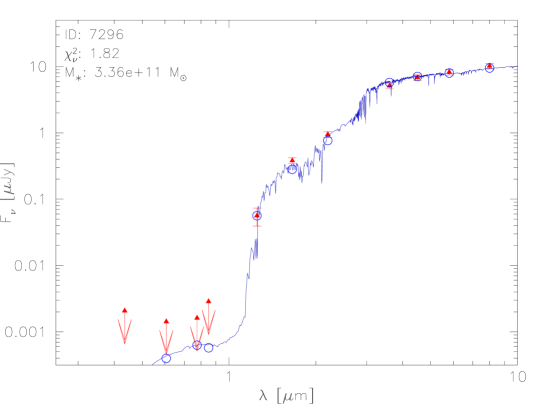
The results of the SED fitting analysis are reported in Figure 8, where for each sources we show on the left panel the confidence levels derived from the statistics (averaged over all the available free parameters) as a function of redshift and , for the BC03 models (the MA05 model provides equivalent results in terms of photometric redshift solutions, see Section 4.4). Dotted, dashed and dot-dashed curves respectively mark the 68%, 90%, 95% and 99.9% confidence levels of the statistics. For each sources, the red shaded area indicates a region of the parameter space which is disfavored by our comparison with the 24 m flux constraint: spectral solutions falling in this range, all heavily dust extinguished, tend to produce 24 m fluxes in excess of the observed values. Although somewhat model-dependent and unable to associate a formal significance value, our analysis is made relatively robust by our reference to the most extinguished object - Arp220 - known at the present cosmic time. In particular, we have verified that the adoption of other IR spectral templates, like that of M82 or other non standard starburt galaxies, would imply somewhat wider extension of such “disfavoured” regions (in the sense that even lower values of the Av parameter would be inconsistent with the measured 24um flux or the adopted upper limits). Note that the squared shape of the shaded area is shown here for illustrative purposes only.
4.3 Results of the SED fitting
On the right panel of Fig. 8 the value of the is plotted as a function of redshift. Different curves show the result of using different extinction ranges in the SED fitting procedure with (solid curve: , red dashed curve: ).
As a first result, this analysis indicates the existence of multi-modal solutions for the majority of our sample sources (14 out of 20, #1, #2, #3, #4, #5, #7, #10, #12, #13, #14, #15, #16,#17, #19), even accounting for the 24 m constraint: generally these objects have statistically degenerate fits with either a lower-redshift () and high-extinguished () SED or with a higher-redshift () and lower extinction. Sources #4 and #19 have best-fit solutions at .
Six sources (#6,#8,#9,#11,#18 and #20) show a single preferential best-fit solution if we consider the constraint from the MIPS emission and if we limit the analysis to the 95% confidence level. This number reduce to three sources (#6, #8 and #11) if this constraint is not taken into account. With the exception of the dusty source #9, all these objects favour a low-extinction solution: four of them lie at . Only source #6 favours an higher redshift best-fit (, see dedicated discussion in Sect. 6.1). In any case, it should be stressed that, even in the case of single best-fit SEDs, the the solutions are only ”formally preferred”, and alternative lower-z fits cannot be ruled-out with any confidence.
Stellar masses are computed using an adapted version of the code which performs SED fitting at a fixed redshift. We report in Table 3 a summary of the best-fit parameters computed by . Only the solutions matching the 24 m constraint are taken into account in the following. The upper panel of the table reports the objects with degenerate bimodal redshift solution. In this case, for each parameter we present the lower redshift primary solution (sol. I) and the secondary solution (sol. II) at higher redshift. Moreover, for each physical parameter we report a range of values: the value reported on the left side of the interval corresponds to the BC03 model expectation, while the value reported on the right side of the interval corresponds to that of the MA05 model. In the lower panel of the table we report the same information for the six sources that we consider to have a single photometric redshift.
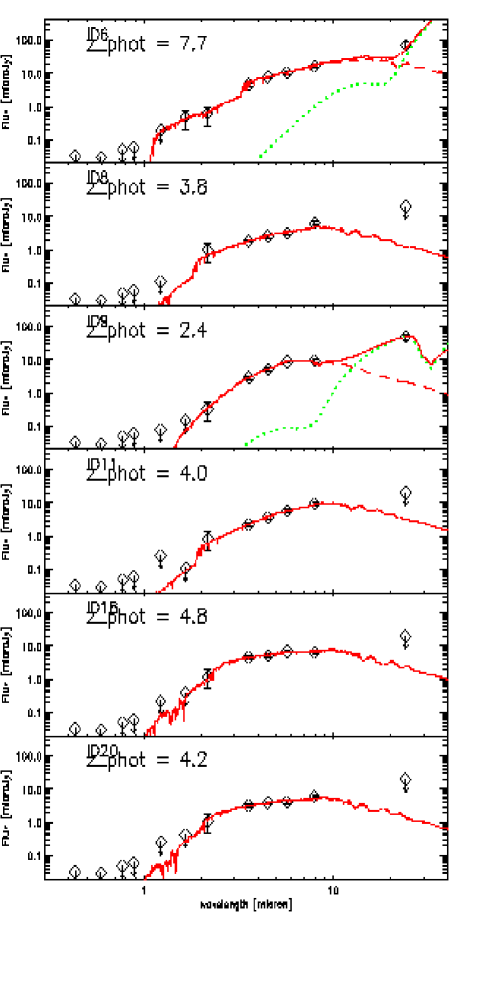
For sources with a bimodal behaviour, we compare in Figure 9 their observed SEDs (open diamonds) with the corresponding low- best-fit solutions (left panel, solid red lines) reported in Table 3 (sol. I), for the BC03 model. Similarly, in the right panel the observed SEDs are shown together with the corresponding best-fit high- solutions (dashed red lines, sol. II in Table 3). Similarly, in Figure 10 we report the best-fit solution for the six non-degenerate objects (solutions presented in the lower panel of Table 3).
4.4 Comparison of the Maraston and Bruzual & Charlot Models
As mentioned in the previous Section, we have considered two independent evolutionary population synthesis models, by MA05 and BC03, in order to check the stability of our results. In Table 3 we report the results for both models. The MA05 model accounts in detail for the contribution of the thermally-pulsating Asymptotic Giant Branch (TP-AGB) phase of stellar evolution. The TP-AGB phase is calibrated with local stellar populations and is the dominant source of bolometric and near-IR energy for stellar populations in the age range 0.2 to 2 Gyr. The two models have an underlying different treatment of convective overshooting and Red Giant Branch stars.
In a recent paper, Maraston et al. (2006) have tested their code on a sample of high-redshift early-type galaxies (), for which the MA05 models indicate younger ages (by a factor up to 6) and lower stellar masses (by 60% on average) with respect to results obtained with the models of BC03.
For our sample we found that the photometric redshifts obtained with the BC03 models are very similar to those obtained with the MA05 model. The bimodal distributions in the () parameter space and the distributions are essentialy equivalent for the two independent models. A similar situation applies for the remaining sources. As can be seen in the second and in the third columns of Table 3 (-phot: sol. I and sol. II), the scatter in the photometric redshift estimates with MA05 and BC03 is very small at both low and high redshifts. When considering the solution at lower redshift, the mean ratio of the photometric redshifts derived from BC03 and MA05, respectively, is 1.04 with an RMS of 0.12, and for the solution at higher redshift the mean ratio of the photometric redshifts is 1.07 with an RMS of 0.18. A slightly larger discrepancy is found for the reddening, with no clear trends.
The most interesting physical parameters are the age and the stellar mass predicted by the two models. In the lower redshift solution the MA05 model predicts older ages than BC03 for only 2 out of our 14 objects. For the higher- solutions (including the six non-degenerate objects), 11 out of the 20 sources with a high- prediction are older for the MA05. As for the stellar masses, we confirm the results of Maraston et al. (2006): in the low- solutions (mean ) the BC03 models predicts in general 50% higher masses on average, and a similar trend is found for the high- (mean ) fits (%).
4.5 Nature of the 24m Emission
As discussed in Sect. 3.2, the excess 24 m emission often observed in the SEDs of our galaxies (Figs. 9 and 10) requires the presence of ongoing star formation or AGN activity.
In the extinguished low-redshift case (), the rest-frame MIPS band samples the emissions by warm dust and PAH molecules. Both a starburst and an AGN emissions are then possible explanations of the 24 m flux. We decided in this case to associate the whole mid-IR flux to a starburst process and adopted the Arp220 SED template (from the spectral library by Polletta et al., 2006). As described in Sect. 3.2, this template has been used to compute the IR luminosity (8-1000 ) of each object matching the observed 24 m flux (dashed cyan lines in Figure 9).
At higher redshifts (), the low values of the extinction favour a scenario dominated by dust-free sources. In this case the 24 m flux has been independently modeled with the emission of a dusty torus reproducing the contribution of a type-2 AGN (Fritz et al. 2006). Again, in Figures 9 and 10 we show the best-fit solutions at high-, superimposed with the type-2 spectral templates that better reproduce the flux ratio (green dotted lines).
5 X-RAY EMISSION AND AGN ACTIVITY
The best independent evidence of nuclear AGN activity in the nuclei of our sources arises if the source is identified as a luminous ( erg/s) X-ray source. X-ray data for a total exposure time of 1 Msec obtained with the Chandra observatory in the GOODS/CDFS field have been published and made publicly available by Giacconi et al. (2002, see also Alexander et al. 2003). We have searched for individual X-ray emission from the 20 objects in the present sample by cross-correlating the IRAC positions of our targets with the positions of X-ray sources as catalogued by Giacconi et al. (2002) and Alexander et al. (2003).
We found that three sources (objects #6, #11 and #13) were individually detected in the X-rays; for all of them the X-ray/IRAC positional difference was smaller than 2′′. The three sources share similar X-ray properties: all of them have soft X-ray spectra and have been detected only in the soft (0.5-2 keV) or full (0.5-8 keV) X-ray band, with counts, i.e. at the limiting flux of the X-ray observation ( erg cm-2 s-1). The large values observed for the X-ray to optical flux ratio (FX/Fopt) are about 10-100 times higher than generally found for AGNs and make these objects “extreme” with respect to the overall X-ray source population. The basic X-ray properties, as drawn from Alexander et al. (2003), are reported in Table 2.
| X-ray IDa | Countsa | Countsa | Countsa | b | best-fit | ||
|---|---|---|---|---|---|---|---|
| 11- 4569 | 217 | 1.90′′ | 17.1 | 1.1 | |||
| 13- 5021 | 205c | 0.21′′ | 43.8 | 29.6 | 2.7 | 4 | |
| 6- 10945 | 232c | 0.06′′ | 17.4 | 13.7 | 3.6 | ||
| aafootnotetext: X-ray data from Alexander et al. (2003) bbfootnotetext: Intrinsic X-ray luminosity at the best-fit photometric redshift, from Table 2 ccfootnotetext: These sources are also present in the Giacconi et al. (2002) catalogue, as XID # 217 and XID #557, respectively, with very similar X-ray parameters ‡‡footnotetext: Following Zheng et al. (2004), Mainieri et al. (2005) associate the observed X-ray emission of #6 (XID #557 in their papers) to a faint optical source at a larger distance from the X-ray centroid (), and derive a photometric redshift . However, the detection of a significant 2.2 m signal in correspondance of the IRAC centroid make object #6 the most likely counterpart to the X-ray sources (see Figure 13). |
The low number of counts prevented us to perform detailed analyses of the X-ray spectral properties of the sources, especially about the amount of gas absorption, given that at (), the 0.5-2 keV observed band corresponds to an intrinsic 2.5-10 keV band (5-20 keV band) and is thus sensitive only to column densities larger than 5 cm-2 (5 cm-2). With a conservative approach, we derived the intrinsic X-ray luminosities, assuming an unabsorbed power-law with at the best-fit source redshifts, and using XSPEC (Version 11.3.1) to translate the observed count rates into rest frame 0.5-10 keV luminosities. The results are reported in Table 2. In all the cases, the X-ray luminosities are in excess of 1043 erg s-1, therefore suggesting that nuclear activity is fuelling the central engine.
Seven sources with a solid X-ray detection ( counts) and undetected at the limit of the GOODS/CDFS observations were already reported by Koekemoer et al. (2004, hereinafter K04), who named these objects Extreme X-ray to Optical objects (EXOs). All of them were subsequently detected in the IRAC channels (Koekemoer et al. 2005) with best-fit photometric solutions in the range (only one being a candidate AGN). Only one of the three X-ray detected objects in our sample, #13, is present in Table 1 of K04. The other two escaped the K04 selection because of the low number of X-ray counts (). Conversely, of the remaining six objects in the K04 sample, five escaped our selection criteria in the IRAC 3.6 m flux (K04 source #4, fainter than 1.8 Jy) or in the -band flux (K04 sources #2,3,5,7 have in our photometry), while K04 source #1 was not considered because of a blending problem in the IRAC 3.6 m image. The fainter -band and X-ray fluxes of the X-ray detected objects in our sample with respect to the published EXOs fit well in the narrow -band to X-ray flux correlation shown in Brusa et al. (2005), and can be an effect of a higher redshift origin.
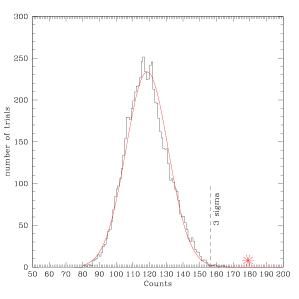
In order to constrain the average X-ray properties of the remaining 17 individually undetected sources, we have applied the “stacking technique”, following Nandra et al. (2002) and Brusa et al. (2002). For the photometry, a circular aperture with a radius of centered at the positions of our sources was adopted. The counts were stacked in the standard soft, hard and full bands (0.5-2 keV, 2-7 keV, and 0.5-7 keV). Extensive Monte Carlo simulations (up to 10,000 trials) have been carried out by shuffling 17 random positions and using the same photometry aperture (2 arcsec). The random positions were chosen to lie in “local background regions” to reproduce the actual background as close as possible. The resulting distributions for the trials are shown in Fig. 11.
No signal has been detected in the hard band, for a total effective exposure time of 14.6 Ms. An excess of counts above 3 of the expected background level was instead clearly detected in the soft and full bands. Assuming an unobscured power-law spectrum, the stacked count rate in the 0.5-7 keV band (2.46e-6 cts s-1, or erg/cm2/s) corresponds to an average 0.5-10 keV rest-frame luminosity of erg s-1, at a z representative redshift. We have verified, by splitting the analysis into various subsamples, that this stacked signal was not due to a few objects brighter than the average, but was uniformly spread in the sample.
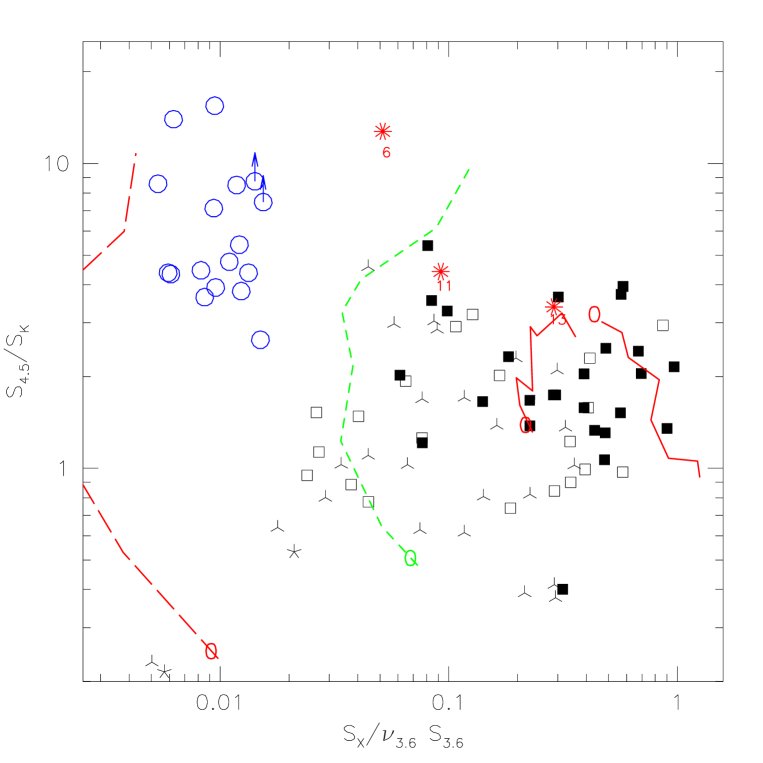
We plot in Figure 12 the ratio of the 3.6 m to total X-ray fluxes against the 4.5 to -band monochromatic fluxes. Our sample sources are the 3 X-ray detected objects (red asterisks) and the 17 individually X-ray undetected sources (blue open circles). For the latter we report the X-ray to 3.6 m flux ratio assuming for all 17 objects the erg/cm2/s total average flux detected through the ”‘stacking”’ analysis. These data are compared with data on an X-ray selected sample by Franceschini et al. (2005), including type-1 and type-2 AGNs (filled and open squares) and type-2 objects dominated by the host galaxy emission (3-legged stars). The lines are the predicted broadband colours as a function of for a type-1 quasar and a Seyfert-1 (the two red solid lines), a Seyfert-2 (the short-dashed line), and Sb spiral/starburst galaxy (red long-dashed line).
Fig. 12 confirms that 3 of our high-z galaxies almost certainly contain an obscured AGN, because they fall in the AGN-dominated region, and in view of their large inferred X-ray luminosities. The remaining individually undetected objects fall in a region intermediate between that of star-forming galaxies and of AGNs. Fig. 12 indicates some probable AGN contributions in the bulk of our high- galaxy sample. These results are then not inconsistent with those of Figs. 6 and 7.
6 CANDIDATE MASSIVE GALAXIES AT VERY HIGH REDSHIFTS
6.1 ID-6: A Very Massive Candidate Galaxy at 8?
We mentioned in Section 4.1 that the SED of source #6 formally favours a photometric redshift at , with a mass of the order of . Given the potential relevance of this finding, we further analyse this object here.
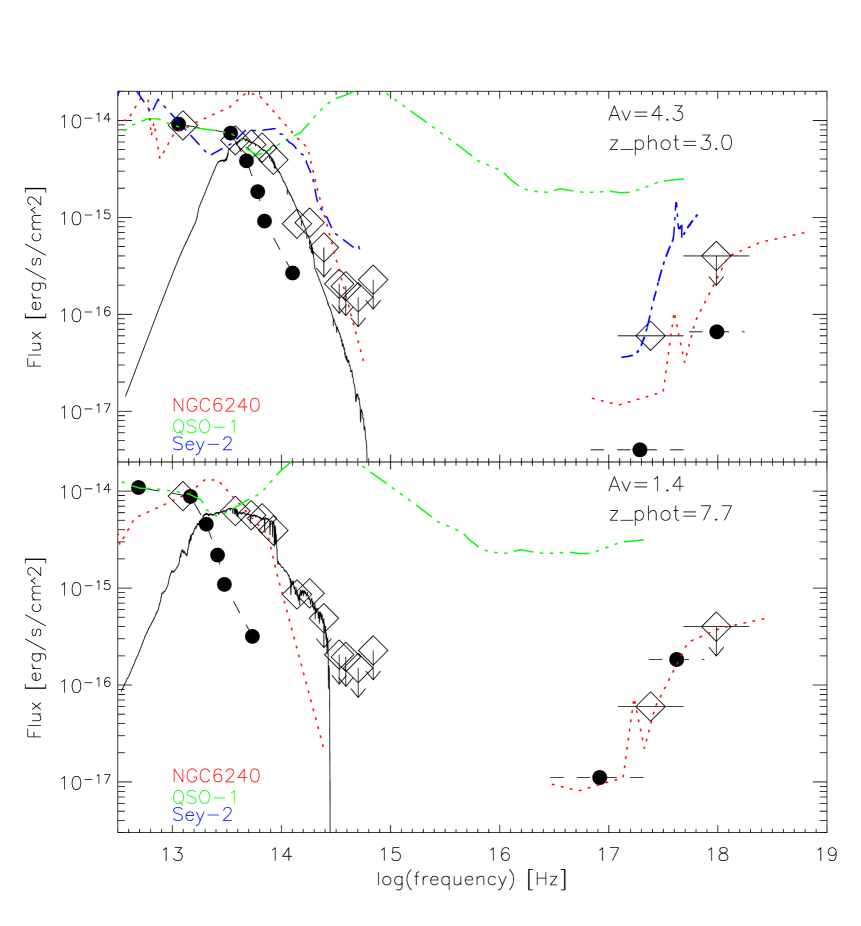
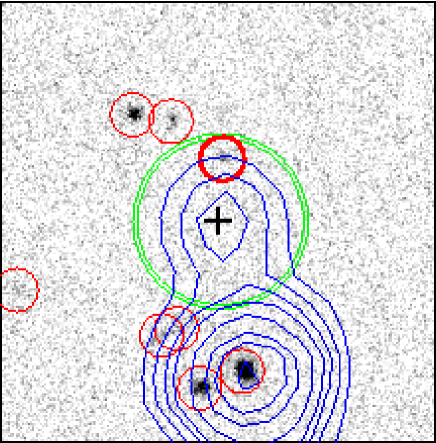
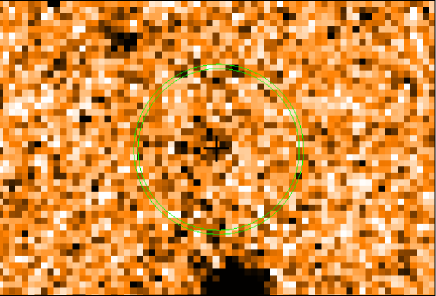
Figure 13 details the multi-wavelength identification of the source. The Chandra X-ray object associated to this source, in particular, has been differently identified by various authors. The left panel in the figure shows a 10”10” map of the HST -band overplotted to the IRAC contours shown in blue. The black cross marks the centroid of the 3.6 m detected source. The (2” radius) double-lined circle represents the position of the X-ray source as reported by Alexander et al. (AID #232), while the red circles (1” diameter) indicate the optical sources detected in the field. The thicker circle marks the optical counterpart for the X-ray source reported by Zheng et al. (2004) and Mainieri et al. (2005). We report in the right panel of Fig. 13 a postage stamp of the -band image, showing that there is a faint but significant 2.2 m source in correspondance with the IRAC centroid and excluding the identification with other sources in the optical map (all at arcsec distances). In addition, the X-ray and IRAC centroids are spatially coincident and clearly indicate the presence of an IR and X-ray source at this position which is completely absent in the optical images.
We have then further investigated the SED properties of this object by combining its IR and X-ray information. The complete observed SED of the source is reported in Figure 14. In the lower panel we consider the primary solution at , while in the upper panel we show for comparison a secondary solution at . This latter was not formally excluded by our analysis, on the basis of the statistics discussed in Section 4.1: a secondary minimum is present at this lower redshift in both panels of Fig. 8. We discuss also this solution in the present section.
In Fig. 14 we compare the SED data for ID#6 with various redshifted prototype spectral templates: a type-1 QSO from Elvis et al. (1994), the type-2 QSO NGC6240 (Hasinger et al. 2001), and a typical Seyfert 2 galaxy, all spanning the entire X-ray-to-infrared wavelength range. For both redshift solutions, the models have been normalized to fit the observed 24 m flux. The black continuous-line spectrum from the near-IR to the UV corresponds to the integrated stellar component solution for the galaxy already found in Sect.4.1 and Figs. 9-10. It is clear that a purely stellar spectrum cannot explain the large observed flux excess at 24m. In the low- solution, this excess can be explained as due to dust re-radiation from either a starburst or an AGN, whereas in the high- hypothesis the only explanation would be a dusty AGN emission. In either case, a type-1 QSO spectrum is entirely inconsistent with the data.
This simple analysis provides interesting hints on the nature of source #6: in particular, if we refer to the spectral template of NGC 6240 normalized at 24 m, the observed X-ray flux is best explained within the higher-z solution, with a redshift of . The low-z, , fit shows instead a difficulty in explaining the X-ray data for both the NGC 6240 and the Seyfert-2 templates, since in both cases there is a mismatch of the 24m to X-ray flux ratio, and excess emission would be expected in the optical/near-IR.
A very interesting comparison of the two redshift solutions is also possible with data on the most luminous Compton-thick quasar recently discovered at (SWIRE J104409.95+585224.8) by Polletta et al. (2006). The SED of this object (redshifted and normalized to the observed 24 m flux) is shown as black filled circles in both panels of Fig.14. Again, for the low- (lower panel) case, the expected quasar X-ray flux would be too faint and undetectable in X-rays. When redshifted to , instead, this quasar spectrum turns out to fit remarkably well the far-IR and X-ray data of source #6: the very high redshift brings the unabsorbed hard X-ray spectrum into the observational soft X-ray wavebands. The optical and near-IR emissions would in any case be due to the stellar component of the host galaxy (solid line, see Sect.4.1).
The analysis presented in this Sect. provides only a qualitative support to the case for a very high-redshift solution for source #6, which would imply the existence of an extremely massive galaxy () at . Clearly, given the potentialy extraordinary nature of this object, the lower-redshift solution apparent in Fig.8 must still be considered the more conservative conclusion. Unfortunately, proving this alternative might turn out impossible before the advent of JWST and ALMA. The implications of such a finding will be discussed in the next Sections.
6.2 ID-5: The Mobasher et al. Candidate High-z Galaxy
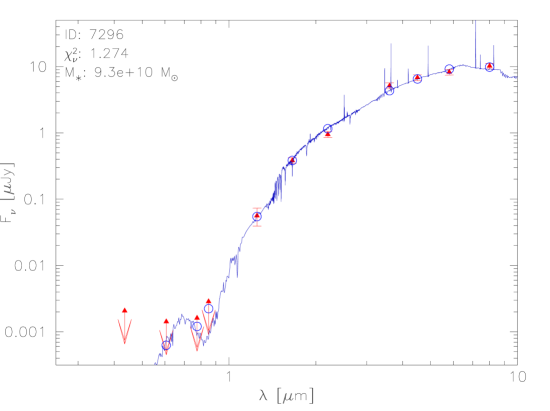
Our object #5 has been originally identified and analysed by Mobasher et al. (2005, object HUDF-JD2), and subsequently discussed by Dunlop et al. (2006) and Fontana et al. (2006), among others. The availability of extremely deep photometric data from UDF and near-IR spectroscopy prompted us to perform a more detailed analysis of this source. To this end we adopted a model by Fritz et al. (2007,in preparation; see also Berta et al. 2005 and Poggianti et al. 2000). The model spectrum is obtained by summing SSP spectra that are weighted by different mass values. Each SSP is extinguished with extinction values that are allowed to vary as a function of age (selective dust extinction). Dust is assumed to be distributed in a uniform screen (). The model computes also the equivalent widths of all relevant interstellar emission lines. Nine SSP spectra have been assumed with ages that were allowed to vary from to , that of the older stars being chosen so as to be consistent with the age of the universe. The best fit model was found with a analysis after convolution with the filter response functions. Furthermore, a constraint was used on the H emission based on the near-IR spectroscopic observations by Mobasher et al.
Making use of the photometric data by Mobasher et al. we explored both the low- and high- solutions for source #5, running our photometric code in the redshift ranges and . In the low- case, we used as a further constraint the H line flux upper limit, which we have taken to be erg/s from Mobasher et al.
Our code found two with photometric redshifts and in the two considered intervals. These values are fully consistent with our preliminary investigations (Sect.4.1). The two solutions are shown in Figure 15. The upper panel corresponds to the =2.82 solution, the lower panel to that at =6.5. The statistics sligthly favours the solution (), but the scenario is equally acceptable (). We have found, in particular, that the lack of any emission signal may still be brought into consistency with this low- interpretation if selective dust extinction (i.e. extinction as a decreasing function of the age of the various contributing stellar populations) is taken into account.
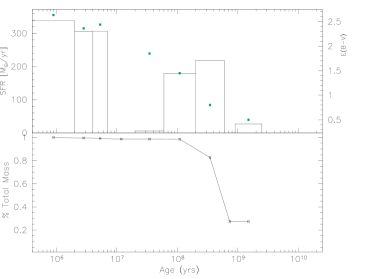
The =6.5 fit corresponds to a single-burst solution, with an age of 0.3 Gyr, that we already found (Sect. 4.1). In Figure 16 we show the SF history retrieved by the model for the =2.82 solution of Fig. 15. In this case the spectrum is reproduced by SSP ranging from to yrs and extinction as a strong function of the SSP age. The bulk of the stellar mass would be produced between and yrs before the observation. In view of all these considerations, the lower redshift solution for galaxy #5 appears as a more likely explanation.
7 MAIN IMPLICATIONS
The results of the analysis presented in this paper are relevant in the general framework of galaxy formation and evolution, and their main implications are hereby outlined.
7.1 Massive Galaxies at 4?
Four sources in our sample (#8, #11, #18 and #20) show a best-fit photometric redshifts around . Solutions at lower redshift produce significantly worse , although they are still formally acceptable. In addition, two more objects (#4 and #19) from the bimodal sample present all the acceptable solutions at high redshift, with fits of comparable quality at and , and very low extinction. We note here that only source #4 is detected at 24m.
All these candidates share similar physical properties with each other. Assuming that is the correct interpretation, in most cases the spectral best-fit solutions correspond to either the single-burst model (see Sect. 4.1) or to an exponentially declining SFR with short decay time-scale Gyr. The typical ages are of the order of 1 Gyr or younger with the BC03 models (1.4 Gyr with the MA05 model). The SEDs are then consistent with galaxies at observed several hundred million years after a powerful burst of star formation producing stellar masses around with both the MA05 and BC03 models, and for a Chabrier IMF.
At lower redshifts, numerous massive () and old (1-4 Gyr) early-type galaxies have been recently detected from -band selected surveys in the range (Cimatti et al. 2004, McCarthy et al. 2004, Glazebrook et al. 2004, Daddi et al. 2005, Saracco et al. 2005, Kriek et al. 2006). Similar detections at slightly higher redshift have also been recently reported (, Brammer & van Dokkum, 2007) The photometric modelling generally suggests that these passive systems should have formed all their stars at 3 in a short burst.
Our sources appear to be among the oldest stellar systems at , given that the estimated ages are close to the age of the Universe at that redshift. The post-starburst nature of our sources and their typical large stellar masses around suggest that they could be seen as the progenitors for the most massive spheroids that are observed around . Moreover, as already mentioned, the population is mostly undetected at 24 m, making the passively evolving nature of these sources a plausible hypothesis.
One of this galaxies (#11, see Sect.5 and Fig.12) has been detected in X-rays and is consistent with hosting an obscured AGN. X-ray emissions from all the other 5 objects mentioned in this Section have been investigated by us via a stacking analysis, which has detected significant average signal (at better than 3).
7.2 Extremely dusty starbursts at ?
As mentioned in Sect. 4.1, the remaining fraction of the sources in our sample show a strong bimodality in the photometric redshift solutions. We also showed there that these objects are consistent with a population of heavily dust-enshrouded starbursts at redshift , since only few of them are undetected at 24 m . Based on this flux, we have computed the instrinsic bolometric luminosity, (see discussion in Sect. 4.1.
The derived luminosities qualify most of these sources as ULIRGs (). Assuming that the mid-IR emission is mostly contributed by star-formation processes, we can translate the IR luminosity into a SFR adopting the standard relation of Kennicutt et al. (1998). The derived SFRs have a median value , even greater than the typical value of submillimetre selected galaxies at (, Chapman et al. 2004). The large bolometric luminosities () implied by our photometric analysis and the instrinsic large extinction required (), make our sample very similar to the optically obscured sources identified by Houck et al. (2005) and could represent the most extreme cases of dusty galaxies detected until now.
It seems likely, however, that part of this IR emission may be due to an AGN contribution, if we consider that the average X-ray signal and the corresponding X-ray-to-3.6 m flux ratios in Fig. 12 reveal X-ray activity in excess of that expected from star-forming galaxies.
In spite of the intrinsic uncertainties in the photometric solutions, we have computed the contribution of these sources to the SFR density of the Universe by assuming that their far-IR emission is mainly contributed by star formation processes. We have made us for this of the estimator (see more details in Sect. 8). Even including all objects with a photometric- solution in the redshift range and detected at 24 m (#1, #2, #3, #5, #7, #9, #10, #14, and #16), we found that these sources missed by optical surveys contributes for only 20% to the global SFR density at . We obtained a value of =0.026 (see Perez-Gonzalez et al. 2005 for a recent compilation of the Lilly-Madau diagram of IR-selected galaxies).
7.3 Massive Evolved Post-Starburst Galaxies at ?
The fourteen sources with bimodal photometric redshift solutions (upper panel in Table 3) have all a secondary best-fit in the redshift range , see Sect. 4.1 and Fig. 10, and appear to have been detected less than 1 Gyr after a powerful burst of star formation producing a stellar mass of the order of .
Two sources in particular, (#4 and #19) have formally better solutions at and predicted masses from both evolutionary synthesis models. In addition, source #6 has a best-fit at . These three sources have predicted ages for their stellar populations of Myr at their estimated photometric redshifts of 6.8, 6.2 and 7.7, in the order. Would all these sources be at galaxies, then these would have formed the bulk of their massive stellar populations at very high redshift, , in a period of several tens million years before entering a quiescent phase. This would have required an enormous star formation activity, with rates of the order of .
Two objects (#4 and #6) have MIPS detections at 24 m and one is bright in X-rays (# 6), which could only be interpreted at such high redshifs as the signature of a luminous type-2 obscured quasar within their nucleus (this conclusion being proposed also by Mobasher et al. for source #5/HUDF-JD2). Mobasher et al. also estimated the size of the dark matter halo required to host the stellar mass of source #5/HUDF-JD2 and found a value of (if the estimated stellar mass of the source is at and a Salpeter IMF is considered).
Assumed such high redshifts and the associated huge energetics from both star formation and black-hole gravitational accretion, this would have had an important role in the reionization of large surrouding volumes of the Universe, starting the process at redshifts as high as (Panagia et al. 2005). The detection of three comparably massive sources within the same small sky region (130 square arcmin) would support the hypothesis that the reionization of the Universe might be dominated by such massive galaxies.
However, two of the very high-redshift galaxy candidates have lower- best-fit solutions of comparable quality, which are obviously much more likely. Only for source #6 the high-z () fit is formally preferred to the low-z one (Sect. 6.1).
At this stage, and waiting for more decisive future observations with JWST and ALMA, we can only set a (stringent) limit to the existence of massive evolved galaxies at very high redshifts.
8 CONTRIBUTION TO THE COMOVING STELLAR MASS DENSITY AT HIGH Z
Given the significance of the massive galaxy population at (Sect. 7.1), and even that of the candidates (Sect. 7.3), it is worthwhile to attempt to compare their contribution to the global comoving stellar mass density with those already derived from other independent surveys at those redshifts. We have computed it by using the estimator (see e.g. Franceschini et al. 2006 for an application). Our evaluation should be considered a lower limit to the comoving mass density because our sample is not purely flux-limited (we have excluded blended sources and have applied various colour limits, see Sect. 2.4).
(A) We have limited our analysis to the more massive galaxies, those with . For the galaxies described in Sect. 7.1, we have computed for each sources the effective co-moving volume of the survey (defined by the survey area and the redshift interval, , within which each of the candidates could have been detected, with ). To determine , we have taken the best-fit SED to each candidates and redshifted it until its flux falls below our limit (Jy), and taken as the minimum of the corresponding redshift and our upper boundary of the redshift interval, z=4.7 (for most of our objects , corresponding to a survey volume for our adopted cosmology). We have derived two estimates of the mass density based on the MA05 and BC03 spectral solutions reported in Table 3.


We report in Figure 17 the contribution of our galaxies to the stellar mass function at . The shaded region corresponds to the data reported by Drory et al. (2005), of which we have considered an average of their mass functions in the two redshift bins and . The lower and upper envelops of the region correspond to the mass functions derived by Drory et al. in the GOODS/CDFS and FORS Deep Field, respectively. The filled square marks our estimated contribution to the mass function by our galaxies. The vertical thick errorbar corresponds to our overall uncertainty, in which the lower limit corresponds to stellar mass values computed with MA05 (based only on 3 objects with favoured photo- at =4, #11, #18, and #20), while the upper bound is based on BC03 fits (including 3 sources with favoured photo- at =4,#11, #18, and #20, and additional 7 galaxies having bimodal photo- solutions, one of which solutions is within , #1,#3,#4, #12,#14,#15 and #19, see Sect.7.2 above).
Figure 18 compares our estimated number density at of galaxies more massive than with literature data at different redshifts. The open circle at is the estimate for LBGs with recently derived by McLure et al. (2006), filled circles are from the GOODS/CDFS -band selected sample of Caputi et al. (2006), and open diamonds from Drory et al. (2005) in the same mass range. Altogether, our very red galaxies account for a large fraction of the galaxy mass density at and are among the most massive galaxies currently known at such redshifts.
(B) As already discussed, our conclusions at higher redshift are subject to major uncertainties because of the degeneracy in the solutions for half of our sample (Sections 7.3 and 4.1). However, a maximal and minimal case for the contribution to the stellar mass density implied by our analysis may give interesting insight. For the galaxies described in Section 7.3 with a photometric solution in the redshift range , we then estimated such contribution as for the case, again, we have limited our analysis to the more massive galaxies, those with . The result of this computation is shown in Figure 18 as the filled square at . The vertical thick errorbar corresponds to the overall uncertainty, in which the lower limit corresponds to stellar mass values computed only with source #6 (the unique object in our sample with a clearly favoured solution at high redshift), while the upper bound includes six sources (#4, #5, #6, #10, #12, #16, and #19).
The search for galaxies has so far been mainly performed with the traditional Lyman dropout colour selection technique (Steidel et al. 1999). Lyman Break Galaxies (LBGs) are associated with starburst galaxies at high redshifts, identified by the colours of their far ultraviolet spectral energy distribution around the 912 Lyman continuum discontinuity (Giavalisco et al. 2002). It has been recently suggested that 60% of the stellar mass at is missed by the traditional drop-out selection technique (Stark et al. 2006), which exclude high-redshift galaxies too red in the rest-frame UV to fall under the LBG selection (McLure et al. 2006).
A fraction of our galaxies might represent a complementary sample of mature and red galaxies which would, by definition, not be selected by the Ly break or other methods making use of the optical-UV rest-frame emission. Our results in Figs. 17 and 18 show that the contributions by this new, previously unaccounted, population is definitely non-negligible if not to dominate the galaxy mass function at the highest . These objects, all escaping detection by published optically-selected or K-band selected samples, would almost double the estimated value for the high-end of the galaxy mass function (Drory et al. 2005; Fontana et al. 2006) at that redshift.

Would this reassessment of the galaxy mass function still be consistent with standard CDM model expectations at such high redshifts? Following McLure et al. (2006) and Dunlop et al. (2006), we report in Fig. 18 the redshift evolution of the number density of dark matter halos with masses of (soli line), matching the number density of galaxies with at (adapted from figure 5 of McLure et al. 2006). The proposed model corresponds to a ratio between halo and stellar mass of (see discussion in McLure et al. 2006). Looking at Fig. 18 we can see that the number density of our massive sources at is a factor 2-8 (with MA05 and BC03, respectively) lower than the predicted number of dark matter halos. Even if our data is only a lower limit, this implies that our estimated number density of massive galaxies at is still consistent with the current predictions of CDM models for the hierarchical formation of cosmic structures.
9 DISCUSSION AND CONCLUSIONS
Recent observational progress has revealed the existence of massive structures (galaxies and galaxy aggregates) at high redshift much more frequently than originally supposed. Indeed, the problem for any attempts to predict the origin of galaxies from first principles is dealing with the very complex physical processes involving baryons (e.g. Somerville et al. 2001, Somerville et al. 2004). Observations have also shown an unexpected trend for the most massive part of the galaxy mass function to be put in place first, and lower mass galaxies to keep forming stars at lower redshifts (Cowie et al. 1996; Franceschini et al. 1998, 2006; Bundy et al. 2005).
At the present stage, however, the timing for and the physical processes accompanying the emergence of massive galaxies with cosmic time, which would be so informative for our understanding of galaxy formation, are essentially unknown. A problem here is that the most efficient tool to identify very high-redshift galaxies, the Ly-dropout technique, is not sensitive to galaxy mass but rather to UV flux.
The advent of sensitive imagers in the near-IR atmospheric JHK bands and particularly of the Spitzer IRAC space facility have started to provide new powerful selection tools more sensitive to the host stellar mass. Several reports have been recently appeared about searches for massive galaxies at and the evolution of the stellar mass function (Stark & Ellis 2006; Yan et al. 2006; McLure et al. 2006; Grazian et al. 2006; Fontana et al. 2006). Most of these have in any case exploited the Ly-dropout approach and pushed it to the reddest optical bands for the highest- characterization and used IRAC data to constrain the stellar mass.
Dunlop et al. (2006; see also Mobasher et al. 2005) followed a complementary method of carrying out an extensive SED-fitting analysis on large flux-limited samples without preconceived assumptions about the rest-frame spectrum of the candidates, and by using as reference a K-band selection with . They conclude in favour of a lack of evidence for very massive galaxies to be in place at .
We follow a similar approach here, but extend it to a galaxy selection based on the most sensitive Spitzer 3.6 m IRAC images in the 130 arcmin2 GOODS CDFS, a -selection complementary to that of Dunlop et al. ( AB mag), and non-detection in any GOODS optical bands. By these means we were aiming at detecting the most massive and highest redshift galaxies in the field to the 3.6 m limiting flux, and keeping equally sensitive to dusty star-forming and massive evolved galaxies at high .
Our results in terms of the stellar mass and redshift for such extreme 3.6 m selected galaxies are summarized in Figure 19, where we plot the stellar mass versus photometric reshift estimated from SED fitting. Data for the 6 galaxies with favoured single photo-z solution in our discussion, are shown as filled squares, while for the remaining 9 galaxies results of both the lower- fits (filled triangles) and the higher- ones (open triangles) are reported.
Given the uncertainties in the photometric redshift solutions, our results are consistent with previous reports, and point towards very few of the galaxies in the field being found at , with only one such extreme case (galaxy #6) being formally indicated (though a lower- fit is still acceptable). Two other, similarly massive, galaxies are consistent with solution but do not require it. Remarkably, and similarly to what found by Dunlop et al., two of the three candidates have solid detections in the Spitzer MIPS 24 m band. However, differently from Dunlop et al., we do not consider this as necessarily an argument in favour of a lower- case, because the presence of an obscured AGN could easily explain it. Indeed, we have found some evidence for (optically) hidden AGNs in the majority of our sample of very red high-redshift galaxies from the ultra-deep Chandra X-ray data (Fig. 12), which adds to the frequently observed mid-IR 24 m excess. We concluded from this that there might be room for substantial contribution to re-ionization to happen in relation with star-formation and AGN activity in massive galaxies.
One major result of our analysis is about the potential existence of a candidate population of massive galaxies detected around redshift 4. The majority of our sample galaxies (14 out of 20) have a photo- solution at , and 4 of them have best-fit solutions in this redshift interval (not formally unique, however). Hence, in spite of the small numbers, a galaxy population undetected in the optical and extremely faint in the -band appears to possibly dominate the massive end of the galaxy mass function at . These objects, all escaping detection by published optically-selected or K-band selected samples, would almost double the estimated value for the high-end of the galaxy mass function (Drory et al. 2005; Fontana et al. 2006) at that redshift.
Several of these evolved galaxies (none of the 4 with robust solution, but 4 of the 7 with ”‘secondary”’ solution at such ) display strong excess emission at 24 m. This result is similar to that reported by Dunlop et al. (2006) for their selected very high- population. Due to the large redshifts, this would correspond to rest-frame emission at 4-5 m, hence would be difficult to explain purely as dust reprocessing by star-forming regions. Again this result requires rather common AGN activity in these high- evolved galaxies. A support to this interpretation comes from the deep X-ray data, revealing 2 galaxies with bona-fide photometric- to have clear AGN-like emissions (with ), and the remaining objects also showing excess X-ray flux (Fig. 12), although at a lower level. Some evidence for probable AGN contributions at 8 and 24 m was also found directly in the colour-colour plots of Figs. 6 and 7.
This widespread association of very high- galaxies with trace obscured AGN activity might bring an interesting confirmation of the emergent view (e.g. De Lucia et al. 2005; Bower et al. 2006; Granato et al. 2004) that AGN feedback could have systematically influenced the shaping of the galaxy mass function during the epoch of galaxy formation.
ACKNOWLEDGMENTS
This work is based on observations made with the Spitzer Space Telescope, which is operated by the Jet Propulsion Laboratory, California Institute of Technology under NASA contract 1407. ESO/GOODS observations have been carried out using the Very Large Telescope at the ESO Paranal Observatory under Program ID(s): LP168.A-0485 . The NASA/ESA is operated by the Association of Universities for Research in Astronomy (AURA), Inc., under NASA contract NAS5-26555. We thank the referee for his/her detailed comments and suggestions that improved the quality of our work. We warmly thank Claudia Maraston from providing us with her evolutionary model predictions in electronic form and Alvio Renzini, Stefano Berta and Vincenzo Mainieri for useful discussion.
References
- Abraham et al. (2004) Abraham, R. G., et al. 2004, AJ, 127, 2455
- (2) Alexander D.M., Bauer F.E., Brandt W.N., et al. 2003, AJ, 126, 539
- Allard et al. (2001) Allard, F., Hauschildt, P. H., Alexander, D. R., Tamanai, A., & Schweitzer, A. 2001, ApJ, 556, 357
- Berta et al. (2003) Berta, S., Fritz, J., Franceschini, A., Bressan, A., & Pernechele, C. 2003, A&A, 403, 119
- Bertin & Arnouts (1996) Bertin E., Arnouts S., 1996, A&AS, 117, 393
- Bertoldi et al. (2003) Bertoldi, F., et al. 2003, A&A, 409, L47
- Bolzonella et al. (2000) Bolzonella, M., Miralles, J.-M., & Pelló, R. 2000, A&A, 363, 476
- Bouwens & Illingworth (2006) Bouwens, R., & Illingworth, G. 2006, New Astronomy Review, 50, 152
- Bower et al. (2006) Bower, R. G., Benson, A. J., Malbon, R., Helly, J. C., Frenk, C. S., Baugh, C. M., Cole, S., & Lacey, C. G. 2006, MNRAS, 370, 645
- Brammer & van Dokkum (2007) Brammer, G. B., & van Dokkum, P. G. 2007, ApJ, 654, L107
- (11) Brusa M., Comastri A., Daddi E., et al. 2002, ApJ, 581, L89
- (12) Brusa M., Comastri A., Daddi E., et al. 2005, A&A, 432, 69
- Bruzual & Charlot (2003) Bruzual, G., & Charlot, S. 2003, MNRAS, 344, 1000
- Bundy et al. (2005) Bundy, K., Ellis, R. S., & Conselice, C. J. 2005, ApJ, 625, 621
- Calzetti et al. (2000) Calzetti, D., Armus, L., Bohlin, R. C., Kinney, A. L., Koornneef, J., & Storchi-Bergmann, T. 2000, ApJ, 533, 682
- Caputi et al. (2006) Caputi, K. I., McLure, R. J., Dunlop, J. S., Cirasuolo, M., & Schael, A. M. 2006, MNRAS, 366, 609
- Chapman et al. (2004) Chapman, S. C., Smail, I., Windhorst, R., Muxlow, T., & Ivison, R. J. 2004, ApJ, 611, 732
- Cimatti et al. (2002) Cimatti A., Pozzetti L., Mignoli M. et al., 2002, A&A, 391 1
- Cimatti et al. (2003) Cimatti, A., et al. 2003, A&A, 412, L1
- Cimatti et al. (2004) Cimatti A., Daddi E., Renzini A. et al., 2004, Nature, 430, 184
- Cioni et al. (2006) Cioni, M.-R. L., Girardi, L., Marigo, P., & Habing, H. J. 2006, A&A, 452, 195
- Cowie et al. (1996) Cowie, L. L., Songaila, A., Hu, E. M., & Cohen, J. G. 1996, AJ, 112, 839
- Daddi et al. (2004) Daddi E. et al., 2004, ApJ, 600, 127L
- Daddi et al. (2005) Daddi, E., et al. 2005, ApJ, 626, 680
- Dannerbauer et al. (2004) Dannerbauer, H., Lehnert, M. D., Lutz, D., Tacconi, L., Bertoldi, F., Carilli, C., Genzel, R., & Menten, K. M. 2004, ApJ, 606, 664
- De Lucia et al. (2006) De Lucia, G., Springel, V., White, S. D. M., Croton, D., & Kauffmann, G. 2006, MNRAS, 366, 499
- Dietrich et al. (2003) Dietrich, M., Hamann, F., Shields, J. C., Constantin, A., Heidt, J., Jäger, K., Vestergaard, M., & Wagner, S. J. 2003, ApJ, 589, 722
- Drory et al. (2005) Drory, N., Salvato, M., Gabasch, A., Bender, R., Hopp, U., Feulner, G., & Pannella, M. 2005, ApJ, 619, L131
- Dunlop et al. (2006) Dunlop, J. S., Cirasuolo, M., & McLure, R. J. 2006, ArXiv Astrophysics e-prints, arXiv:astro-ph/0606192
- Elvis et al. (1994) Elvis, M., et al. 1994, ApJS, 95, 1
- (31) Fan, X., Strauss, M. A., Schneider, D. P., et al., 2003, AJ, 125, 1649
- Fan et al. (2004) Fan, X., et al. 2004, AJ, 128, 515
- Fontana et al. (2004) Fontana, A., et al. 2004, A&A, 424, 23
- Fontana et al. (2006) Fontana, A., et al. 2006, ArXiv Astrophysics e-prints, arXiv:astro-ph/0609068
- Fan (2006) Fan, X. 2006, Memorie della Societa Astronomica Italiana, 77, 635
- Franceschini et al. (1998) Franceschini, A., Silva, L., Fasano, G., Granato, G. L., Bressan, A., Arnouts, S., & Danese, L. 1998, ApJ, 506, 600
- Franceschini et al. (2005) Franceschini, A., et al. 2005, AJ, 129, 2074
- Franceschini et al. (2006) Franceschini, A., et al. 2006, A&A, 453, 397
- Franx et al. (2003) Franx, M., et al. 2003, ApJ, 587, L79
- Frayer et al. (2004) Frayer, D. T., et al. 2004, ApJS, 154, 137
- Freudling et al. (2003) Freudling, W., Corbin, M. R., & Korista, K. T. 2003, ApJ, 587, L67
- Fritz et al. (2006) Fritz, J., Franceschini, A., & Hatziminaoglou, E. 2006, MNRAS, 366, 767
- Giacconi et al. (2002) Giacconi, R., Zirm, A., Wang J., et al. 2002, ApJS, 139, 369
- Giavalisco (2002) Giavalisco, M. 2002, ARA&A, 40, 579
- Giavalisco et al. (2004) Giavalisco, M., et al. 2004, ApJ, 600, L93
- Glazebrook et al. (2004) Glazebrook, K., et al. 2004, Nature, 430, 181
- Granato et al. (2004) Granato, G. L., De Zotti, G., Silva, L., Bressan, A., & Danese, L. 2004, ApJ, 600, 580
- Grazian et al. (2006) Grazian, A., et al. 2006, A&A, 449, 951
- Jarrett et al. (1994) Jarrett, T. H., Dickman, R. L., & Herbst, W. 1994, ApJ, 424, 852
- Hasinger et al. (2001) Hasinger, G., et al. 2001, A&A, 365, L45
- Hopkins & Beacom (2006) Hopkins, A. M., & Beacom, J. F. 2006, ArXiv Astrophysics e-prints, arXiv:astro-ph/0601463
- Houck et al. (2005) Houck, J. R., et al. 2005, ApJ, 622, L105
- Kennicutt (1998) Kennicutt, R. C., Jr. 1998, ARA&A, 36, 189
- Knudsen et al. (2005) Knudsen, K. K., et al. 2005, ApJ, 632, L9
- (55) Koekemoer A., et al., 2004, ApJ, 600, L123
- (56) Koekemoer et al. 2005, Growing black holes: accretion in a cosmological context. Proceedings of the MPA/ESO/MPE/USM Joint Astronomy Conference held at Garching, Germany, 21-25 June 2004. A. Merloni, S. Nayakshin, R. A. Sunyaev (Eds.). ESO astrophysics symposia. pag. 120
- Kriek et al. (2006) Kriek, M., et al. 2006, ApJ, 649, L71
- Im et al. (2002) Im, M., Yamada, T., Tanaka, I., & Kajisawa, M. 2002, ApJ, 578, L19
- Labbé et al. (2005) Labbé, I., et al. 2005, ApJ, 624, L81
- Lacy et al. (2004) Lacy, M., et al. 2004, ApJS, 154, 166
- Lacy et al. (2005) Lacy, M., et al. 2005, ApJS, 161, 41
- Le Fèvre et al. (2005) Le Fèvre, O., et al. 2005, Nature, 437, 519
- Madau (1995) Madau, P. 1995, ApJ, 441, 18
- Mainieri et al. (2005) Mainieri, V., et al. 2005, A&A, 437, 805
- Mannucci et al. (2006) Mannucci, F., Buttery, H., Maiolino, R., Marconi, A., & Pozzetti, L. 2006, ArXiv Astrophysics e-prints, arXiv:astro-ph/0607143
- Maraston (2005) Maraston, C. 2005, MNRAS, 362, 799
- Maraston et al. (2006) Maraston, C., Daddi, E., Renzini, A., Cimatti, A., Dickinson, M., Papovich, C., Pasquali, A., & Pirzkal, N. 2006, ArXiv Astrophysics e-prints, arXiv:astro-ph/0604530
- Mayya et al. (2004) Mayya, Y. D., Bressan, A., Rodríguez, M., Valdes, J. R., & Chavez, M. 2004, ApJ, 600, 188
- McCarthy et al. (2004) McCarthy, P. J., et al. 2004, ApJ, 614, L9
- McLure et al. (2006) Maiolino, R. et al. 2006, astro-ph/0603261
- McLure et al. (2006) McLure, R. J., et al. 2006, ArXiv Astrophysics e-prints, arXiv:astro-ph/0606116
- Mobasher et al. (2005) Mobasher, B., et al. 2005, ApJ, 635, 832
- Moustakas et al. (2004) Moustakas, L. A., et al. 2004, ApJ, 600, L131
- Nandra et al. (2002) Nandra, K., Mushotzky, R., Arnaud, K. et al. 2002, ApJ, 576, 625
- Omont et al. (1996) Omont, A., McMahon, R. G., Cox, P., Kreysa, E., Bergeron, J., Pajot, F., & Storrie-Lombardi, L. J. 1996, A&A, 315, 1
- Omont et al. (2003) Omont, A., Beelen, A., Bertoldi, F., Cox, P., Carilli, C. L., Priddey, R. S., McMahon, R. G., & Isaak, K. G. 2003, A&A, 398, 857
- Panagia et al. (2005) Panagia, N., Fall, S. M., Mobasher, B., Dickinson, M., Ferguson, H. C., Giavalisco, M., Stern, D., & Wiklind, T. 2005, ApJ, 633, L1
- Papovich et al. (2006) Papovich, C., et al. 2006, ApJ, 640, 92
- Peng et al. (2006) Peng, C. Y., Impey, C. D., Ho, L. C., Barton, E. J., & Rix, H.-W. 2006, ApJ, 640, 114
- Pérez-González et al. (2005) Pérez-González, P. G., et al. 2005, ApJ, 630, 82
- Poggianti & Wu (2000) Poggianti, B. M., & Wu, H. 2000, ApJ, 529, 157
- Poggianti et al. (2001) Poggianti, B. M., Bressan, A., & Franceschini, A. 2001, ApJ, 550, 195
- Polletta et al. (2006) Polletta, M. d. C., et al. 2006, ApJ, 642, 673
- (84) Richards et al. 2006, astro-ph/060155
- Robson et al. (2004) Robson, I., Priddey, R. S., Isaak, K. G., & McMahon, R. G. 2004, MNRAS, 351, L29
- Rodighiero et al. (2006) Rodighiero, G., et al. 2006, MNRAS, 371, 1891
- Saracco et al. (2005) Saracco, P., et al. 2005, MNRAS, 357, L40
- Somerville et al. (2001) Somerville, R. S., Primack, J. R., & Faber, S. M. 2001, MNRAS, 320, 504
- Somerville et al. (2004) Somerville, R. S., et al. 2004, ApJ, 600, L135
- Smail et al. (2002) Smail, I., Ivison, R. J., Blain, A. W., & Kneib, J.-P. 2002, MNRAS, 331, 495
- Smail et al. (2004) Smail, I., Chapman, S. C., Blain, A. W., & Ivison, R. J. 2004, ApJ, 616, 71
- Stanway et al. (2003) Stanway, E. R., Bunker, A. J., & McMahon, R. G. 2003, MNRAS, 342, 439
- Stark & Ellis (2006) Stark, D. P., & Ellis, R. S. 2006, New Astronomy Review, 50, 46
- Steidel et al. (1999) Steidel, C. C., Adelberger, K. L., Giavalisco, M., Dickinson, M., & Pettini, M. 1999, ApJ, 519, 1
- Steidel et al. (2003) Steidel, C. C., Adelberger, K. L., Shapley, A. E., Pettini, M., Dickinson, M., & Giavalisco, M. 2003, ApJ, 592, 728
- Stern et al. (2006) Stern, D., Chary, R.-R., Eisenhardt, P. R. M., & Moustakas, L. A. 2006, AJ, 132, 1405
- van Dokkum & Ellis (2003) van Dokkum, P. G., & Ellis, R. S. 2003, ApJ, 592, L53
- Yan et al. (2004) Yan, H., et al. 2004, ApJ, 616, 63
- Yan et al. (2006) Yan, H., et al. 2006, New Astronomy Review, 50, 127
- Walter et al. (2004) Walter, F., Carilli, C., Bertoldi, F., Menten, K., Cox, P., Lo, K. Y., Fan, X., & Strauss, M. A. 2004, ApJ, 615, L17
- Webb et al. (2006) Webb, T. M. A., et al. 2006, ApJ, 636, L17
- Zheng et al. (2004) Zheng, W., et al. 2004, ApJS, 155, 73
BIMODAL solutions ID -phot -phot AV AV Mass [] Mass [] []a sol I solII sol I solII sol I solII sol I solII sol I solII sol I 1 2.70-2.30 4.40-4.36 5.80-5.80 1.20-0.40 0.004-0.004 1.015-1.434 10.403-10.160 11.421-11.181 4.410-5.266 2.160-1.985 13.80 2 1.28-1.20 2.36-2.41 8.10-8.10 2.00-1.80 0.006-0.006 3.500-2.600 9.812- 9.400 11.106-10.995 1.832-2.033 1.441-1.492 12.95 3 1.00-1.39 4.87-3.40 7.50-7.80 0.00-0.00 0.004-0.002 1.015-1.700 9.871-10.253 11.275-10.982 2.961-2.886 5.485-9.025 12.67 4 3.98-4.20 6.88-6.96 1.50-0.90 0.80-0.00 1.015-1.434 0.509-0.509 11.205-11.027 11.468-10.055 15.213-3.255 12.373-2.721 – 5 3.24-3.33 6.41-4.66 4.70-4.70 0.20-0.00 0.006-0.004 0.509-1.434 10.782-10.456 11.611-11.369 4.356-4.905 1.285-2.834 14.04 7 1.29-1.21 2.35-2.35 8.30-8.00 2.40-1.60 1.434-0.006 3.500-2.600 10.096-9.114 10.822-10.658 1.145-1.003 1.201-1.089 10.75 10 2.75-2.00 7.08-4.76 5.80-5.80 0.00-0.00 0.004-0.006 0.719-1.434 10.252-9.646 11.391-11.048 1.700-2.476 0.992-3.027 13.64 12 4.00-4.10 7.50-6.99 1.40-0.40 3.40-3.40 1.015-1.015 0.002-0.002 11.278-10.902 11.289-11.137 0.286-0.382 1.458-2.112 14.03 13 3.00-3.01 4.37-3.68 4.50-4.90 0.60-0.00 0.004-0.002 1.015-1.700 10.159-10.435 10.925-10.761 4.296-4.513 2.674-2.631 – 14 3.02-2.79 4.13-4.07 5.50-5.50 0.60-0.10 0.002-0.001 1.015-1.434 10.501-10.697 11.088-10.872 1.437-1.401 0.262-0.371 14.16 15 2.65-2.70 4.52-4.03 1.90-4.00 0.30-0.00 2.000-0.006 1.015-1.434 10.970-9.794 11.141-10.898 2.702-1.959 2.380-3.990 13.38 16 2.69-2.63 7.36-8.50 2.00-3.00 1.90-2.90 0.509-0.017 0.509-0.002 10.792-10.021 11.001-11.155 4.609-3.895 3.980-5.454 11.61 17 3.20-3.00 4.75-4.00 4.20-4.70 0.00-3.90 0.004-0.002 1.015-0.002 10.252-10521 11.078-10.654 4.102-3.516 2.348-6.538 13.67 19 4.61-4.68 6.27-6.23 2.40-1.30 2.40-0.80 1.015-1.015 0.181-0.509 11.918-11.636 12.038-11.681 4.559-4.496 3.549-3.603 15.46 FAVOURED SINGLE solutions ID -phot AV Mass [] 6 7.79-7.90 1.40-0.20 0.181- 0.360 12.022-11.700 1.075-0.625 8 3.82-3.99 1.30-0.50 0.509- 0.719 10.982-10.620 7.269-7.756 9 2.42-2.52 4.10-4.10 2.300- 2.600 11.453-11.336 0.343-0.343 11 4.06-4.14 2.10-1.50 0.360- 0.360 11.292-11.001 2.388-2.582 18 4.84-3.98 0.00-0.00 1.015- 1.434 11.359-11.295 2.803-5.393 20 4.29-3.83 0.40-0.00 1.015- 1.434 11.190-11.021 2.355-2.725 aafootnotetext: The instrinsic infrared luminosity of each source, is estimated by scaling the known of the best template fit to the measured MIPS 24 m flux density after redshifting the template SED to its measured .