11email: pieter.deroo@ster.kuleuven.be 22institutetext: Astronomical Institute “Anton Pannekoek”, University of Amsterdam, Kruislaan 403, 1098 SJ Amsterdam, the Netherlands
The circumbinary disc around the J-type C-star IRAS 18006-3213††thanks: Based on observations collected at the European Southern Observatory, Chile. Program ID: 073.D-610(A).
Abstract
Context. In the generally accepted, but poorly documented model, silicate J-type C-stars are binary objects for which the silicate emission originates from a circumbinary or a circumcompanion disc.
Aims. We aim at testing this hypothesis by a thorough spectral and spatial observational study of one object: IRAS 18006-3213.
Methods. We obtained, analysed and modeled high spatial resolution interferometric VLTI/MIDI observations on multiple baselines ranging from 45 m to 100 m.
Results. All observations resolved the object and show the very compact nature of the N-band emission ( 30 mas). In addition, the highest spatial resolution data show a significant differential phase jump around 8.3 m. This demonstrates the asymmetric nature of the N-band emission. Moreover, the single telescope N-band spectrum shows the signature of highly processed silicate grains. These data are used to confirm the model on silicate J-type C-stars for IRAS 18006-3213. We show that the most favourable model of the dust geometry is a stable circumbinary disc around the system, seen under an intermediate inclination.
Conclusions. The data presented on the silicate J-type C-star IRAS 18006-3213 provide evidence that the oxygen rich dust is trapped in a circumbinary disc. The formation of this disc is probably linked to the binary nature of the central star.
Key Words.:
Techniques: interferometric – Stars: AGB and post-AGB – Stars: carbon – (Stars:) circumstellar matter – Stars: individual: IRAS 18006-32131 Introduction
The 12C content in the atmosphere of asymptotic giant branch (AGB) stars is believed to increase during the evolution along the spectral sequence M S C. This increase is the result of mixing of He-burning material (mainly 12C and s-process elements) by the convective envelope through the third dredge-up. This mixing process is thought to occur during the relaxation after a thermal pulse. The recurrent operation of this dredge-up leads to the creation of a carbon star, when carbon becomes more abundant in number than oxygen.
The spectral classification of carbon stars (Wallerstein & Knapp 1998, and references therein) revealed, however, that different spectral groups could be identified and only the C(N) stars are now believed to be AGB stars, which are in the process of active dredge-up evolution. Other spectral classes are much less understood.
The J-type carbon stars are genuine carbon stars (CO), but they show very low 12C/13C values, at or near the CNO cycle equilibrium value of about 4. Moreover, J-type carbon stars show no s-process overabundances and often large Li abundances (Abia & Isern 2000, and references therein). All these chemical characteristics are at variance with the AGB chemical models and it is fair to say that the class of J-type C-stars are chemically far from understood. They do, however, represent a significant fraction of all C-stars ( 10 %) as was shown from a recent survey of 1497 stars in Morgan et al. (2003).
Because of the stability of the CO molecule, O-rich stars create circumstellar envelopes with silicate dust emission, while C-rich stars show C-rich dust features. The detection by IRAS/LRS of O-rich dust around C-rich photospheres came therefore as a huge surprise (Little-Marenin 1986; Willems & de Jong 1986). Even more intriguing is the observation that all C-stars showing silicate dust are spectroscopically of J-type (Lloyd Evans 1991). No photospheric distinction can be made within the class of J-type C-stars, between the silicate emitters and the others (Ohnaka & Tsuji 1999). The J-type C-stars showing silicate dust emission are defined as “silicate J-type C-stars” and constitute about 10 % (Lloyd Evans 1991) of the J-type C-stars.
Despite 20 years of research, the evolutionary channel(s) leading to the formation of silicate J-type carbon stars remain(s) a mystery. Little-Marenin (1986) suggested that silicate J-type C-stars can be explained by assuming they are binaries consisting of a C-rich and O-rich giant. However, no direct detection of this companion has ever been made, neither spectroscopically (Lambert et al. 1990) nor with speckle interferometry (Engels & Leinert 1994). Willems & de Jong (1986) on the other hand suggest that these objects experienced a recent transition from O-rich to C-rich by means of a thermal pulse. The O-rich matter in this hypothesis is then the remnant of a previous mass-loss phase, when the giant was still O-rich. This was criticized from an evolutionary point of view. Lloyd Evans (1990) argues that such a transition object should only be observed during a few decades, while some of the silicate C-stars are known to have C-rich photospheres for over 50 years. Furthermore, it is shown in Yamamura et al. (2000) that the silicate feature of V778 Cyg did not change in the 14 years time interval between the IRAS/LRS and the ISO/SWS observation. Therefore, also this scenario seems unlikely.
The general consensus now about these objects is that they are binaries with an unseen companion, probably a main sequence star (Morris 1987; Lloyd Evans 1990; Yamamura et al. 2000). While the star was an O-rich giant, the mass loss was captured and stored in a disc, either around the companion or around the system. Subsequently, the primary experienced (a) thermal pulse(s) and evolved into a C-star. This scenario still does not account for the chemical J-type nature of the silicate C-star.
Evidence of this hypothesis has been gathered over the years: The long-lived reservoir has been inferred from very narrow rotational CO line profiles by Kahane et al. (1998) and Jura & Kahane (1999), indicative of Keplerian rather than outflow velocities. Radial velocity measurements of two silicate C-stars were consistent with the motion in a binary system. No conclusive orbit could be detected, however (Barnbaum et al. 1991). A recent observation of the water maser emission toward V778 Cyg at high angular resolution suggests the presence of a rotating disc (Szczerba et al. 2006). From the angular separation between this emission and a previous optical observation, the authors conclude that this (probably) provides support for the circumcompanion model for this object (Yamamura et al. 2000).
Despite the more general consensus of the binary nature of silicate J-type stars, conclusive direct evidence on their binarity is still lacking. It remains also unclear whether one formation channel does applies for all silicate J-type C-stars. An open question is also whether the scenario developed for the silicate J-type C-stars, could apply for all J-type stars. Whether a possible binary nature can have a direct impact on the internal chemical evolution of one of the components is yet another open question.
To investigate the silicate J-type star problems, we studied IRAS 18006-3213 at high angular resolution using the MIDI instrument. IRAS 18006-3213 (CGCS 3935, Fuen C 270, FJF 270) was identified as a C-star more than 25 years ago by Fuenmayor (1981). Soon after, it was realised by Willems & de Jong (1986) that this object belongs to the peculiar class of C-rich objects showing an O-rich circumstellar environment. The J-type nature of the C-rich giant was confirmed by Lloyd Evans (1990). IRAS 18006-3213 is therefore a perfect candidate to provide answers to the questions posed above. The distance to this object is uncertain and was quantified to be 2.6 kpc by Engels (1994) based on the matching between the measured energy emitted in the infrared, and the assumption that the luminosity is 5000 L⊙, which is typical for thermally pulsing AGB stars.
2 Observations and Reduction
2.1 observations
Five interferometric observations of IRAS 18006-3213 were performed using the MIDI instrument at different physical baselines with projected baselines (PB) ranging from 40 m to 102 m. One of the observations (with a PB of 40 m) shows bad overlap between both beams and is therefore discarded. A log of the successful observations is presented in Table 1. Each observation was performed using a prism (with spectral resolution ) producing spectrally dispersed fringes over the N-band (). The standard observing sequence was used, for which we refer to Leinert et al. (2004). To correct for instrumental and atmospheric loss of coherence, a calibrator of known diameter is measured using the same setup. The visibility calibrators of the different science observations are given in Table 1 as well.
| night | telescope | time | PB | PA | visibility |
|---|---|---|---|---|---|
| yyyy/mm/dd | combination | hh:mm | (m) | (°) | calibrator |
| 2004-04-08 | UT2 - UT3 | 08:17 | 46.5 | 30 | HD 165135 |
| 2004-06-27 | UT1 - UT3 | 03:15 | 102.4 | 25 | HD 134505 |
| 2004-06-27 | UT1 - UT3 | 06:06 | 96.0 | 43 | HD 139127 |
| 2004-06-28 | UT1 - UT3 | 08:48 | 70.8 | 49 | HD 165135 |
2.2 spectroscopic reduction
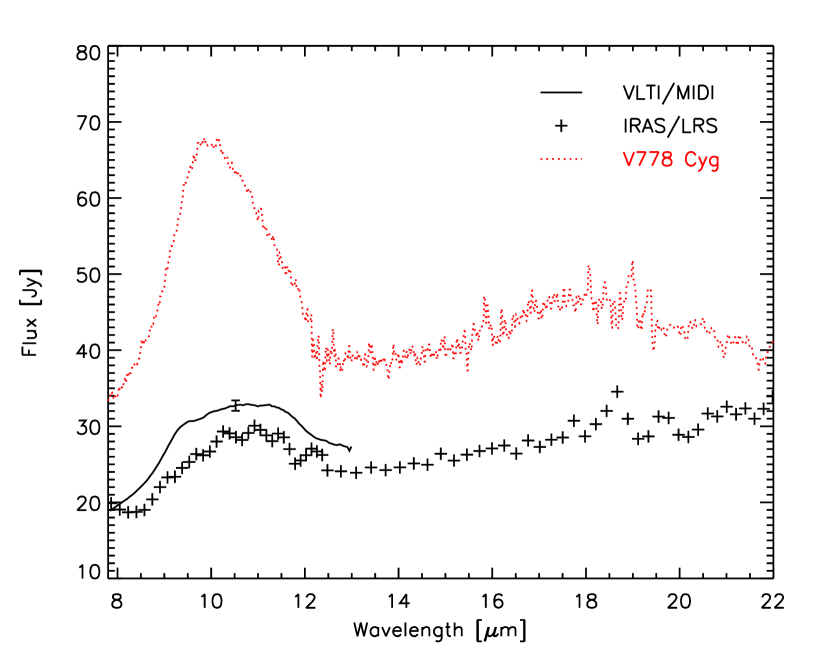
A traditional single telescope spectrum is obtained, together with each interferometric observation. We corrected for atmospheric transmission and obtained flux calibration using the photometric observations of the calibrator stars. Theoretical N-band spectra of the calibrator stars were synthesized using the marcs code (Gustafsson et al. 1975, and further updates), including the SiO opacity. Temperature, gravity and angular diameter of the calibrators were derived from SED fitting by Verhoelst (2005) (cf. http://www.ster.kuleuven.ac.be/tijl/MIDI_calibration/mcc.txt). The spectrum of IRAS 18006-3213 obtained for 2004-04-08 is shown in Fig. 1. Overplotted in this figure is the IRAS low resolution spectrum scaled on the basis of the IRAS 12 m photometry flux. Also shown in this figure is the ISO/SWS spectrum of V778 Cyg.
2.3 interferometric reduction
To reduce the interferometric data, two different methods were employed. The first method is based on power spectrum analysis and was executed with the MIA package (MIDI interactive analysis, version 1.3) implemented at the Max-Planck Institut für Astronomy in Heidelberg. The second method reduces all frames to the same optical path difference (OPD) and was performed using the EWS package (Expert Work Station) developed by Walter Jaffe. For the details of both reduction packages, we refer to Leinert et al. (2004) and Jaffe (2004) respectively.
In Fig. 2 we show the visibilities obtained with the EWS method. The error bars consists both of systematic errors and noise type errors. Because the systematic contribution to the errors is dominant, the actual point-to-point error on the visibility is much smaller than indicated in Fig. 2, i.e. the relative visibility between e.g. 8 and 9 m is much better determined than the numerical value at either wavelength. The visibilities obtained with the MIA reduction scheme give very similar results. In the following, we will work with the EWS reduced data because this method has the advantage that the relative phase between the different spectral channels is preserved in the reduction. All first order information on the phase delay is lost because it is necessary to compensate for OPD fluctuations and first-order dispersion effects before co-adding the data (Jaffe 2004). Second order effects remain in the data and they can be determined very accurately. An accuracy of 1 degree RMS phase error can be achieved during stable environmental conditions (Tubbs et al. 2004). In Fig. 4, we show the instrumental phase of the different observing nights as measured for all calibrator objects observed during the night. The instrumental phase is clearly very stable with an accuracy for all nights of about 5 degree RMS phase error. The curvature in the instrumental phase is a result of the varying values of the index of refraction of air in the VLTI tunnels. The instrumental phase is subtracted from the science target observations, largely removing this curvature. As a conservative error on the relative phase, we took the RMS phase degree error on all calibrator observations during the night. The resulting phase information on IRAS 18006-3213 for the different observations is shown in Fig. 3.


3 Analysis
3.1 spectral energy distribution
To construct the spectral energy distribution (SED) of IRAS 18006-3213, we used optical photometry from the literature (Lloyd Evans 1990, 1991) and infrared data from 2 MASS, MSX and IRAS. The data are shown in Fig. 5 using crosses. The SED shows a clear IR-excess representing an amount of energy almost equal to that emitted in the optical.
We note that the DENIS database lists a K magnitude of almost 0.7 0.1 mag lower than the one reported in the 2 MASS database whilst having compatible J magnitudes. This could indicate that the (dust) excess emission in the infrared is variable. This is, however, incompatible with both the spectral and photometric stability of the mid-IR emission (see sect. 3.2). In what follows we did not take into account the DENIS K band magnitude.
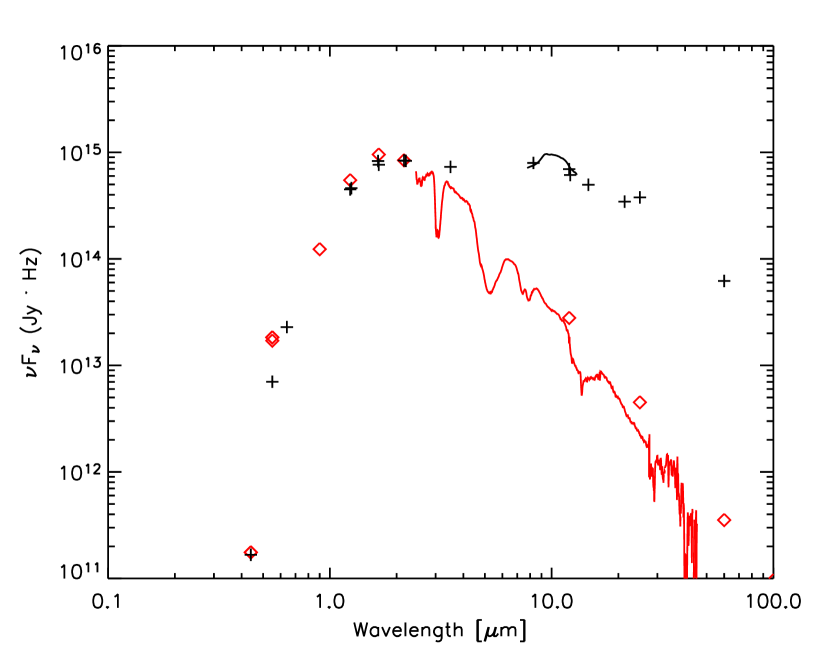
In Fig. 5, the SED of IRAS 18006-3213 is compared to the SED of T Lyr, a J-type C-star of similar spectral type but without silicate emission. Both objects are among the reddest members of the class (Lloyd Evans 1990; Lorenz-Martins 1996). The spectral types indicate low effective temperatures in the range of T K. While both objects show comparable optical colours, in the IR the SED is completely different. IRAS18006-3213 shows a large IR excess dominated by thermal emission of dust, while the IR spectrum of T Lyr is dominated by molecular features and has a very different spectral slope. The total mass-loss of T Lyr is quantified by Bergeat & Chevallier (2005) to be and there is no strong evidence for efficient dust production in the wind.
Since both T Lyr and IRAS 18006-3213 have very similar spectral type, and have very similar colours in the optical, we can assume that also the photosphere of IRAS 18006-3213 does not experience a large dust-driven spherical C-rich outflow and that the IR spectrum of the underlying carbon star is very similar to the template T Lyr. In general, J-type objects show very moderate outflows (Lorenz-Martins 1996).
We conclude that the spectral energy distribution of IRAS 18006-3213 consists of a photospheric contribution and a large infrared excess, likely completely dominated by oxygen rich dust alone.
3.2 mineralogy
In Fig. 1, the MIDI spectrum of IRAS 18006-3213 is shown together with its IRAS/LRS spectrum. Both show good agreement, which indicates that the silicate emission must have been stable for over 20 years. This is consistent with the stable emission found for the two other silicate J-type C-stars of which the IR excess was observed at different epochs (V778 Cyg and Hen 38, Yamamura et al. 2000; Ohnaka et al. 2006, respectively).
The band profile on the N-band silicate feature is a good tracer for the mineralogy of the dust emission. Comparing the spectrum of IRAS 18006-3213 with that of V778 Cyg (also shown in Fig. 1), another silicate J-type C-star, it is striking that the silicate emission profiles are very different. The profile of IRAS 18006-3213 has the signature of highly processed silicates (i.e. crystalline and/or large grains) while V778 Cyg shows evidence for an unprocessed silicate environment (i.e. amorphous small grains).
In order to quantify the difference in mineralogy and sizes of the emitting dust particles around both objects, we compute a fit through the N-band spectra using calculated emissivities of irregularly shaped, chemically homogeneous dust grains. We ignored the contribution provided by their photospheres because this contribution and the effect on the slope of the N-band spectrum is marginal. The most important dust species causing spectral signature in the 10 m window are amorphous (i.e. glass with olivine stoichiometry) and crystalline olivine, amorphous (i.e. glass with pyroxene stoichiometry) and crystalline pyroxene and amorphous silica. In the fitting, we added also a continuum distribution which accounts for the emission by large grains and/or for the possible presence of featureless components such as metallic iron, iron sulphide or carbon grains. This continuum contribution is modeled using a constant mass absorption coefficient. For a reference to the method which is used and the assumptions made, we refer to Min et al. (2005) and Van Boekel et al. (2005).
In the 10 m region we are mainly sensitive to the dust grains smaller than a few m. We represented the size distribution of the particles by two grain sizes, 0.1 m and 1.5 m. This size is the radius of the solid sphere with an equivalent volume as the hollow sphere (Min et al. 2005). Particles larger than a few m contribute mainly to the continuum. In addition, we assumed that the thermal radiation we analyze originates from optically thin regions so that we can simply add the different contributors to the spectral emission feature.
In the fitting process of the N-band spectrum, we assume all contributing dust grains, including the ones responsible for the continuum, to have the same temperature distribution. Due to the limited wavelength range, this temperature distribution can be represented by a single Planck curve with one characteristic temperature, . This is justified because it is likely that the dust grains of different species are coagulated, implying thermal contact between the various components. The characteristic temperatures used in the modeling are given in Table 2. Note that this temperature can not be regarded as the temperature of the whole dust excess but is only an approximation of the temperature of those particles responsible for the N-band emission.
The abundances of the dust components are determined by using a linear least square fitting procedure with constraints on the weights to avoid negative values. The temperature of the grains and the underlying continuum is varied from 0 to 1500 K until a best fit is obtained. The errors on the resulting fit parameters are determined through a Monte Carlo simulation on the spectrum. This method ensures that degeneracies between the fit parameters show up as large errors in those parameters.
The dust parameters and its respective errors for IRAS 18006-3213 and V778 Cyg are given in Table 2. The resulting best fit spectrum is shown as a grey line in Fig. 6.
| unit | value | value | |
| IRAS 18006 | V778 Cyg | ||
| K | 400 100 | 500 100 | |
| small olivine | % | 0.1 0.1 | 61.9 3.9 |
| big olivine | % | 57.4 1.8 | 20.6 6.4 |
| small pyroxene | % | 0 0 | 0 0 |
| big pyroxene | % | 0 0 | 0.1 0.1 |
| small forsterite | % | 3.1 0.3 | 1.9 0.3 |
| big forsterite | % | 15.5 0.9 | 9.3 1.2 |
| small forsterite | % | 0 0 | 0 0 |
| big enstatite | % | 15.7 1.1 | 6.3 1.4 |
| small silica | % | 0 0 | 0 0 |
| big silica | % | 8.1 0.3 | 0 0 |
| summary | |||
| big components | % | 96.8 0.5 | 36.2 4.4 |
| crystalline components | % | 34 2 | 17.4 2.4 |
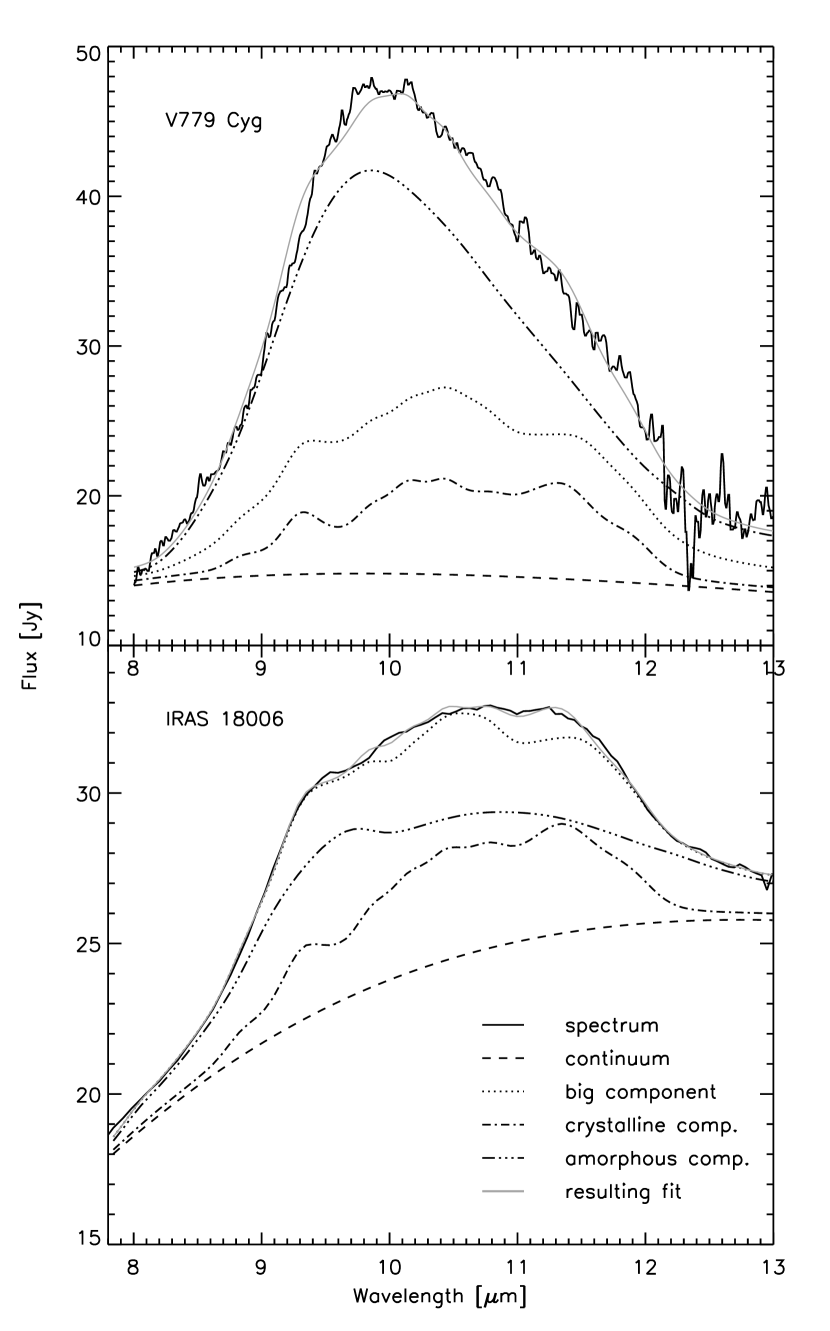
The circumstellar silicates around both objects are clearly very different. The warm silicates of IRAS 18006-3213 are much more processed than those of V778 Cyg. While the fraction of large grains is almost 100 % (their contribution to the spectrum is shown using a dotted line in Fig. 6), they represent only one third of the mass for V778 Cyg. Moreover, also the crystallinity fraction for IRAS 18006-3213 is twice as large as the one determined for V778 Cyg.
The presence of the high processing observed for IRAS 18006-3213, both with respect to grain size and crystallinity degree, is indicative of dust stored in a stable disc (e.g. Molster et al. 2000; Van Boekel et al. 2005). In O-rich outflows observed around mass-losing objects, the dust is mostly in the form of amorphous silicates (e.g. Sloan & Price 1995; Waters et al. 1996; Cami 2002). The spectrum of V778 Cyg is compatible with the emission typically observed in such outflows. We can conclude that the degree of processing of the circumstellar environment of silicate J-type C-stars is clearly not uniform.
3.3 N-band visibilities
In this section we discuss the global characteristics of the N-band emission as constrained by the visibilities shown in Fig. 2. The object is clearly resolved at all baselines. In addition, a strong wavelength dependence is observed in the visibility observations.
To quantify the global characteristics of the N-band emission, we modeled the visibility measurements assuming using a simple geometry, i.e. a uniform disc intensity distribution. We limit this part of the analysis to the two visibility curves at the lowest spatial frequency, because only these probe the large scale structure. The highest spatial frequency data yield very low visibilities and their interpretation is therefore very sensitive to the exact unresolved photospheric contribution. The possible presence of small scale structures in the dust excess like clumps, warped structure of the disc, etc.. are very poorly constrained with the limited number of visibilities observed. The long baseline measurements are, however, used for their phase information, see sect. 3.4.

The resulting angular diameter of the N-band emission is shown in Fig. 7. The dust emission is clearly compact (25 mas at 8 m to 35 mas at 13 m) and it shows a clear wavelength dependence. Globally, the size increases as wavelength increases. This is likely the result of a temperature distribution, with the colder dust located in a larger structure than the hotter dust. In addition, a clear dip in angular size is observed starting around 9 m. Since the error bars in Fig. 7 represent mostly a scaling uncertainty in the fluxes, the relative difference observed between e.g. 8.5 m and 9.5 m is significant. This dip in the derived angular size is the result of the shape of the visibility curve, which increases rather steeply around 9 m and flattens out till 11.5 m after which the visibility decreases (see top panel in Fig. 2). Note that a Gaussian intensity profile provides the same qualitative results.
Given the amount of emission and the size of the emission region at 8 m, which originates from continuum emitting particles (see Fig. 6), it is clear that the continuum emission must come from an optically thick region, i.e. : If the emission were to come from an optically thin region, the derived temperature would be inconsistent with the SED. For example, if , then a temperature K is necessary to reproduce the flux at 8 m.
IRAS 18006-3213 was identified as a C-star by Fuenmayor (1981). Therefore, any O-rich dust present in the circumstellar environment must have been ejected by the AGB giant at least 25 years ago. Assuming a typical outflow velocity of 10 km s-1 and a distance for IRAS 18006-3213 of 2.6 kpc (Engels 1994), the O-rich dust would need 15 years to arrive at the derived radius of the dust emission. This shows that the current size of the disc is in contradiction with an outflow scenario, since the actual central carbon star will not produce silicate dust.
The fact that the “feature” in the visibility profile has the same shape as the silicate emission profile (see Fig. 1) leads us to believe that the dip in the angular size comes from a silicate emission feature originating from a smaller radius than the underlying continuum emission. Ohnaka et al. (2006) observes a similar trend for the silicate carbon star IRAS 08002-3803 and they show from a careful modeling that a two-species model can reproduce the observations. In their model, the silicate component has a steeper temperature gradient than the other component due to the different opacities of both particles. Therefore, the emission from the silicate component originates from a smaller angular size. However, this is not the only possible interpretation. An alternative explanation for the observed “feature” in the visibility curve is that different grain types do have a different spatial density distributions. This was shown already in some discs around Herbig Ae stars (van Boekel et al. 2004) and for the disc around the binary post-AGB object HD 52961 (Deroo et al. 2006).
In summary, the N-band interferometric observations clearly resolved the circumstellar environment of IRAS 18006-3213 and revealed the compact nature of the emission region. The size of the emission provides strong indication that the N-band emission must come from a compact stable geometry in the system. Moreover, the observations show that the particles responsible for the silicate emission feature must be emitting from a smaller region than the particles responsible for the continuum emission.
3.4 N-band phases
The calibrated phases (Fig. 3) show a large phase-jump around 8.3 m for the two observations at the longest baseline. This phase jump does not equal 180 deg and/or it is not accompanied with a visibility transition through zero111Note that, due to the finite bandpass of MIDI, measuring a visibility which equals zero is impossible. In reality, a monochromatic zero visibility would correspond in our polychromatic measurement with V, which is clearly not observed in the measurements.. Moreover, the smooth shape of the phase curvature indicates that it is a slowly evolving feature. This phase information shows that the source is not centrally symmetric with an identical photocenter throughout the N-band.
The photospheric contribution at 10 m of the total received flux is 5 1 % (assuming a blackbody with the expected Teff, see sect. 3.1). At the longest baselines, the dust emission is strongly resolved. The unresolved photosphere therefore becomes a significant contributor to the correlated flux of the system. The asymmetry in the system is therefore most likely explained assuming an offset between the photocenter of the dust excess and the giant photosphere.
A photocenter offset between both components (the unresolved photosphere and the resolved circumstellar dust emission) results in the observed phase through the combination of the following effects:
-
•
The components, with different positions on the sky, have different spectral energy distributions. Therefore, the flux of both sources will contribute different fractions of the total received flux at different wavelengths, producing a phase difference between the spectral channels.
-
•
The components have different positions on the sky and this displacement is more resolved at 8 m than at 13 m, leading to a modulation of the phase signal with the spatial resolution.
The probability that the phase-jump is explained solely by the second effect is very small, since the same phase-jump is observed at different instrumental setups (see Fig. 3). Indeed, finding the same shape in phase with different projected baseline lengths and angles can only be understood if we assume a very specific source geometry: the projected angle and projected asymmetry of the source on the sky must be such that they cancel in the different observed setups. The probability of this geometry is clearly extremely low.
To see how the shape of the phase over the N-band can be reproduced by different spectral signatures of both components (in combination with the changing spatial resolution over the wavelength band), we quantified a simple illustrative model.
The most important non-linear feature in the phase is centered around 8.3 m (see Fig. 3). For the observations at the longest baselines, a strong positive slope is observed before 8.3 m. Between 8.3 m and 9.3 m the phase strongly declines. In our model, an absorption/emission feature in the giant photosphere and/or the dust spectrum could cause these slopes. The most straightforward identification is the silicate feature in the dust emission itself. This feature changes the flux ratio drastically between 8.3 m and 9.3 m (see Fig. 6). While the emission from the dust excess increases by almost 50 % over this spectral region, the emission of the giant photosphere decreases by 20 % in the assumption of a Rayleigh-Jeans law. Clearly, the global photocenter will shift rapidly toward the photocenter of the dust emission moving from 8.3 m to 9.3 m. In the spectral region before 8.3 m, the presence of a strong absorption/emission feature in the dust spectrum is excluded. The unresolved photosphere is the only component for which a large change in flux contribution over that specific spectral region would go unnoticed in the global N-band spectrum. The most likely source is the presence of a molecular photospheric absorption band due to C2H2 and HCN located around 7.5 m. This feature appears to be omnipresent in C-stars as is demonstrated by ISO (Aoki et al. 1999; Jørgensen et al. 2000; Yang et al. 2004; Gautschy-Loidl et al. 2004) and Spitzer (Matsuura et al. 2006; Sloan et al. 2006; Zijlstra et al. 2006). As a template of what this molecular band for IRAS 18006-3213 could look like, we took the ISO/SWS spectrum of T Lyr, a J-type C-star of similar spectral type but without silicate dust. Its photospheric molecular band at 7.5 m is likely somewhat polluted by its moderate mass loss, but the band shape is expected to remain the same. Moreover, the double-peaked shape of the band of T Lyr (see Fig. 5) is representative for the typical band shape due to C2H2 and HCN: see e.g. the left panel of Fig. 11 in Lagadec et al. (2006), where the averaged spectra around the 7.5 m band of 14 SMC C-stars is shown.

In Fig. 8 we show the correlated flux ratio between both components assuming an unresolved photosphere and a constant visibility over the wavelength band for the dust excess. In order to compare directly the wavelength dependence of this ratio with the observed phase (see Fig. 3), we removed its first order behaviour over the wavelength band in Fig. 8. The observed phase shape over the N-band is reproduced well with the phase jump located at the observed wavelength position. The strength of the phase jump around 8.3 m is enhanced if we assume the infrared dust excess to have a lower visibility. The shape of the phase jump observed at the longest baselines is therefore explained very well by: A shift of the global photocenter toward the giant photosphere in the region between 7.8 m and 8.3 m, followed by a shift toward the photocenter of the dust excess between 8.3 m and 9.3 m.
The low visibilities at the longest baselines are determined by a complex addition of an unresolved photosphere and a circumstellar dust component with a different phase. This dust component has an unconstrained (inner) geometry. To provide nevertheless a quantified estimate of the offset between both components, we assumed in our model the following: (i) The emission of the C-giant can be represented by the photospheric emission of T Lyr. (ii) We assume that the wavelength dependence of the diameter of the dust excess obtained at the shorter baselines (see Fig. 7) is also applicable at the longest baselines.
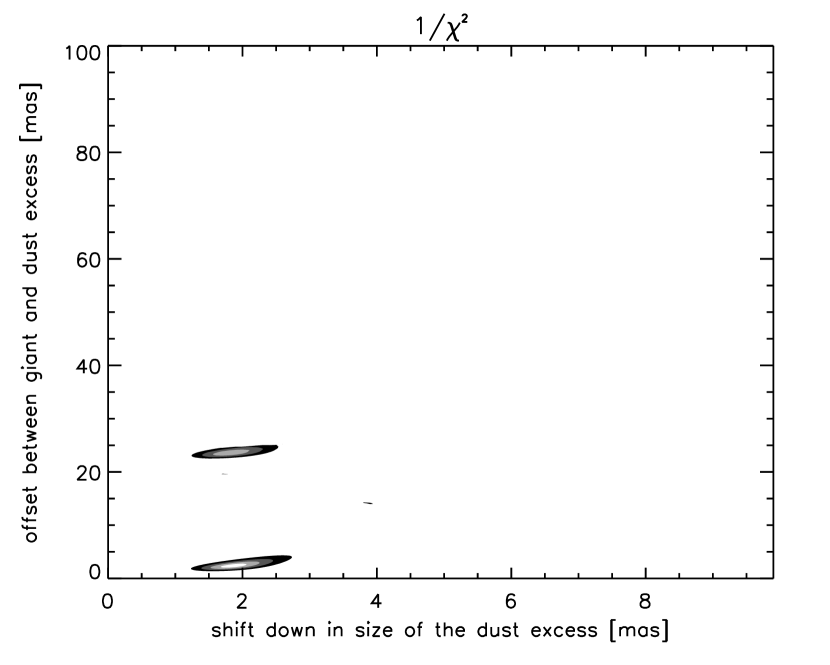
Given the previous considerations and assumptions, we modeled the visibility and phase observed at the 96.0 m baseline using two free parameters. The first parameter is a shift down in the size of the dust excess as determined from the measurements at the shortest baselines (see Fig. 7), to simulate geometrical effects at high spatial resolution. The second parameter is the offset between the giant photosphere and the photocenter of the dust excess. In Fig. 9, the inverse distribution is shown. Two solutions are found: The optimum solution provides a separation between both components of only 2.4 mas (), while the other provides a much larger separation of 23.5 mas (). The resulting fit to the visibility and phase for the optimum solution is shown in Fig. 10. Both observables are reproduced very well considering the simplicity of the model. Modeling the measurement at the 102.4 m baseline provides similar results with best fit separations between both components of 4.7 mas and 14.9 mas. We remark that under the assumptions we made, the visibilities confirm the non-zero phase which is measured. To model the shape and the absolute value of the visibility amplitude, a complex (i.e. non-real) addition of the visibilities is necessary.

4 Discussion
4.1 location of the dust
Silicate C-stars are identified as objects displaying a C-rich photosphere with an O-rich circumstellar environment. Within all the known silicate C-stars, large differences in silicate mineralogy are observed. This was demonstrated in sect. 3.2 and apparent from the wide variety in 10 m silicate profiles (see e.g. Fig. 4 in Lloyd Evans 1990) for silicate J-type C-stars. While some objects show a mineralogy which resembles the mineralogy observed in O-rich AGB outflows (e.g. V778 Cyg and BM Gem), other show signatures of highly processed grains (e.g. IRAS 08577-6035 and EU And). The object which is at the focus of this study, IRAS 18006-3213, clearly belongs to the latter class and shows a crystallinity degree of 35 % and a fraction of large micron sized particles of almost 100 %.
In Yamamura et al. (2000), it is shown that the geometry which best reproduces the ISO/SWS observation of V778 Cyg, consists of an O-rich reservoir located around the companion star. Because O-rich AGB stars typically show amorphous outflows, the material captured by the component is likely dominated by amorphous grains. Once in the disc, part of the material in the inner region close to the low luminosity companion, may be heated above the glass temperature at which point it will become crystalline. The processed grains will likely not provide a strong signature in the integrated spectrum and the spectrum will be dominated by the evaporation of the amorphous outer layers of this circum-companion disc. This evaporation is triggered by the strong radiation pressure of the primary AGB giant.
In this scenario it is, however, difficult to account for the high processing degree observed for the circumstellar environment of IRAS 18006-3213. The alternative geometry is when the circumstellar material is captured in a circumbinary disc. In this geometry, the inner material facing the central binary, is heated above the glass temperature and can become crystalline. Because of the high-luminosity AGB giant, this region is significantly larger. The impact of this material on the spectrum is therefore expected to be significant, thus providing an overall processed feature.
The visibility measurements of IRAS 18006-3213 also favour a geometry where the dust is stored in a circumbinary disc. If the silicate emission were to come from evaporation of the amorphous outer layers of the disc, this emission would be larger than the underlying continuum. Instead, the opposite is observed for IRAS 18006-3213.
4.2 asymmetry in the system
As shown in Sect. 3.4, asymmetry is present in the source geometry. This asymmetry is interpreted as originating from a photocenter offset between the contribution of the unresolved C-rich AGB photosphere and the resolved thermal emission of circumstellar dust. An offset between both components can be a natural result of either:
-
•
the motion of the AGB giant in its (suspected) binary orbit
-
•
the presence of a circumbinary disc seen under a non pole-on inclination
-
•
the presence of a disc around the companion
While these scenarios provide different physical offsets between the giant and the dust excess, the expected asymmetries are compatible with the solutions found in sect. 3.4. The MIDI spectrum and the visibility amplitudes however point to the occurrence of a circumbinary disc rather than a circumcompanion disc. We therefore evaluate one of the first two options more likely.
We conclude that – although the interferometric phase information is not conclusive – an inclined circumbinary disc is the most probable source of asymmetry in the system, possibly in combination with the binary motion of the AGB giant.
4.3 comparison with binary post-AGB objects
IRAS 18006-3213 shows remarkable similarities to the binary post-AGB objects which are known to be surrounded by a circumbinary disc, since the detected orbits are all within the dust sublimation radius (for a recent review we refer to Van Winckel 2003). These objects have similar high luminosities and it is shown that high processing degrees are observed for a very high fraction of objects (over 60 % of the N-band spectra show a crystallinity fraction larger than 40 %, De Ruyter 2005). Also the visibility measurements of IRAS 18006-3213 provide a very similar size and spectral behaviour as observed for the only binary post-AGB object resolved with MIDI (i.e. HD 52961, Deroo et al. 2006). This is shown in Fig. 11, where the absolute angular diameter is given for both objects. The similarity between both curves indicates that similar physical processes are active in both objects, providing again evidence for the circumbinary nature of the disc around IRAS 18006-3213. We do not expect to see a similar phase jump for HD 52961 as for IRAS 18006-3213 because the post-AGB photosphere of HD 52961 is much hotter (and O-rich), making the photospheric spectrum devoid of strong molecular lines.

5 Conclusions
The spectroscopic and interferometric data presented on IRAS 18006-3213 provide clear and direct evidence that the oxygen rich reservoir is located in a compact region close to the star:
-
•
The stability of the N-band spectrum and the observation that the circumstellar environment consists of highly processed silicate grains both indicate the existence of a long-lived reservoir in the system where the processing occurred.
-
•
The interferometric observations show the very compact nature of the N-band emission, again providing strong evidence that this emission originates from a long-lived Keplerian disc.
-
•
The interferometric observations show an asymmetric N-band emission. This provides direct evidence of the non-spherical nature of the emission.
Using the spectroscopic and interferometric data, we show that the most favourable geometry supported by the data is a long-lived disc-like reservoir around the system which is seen under an inclination. The formation of this disc is likely linked to the strongly suspected binary nature of this object. We argued that the bimodal appearance of the silicate N-band profile in silicate J-type stars (processed versus non-processed grains), could be the result of a different location of the dust in the systems which is either circumcompanion (e.g. in V778 Cyg) or circumbinary (e.g. in IRAS1̇8006-3213). The testing of this will require direct detection of the orbits, which will need extensive radial velocity monitoring campaigns and/or interferometric measurements providing (closure) phase information.
Acknowledgements.
The authors would like to thank the staff of the Paranal observatory for observing the MIDI data. P. D., H. V. W., T. V. and M. R. acknowledge financial support from the Fund for Scientific Research of Flanders (FWO).References
- Abia & Isern (2000) Abia, C. & Isern, J. 2000, ApJ, 536, 438
- Aoki et al. (1999) Aoki, W., Tsuji, T., & Ohnaka, K. 1999, A&A, 350, 945
- Barnbaum et al. (1991) Barnbaum, C., Kastner, J. H., Morris, M., & Likkel, L. 1991, A&A, 251, 79
- Bergeat & Chevallier (2005) Bergeat, J. & Chevallier, L. 2005, A&A, 429, 235
- Cami (2002) Cami, J. 2002, Ph.D. Thesis, Univ. Amsterdam
- De Ruyter (2005) De Ruyter, S. 2005, Ph.D. Thesis, K.U.Leuven
- Deroo et al. (2006) Deroo, P., van Winckel, H., Min, M., et al. 2006, A&A, 450, 181
- Engels (1994) Engels, D. 1994, A&A, 285, 497
- Engels & Leinert (1994) Engels, D. & Leinert, C. 1994, A&A, 282, 858
- Fuenmayor (1981) Fuenmayor, F. J. 1981, Revista Mexicana de Astronomia y Astrofisica, vol. 6, 6, 83
- Gautschy-Loidl et al. (2004) Gautschy-Loidl, R., Höfner, S., Jørgensen, U. G., & Hron, J. 2004, A&A, 422, 289
- Gustafsson et al. (1975) Gustafsson, B., Bell, R. A., Eriksson, K., & Nordlund, A. 1975, A&A, 42, 407
- Jaffe (2004) Jaffe, W. 2004, in New Frontiers in Stellar Interferometry, Vol. 5491
- Jørgensen et al. (2000) Jørgensen, U. G., Hron, J., & Loidl, R. 2000, A&A, 356, 253
- Jura & Kahane (1999) Jura, M. & Kahane, C. 1999, ApJ, 521, 302
- Kahane et al. (1998) Kahane, C., Barnbaum, C., Uchida, K., Balm, S. P., & Jura, M. 1998, ApJ, 500, 466
- Lagadec et al. (2006) Lagadec, E., Zijlstra, A. A., Sloan, G. C., et al. 2006, ArXiv Astrophysics e-prints
- Lambert et al. (1990) Lambert, D. L., Smith, V. V., & Hinkle, K. H. 1990, AJ, 99, 1612
- Leinert et al. (2004) Leinert, C., van Boekel, R., Waters, L. B. F. M., et al. 2004, A&A, 423, 537
- Little-Marenin (1986) Little-Marenin, I. R. 1986, ApJ, 307, L15
- Lloyd Evans (1990) Lloyd Evans, T. 1990, MNRAS, 243, 336
- Lloyd Evans (1991) Lloyd Evans, T. 1991, MNRAS, 249, 409
- Lorenz-Martins (1996) Lorenz-Martins, S. 1996, A&A, 314, 209
- Matsuura et al. (2006) Matsuura, M., Wood, P. R., Sloan, G. C., et al. 2006, MNRAS, 371, 415
- Min et al. (2005) Min, M., Hovenier, J. W., & de Koter, A. 2005, A&A, 432, 909
- Molster et al. (2000) Molster, F. J., Waters, L. B. F. M., & Tielens, A. G. G. M. 2000, Bulletin of the American Astronomical Society, 33, 712
- Morgan et al. (2003) Morgan, D. H., Cannon, R. D., Hatzidimitriou, D., & Croke, B. F. W. 2003, MNRAS, 341, 534
- Morris (1987) Morris, M. 1987, PASP, 99, 1115
- Ohnaka et al. (2006) Ohnaka, K., Driebe, T., Hofmann, K.-H., et al. 2006, A&A, 445, 1015
- Ohnaka & Tsuji (1999) Ohnaka, K. & Tsuji, T. 1999, A&A, 345, 233
- Sloan et al. (2006) Sloan, G. C., Kraemer, K. E., Matsuura, M., et al. 2006, ApJ, 645, 1118
- Sloan & Price (1995) Sloan, G. C. & Price, S. D. 1995, ApJ, 451, 758
- Szczerba et al. (2006) Szczerba, R., Szymczak, M., Babkovskaia, N., et al. 2006, A&A, accepted
- Tubbs et al. (2004) Tubbs, R. N., Meisner, J. A., Bakker, E. J., & Albrecht, S. 2004, in New Frontiers in Stellar Interferometry, Proceedings of SPIE Volume 5491. Edited by Wesley A. Traub. Bellingham, WA: The International Society for Optical Engineering, 2004., p.588
- van Boekel et al. (2004) van Boekel, R., Min, M., Leinert, C., et al. 2004, Nature, 432, 479
- Van Boekel et al. (2005) Van Boekel, R., Min, M., Waters, L. B. F. M., et al. 2005, A&A, 437, 189
- Van Winckel (2003) Van Winckel, H. 2003, ARA&A, 41, 391
- Verhoelst (2005) Verhoelst, T. 2005, Ph.D. Thesis
- Wallerstein & Knapp (1998) Wallerstein, G. & Knapp, G. R. 1998, ARA&A, 36, 369
- Waters et al. (1996) Waters, L. B. F. M., Molster, F. J., de Jong, T., et al. 1996, A&A, 315, L361
- Willems & de Jong (1986) Willems, F. J. & de Jong, T. 1986, ApJ, 309, L39
- Yamamura et al. (2000) Yamamura, I., Dominik, C., de Jong, T., Waters, L. B. F. M., & Molster, F. J. 2000, A&A, 363, 629
- Yang et al. (2004) Yang, X., Chen, P., & He, J. 2004, A&A, 414, 1049
- Zijlstra et al. (2006) Zijlstra, A. A., Matsuura, M., Wood, P. R., et al. 2006, MNRAS, 370, 1961