Born-Again Protoplanetary Disk Around Mira B
Abstract
The Mira AB system is a nearby (107 pc) example of a wind accreting binary star system. In this class of system, the wind from a mass-losing red giant star (Mira A) is accreted onto a companion (Mira B), as indicated by an accretion shock signature in spectra at ultraviolet and X-ray wavelengths. Using novel imaging techniques, we report the detection of emission at mid-infrared wavelengths between 9.7 and 18.3 m from the vicinity of Mira B but with a peak at a radial position about 10 AU closer to the primary Mira A. We interpret the mid-infrared emission as the edge of an optically-thick accretion disk heated by Mira A. The discovery of this new class of accretion disk fed by M-giant mass loss implies a potential population of young planetary systems in white-dwarf binaries which has been little explored, despite being relatively common in the solar neighborhood.
1 Introduction
Mira (o Ceti) is the prototype of the class of Mira-type variable stars, characterized observationally by large visual photometric pulsation amplitudes and regular periods between 100 and 1000 days. Mira-type variables represent one of the late stages of evolution for 1-2 solar mass stars, with luminosities of several thousand times solar and mass loss rates of order solar masses per year. The winds from Mira-type variables are relatively slow (typically 10 km s-1), which means that the mass lost in these winds can be readily accreted onto any stellar companions. It is known that 57% of the progenitors of Mira-type variables, G and F dwarfs, have a companion with a mass more than a tenth of the primary mass (Duquennoy & Mayor, 1991). However, most of the companions around Mira-type primaries remain undetected because of the overwhelming flux of the Mira-type primary and the difficulty in making precise radial velocity measurements due to the stellar pulsation. The most reliable ways to detect companions are through the signs of wind accretion: either a short-wavelength (e.g. ultraviolet) excess or rapid photometric variability (Sokoloski et al., 2001).
Mira B was first discovered visually in 1923, when it was at a separation of 0.9” (Aitken, 1923), and has since been imaged in X-rays, ultraviolet and the radio (Karovska et al., 1997, 2005; Matthews & Karovska, 2006) . Observations of the Mira AB system with the Infrared Spatial Interferometer also offered a tentative detection of flux from near the position of Mira B at 11.17 m, interpreted as a clump of dust (Lopez et al., 1997). Previous attempts at deconvolution of mid-infrared images Marengo et al. (2001) showed a coma-like elongation in the direction of Mira B and a feature at twice the Mira AB separation, but quantitative interpretation of these data was difficult due to the difficulties in de-convolving seeing-limited images.
The nature of Mira B has been and remains controversial, due to the radiation originating from Mira B being dominated by accretion. According to the arguments originally made by Jura & Helfand (1984) and reinforced by Kastner & Soker (2004), Mira B must be a low-mass main sequence star, as the X-ray and total luminosity of Mira B is far too weak for the companion to be a white dwarf. This argument relies on measurements of the Mira B wind, reasonable values for the true (i.e. non projected) separation of Mira AB and the Bondi-Hoyle accretion rate being correct within a factor of 10.
This paper presents novel non-redundant interferometry observations of Mira AB, enabling robust detection of mid-infrared flux from the vicinity of Mira B. These and other traditional imaging observations are presented in detail in Section 2. An examination of possible models for this emission is presented in Section 3 and the implications of the preferred (disk) model presented in Section 4.
2 Observations
In the mid-infrared, observations on a 10 m class of telescope can be nearly diffraction limited in good seeing conditions. With a 15 cm atmospheric coherence length at 550 nm, a 10 m aperture is two coherence lengths wide at 10 m. In this regime, the image of a point source usually has a single bright core, but deconvolution is difficult due to changes in seeing and changes in low order aberrations with changing elevations.
We first overcame these difficulties by individually re-pointing and re-phasing 4 sets of 6 segments out of the 36 separate segments that made up the primary mirror of the Keck I telescope. As part of an observing program designed to resolve the dusty winds from Mira variables, these “segment tilting” observations of Ceti were made at 8, 9.9, 10.7 and 12.5 m. These four sets of segments formed 4 interferograms on the Long-Wavelength Spectrometer (LWS) camera, each of which gave 15 visibility amplitude and 20 closure phase (10 independent) measurements on the source. This technique is described in Monnier et al. (2004) and Weiner et al. (2006). At 10.7 m, data was also taken in a configuration with 3 sets of 7 segments with non-redundant spacings. Calibration observations were made of Cet and Tau to calibrate visibility amplitude and subtract out any instrumental closure-phase.
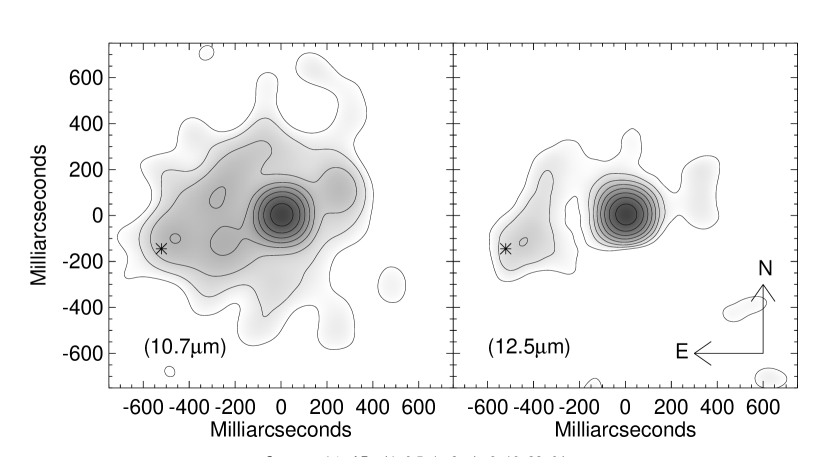
The MACIM algorithm: a Monte-Carlo technique for imaging from closure-phase and squared visibility (Ireland et al., 2006) was used to create images at all wavelengths. As part of this imaging process, we incorporated prior knowledge that a set fraction of the flux comes from a compact central source (i.e. the central star Mira A) with a 50 mas diameter. This size comes from the longer-baseline observations of Weiner et al. (2003). We estimated the fraction of light from this 50 mas source by assuming simple black-body emission, based on the source containing 75% of the 8 m flux. This step had little effect on flux near the location of Mira B, but affected the deconvolution of the central source and dust shell, due to the documented tendency for techniques in the Maximum-Entropy family to spread flux over the image at the expense of the compact central source. Unambiguous detections of flux near the location of Mira B were made at 12.5 and 10.7 microns, with a lower signal-to-noise detection at 9.9 microns. The 10.7 and 12.5 micron images are shown in Figure 1.
The separation and position angle of Mira B with respect to Mira A was obtained for the 10.7 and 12.5 m data by searching for a peak in the difference image between the reconstructed image and the azimuthally-averaged reconstructed image with Mira B masked-out. Flux measurements of Mira B were obtained from aperture-photometry on this differenced image. We also attempted to simultaneously reconstruct a dust shell image and perform a binary fit to the Fourier data using MACIM, obtaining consistent results and an independent estimation of errors on the binary parameters directly from MACIM’s Markov Chain. The average separation and position angle from these fits is ″and degrees. We independently calibrated the camera plate scale and orientation by observing binaries XY Per and Her, giving results in agreement with previous calibrations (McCabe et al., 2006). Plate scale uncertainties are included in the above error estimates.
To obtain comparable astrometry for the ultraviolet position of Mira B, we extrapolate based on a linear fit between Karovska et al. (1997) and the 2004 February HST STIS O8WY02040 data sets. Projected to JD 2453248, we find a separation of ” at degrees. In comparing the ultraviolet and mid-infrared detections, the position angles are found to be consistent. However, the difference in separation is significant, so the thermal IR and UV emission from Mira B must arise from different physical regions.
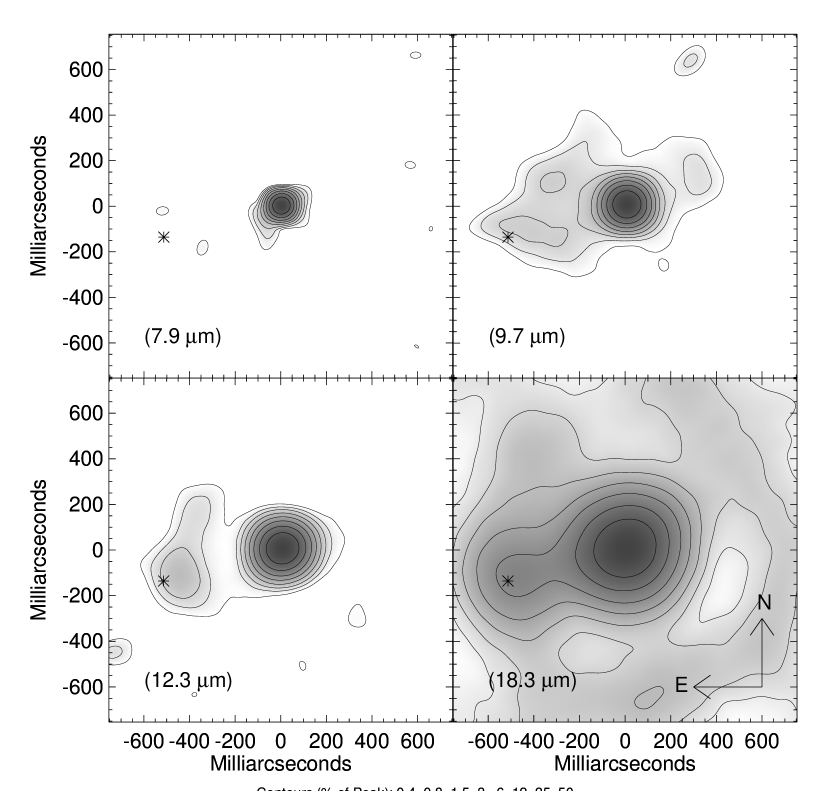
To confirm this result, we obtained additional data using an aperture-mask in the T-ReCS camera on Gemini South (Program ID GS-2006B-Q-15). The mask is installed in the cold Lyot stop wheel of T-ReCS, decreasing the background significantly from the Keck experiment, where the full telescope pupil contributed to the background in all interferograms. This mask has 7 holes in a non-redundant configuration, amounting to 21 simultaneous visibility amplitudes and 35 closure-phases (15 independent). Baseline lengths projected on the primary mirror range from 1.78 to 6.43 m, and sky rotation is used to increase the Fourier coverage while maintaining the same relationship between positions on the mask and positions on the primary mirror. The masking observations of Mira AB used Eri, Ceti and Tau as interferometric calibrators.
These data were obtained in November 2006 at 7.7 m, 9.7 m, 12.3 m and 18.3 m. Due to a greater instrumental stability, these data were of better quality than the Keck data, although the resolution was slightly less and as Mira A was near minimum, the contrast between Mira A and the dust shell was lower. Images reconstructed using MACIM are shown in Figure 2 - again showing a clear feature in the vicinity of Mira B in three out of four filters. Astrometry and flux estimates were obtained in a similar way to the Keck data, with fits summarized in Table 1. Flux ratios and astrometry were consistent between the Keck and Gemini data.
In addition to these mid-infrared aperture-masking observations, we analyzed earlier Keck/LWS observations of Ceti from September 1999 and August 2002 made without the use of a mask or segment-tilting. Rotating the images 180 degrees and subtracting enabled most of the primary PSF to be removed. Again, a bright feature in the vicinity of Mira B was detected at a high level of confidence. The contrast ratios obtained from these data were 0.1020.022 in September 1999 (JD 2451423.6) and in August 2002 (JD 2452506.6). The errors were estimated by applying the same analysis method to 6 calibrator star observations.
Other observations at wavelengths between 0.97 microns (HST, NICMOS data set N4RK02OTQ) 3.08 microns (aperture-masking) and 4.67 microns (direct imaging) did not detect the companion, but were able to place 2- upper limits on the contrast ratio of 500:1, 700:1 and 700:1 respectively. All observations reported in this paper as well as previously published HST observations, are summarized in Table 1, with the spectral-energy distribution shown in Figure 3. In addition to these observations, the paper of Lopez et al. (1997) provided model-fits to Infrared Spatial Interferometer (ISI) observations with a dust ‘clump’ near the location of Mira B. They reported the separation and position angle of this clump to be 0.55 and 120 degrees, but with no estimate of uncertainty due to the limited uv coverage of the array. The flux ratios of the clump were not given, although the dust has an optical-depth near unity and a linear size of 17 AU.
| Wavelength | Instrument | JD | Pulsation | Contrast B/A | Sep | PA | Mira AB FluxbbFlux error are 15% or 0.15 mag unless indicated otherwise. The magnitude scale is in Vega magnitudes. | Mira B FluxbbFlux error are 15% or 0.15 mag unless indicated otherwise. The magnitude scale is in Vega magnitudes. |
|---|---|---|---|---|---|---|---|---|
| (m) | Phase | (mas) | (degs) | (Mag[M] or Jy[J]) | (Mag[M] or Jy[J]) | |||
| 0.346 | FOC | 2450063.3 | 0.70 | 11.01.6 | 5782aaBinary fit for JD 2450063.3 comes from an average of several measurements between 0.278 and 0.501 m, as described in Karovska et al. (1997). | 108.30.1aaBinary fit for JD 2450063.3 comes from an average of several measurements between 0.278 and 0.501 m, as described in Karovska et al. (1997). | 10.14M | 10.23M |
| 0.501 | FOC | 2450063.3 | 0.70 | 0.880.12 | - | - | 10.48M | 11.30M |
| 0.374 | STIS | 2453051.8 | 0.65 | 0.800.04 | 5463 | 105.80.3 | 11.07M | 11.95M |
| 0.97 | NICMOS | 2451037.3 | 0.62 | 0.002 | - | - | - | - |
| 3.08 | NIRC | 2453252 | 0.24 | 0.0014 | - | - | - | - |
| 4.67 | NIRC2 | 2453909.5 | 0.22 | 0.0014 | - | - | - | - |
| 18.75 | LWS | 2451423.6 | 0.77 | 0.1020.022 | 47620 | 992 | 1050J | 10728J |
| 17.65 | LWS | 2452506.6 | 0.02 | 0.110.03 | 51134 | 964 | 1020J | 11235J |
| 10.7 | LWS | 2453248 | 0.24 | 0.0220.003 | 47014 | 102.71.6 | 4190J | 92J |
| 12.5 | LWS | 2453248 | 0.24 | 0.0210.003 | 48914 | 105.22.0 | 2450J | 51J |
| 7.9 | T-ReCS | 2454053.6 | 0.65 | 0.005 | - | - | 1780J | - |
| 9.7 | T-ReCS | 2454053.6 | 0.65 | 0.0250.012 | 48030 | 1013 | 2040J | 51J |
| 12.3 | T-ReCS | 2454053.6 | 0.65 | 0.0270.009 | 46730 | 1043 | 1410J | 3813J |
| 18.3 | T-ReCS | 2454055.6 | 0.65 | 0.0650.02 | 48730 | 1053 | 1690J | 11035J |
3 Modeling the IR emission
In order to find a preferred model for the mid-infrared emission coming from the region around Mira B, we must explain the time-dependent astrometry and the total flux (i.e. the energetics) of the emission. We will now examine several hypotheses in turn.
3.1 A Dust Clump in the Wind?
If the radiation near Mira B were re-processed radiation from Mira A, then the flux would change with the Mira variability cycle. There is a decrease in flux at the most temperature-sensitive wavelength of 10 m for the feature near Mira B occurring over the interval between the Keck (LWS) and Gemini (T-ReCS) observations. This decrease co-incides with a decrease in the flux from Mira A due to the Mira variability cycle (see Table 1), consistent with the re-processsed radiation hypothesis. This is further supported by the modeling of Lopez et al. (1997), where a constant amount of dust was used to model observations at several epochs. One possible origin is therefore re-radiated flux from an unusually dense clump in the wind from Mira A.
The likelihood of a clump of dust in the wind causing the mid-infrared emission is not great, as an optical-depth of order unity is required to produce enough emission. In turn, this requires a wind over-density of at least 25 (based on full silicate condensation at solar metallicity).
We can be slightly more sophisticated and model this dust clump as a uniform slab, assuming that the dust is made from a combination of fully-condensed corundum and olivine at solar metallicity. We take the optical constants for olivine from Dorschner et al. (1995) and those of corundum from Koike et al. (1995) and calculate dust opacities as in Ireland & Scholz (2006). From three-color photometry, we can derive a column density, a temperature and an angular extent as the radius of an equivalent uniformly-illuminated disk. For the near-maximum LWS data, we obtain 0.28 g cm-2, 310 K and a disk radius of 59 mas, and for the near-minimum T-ReCS data we obtain 0.2 g cm-2, 240 K and 96 mas. These temperatures are also consistent with the assumption of heating of the dust by Mira A for moderate (roughly 45 degree) angles between the clump to the line-of-sight. These column densities can be compared to those of a 100 AU deep column in the time-averaged wind at the 50 AU projected separation, which totals only 0.007 g cm-2.
These calculations are somewhat dependent on the assumed and unknown dust opacities, but they serve to provide plausible physical model parameters for the emission. The large required column densities are due to the emission in the 12 m bandpasses being brighter than expected from optically-thin emission in the 10 and 18 m bands. Alternatively, one can think of the emission at 10 and 18 m as being suppressed due to the dust being optically-thick.
The modeling of the Fourier data in Lopez et al. (1997) put a dust ‘clump’ near the location of Mira B between 1990 and 1994. The position angle of 120 degrees and separation of 0.55 places this emission inside the early-1990s position of Mira B but outside the position of the dust clump reported in this paper. Therefore, not only is this clump of dust inexplicably over-dense, but its apparent motion is in the opposite direction to the outflow from Mira A, which should move outwards at 14 mas per year according to the outflow measurements of Knapp et al. (1998) with an assumed distance of 107 pc. This would mean that if the dust ‘clump’ seen by Keck and Gemini moved with the Mira A outflow, it would have been at during the Lopez et al. (1997) epoch. Despite the simple modeling in that paper, it is not plausible that the clump separation was overestimated by a factor of 1.8, or that in addition to the 0.55 clump, a (brighter) 0.31 clump was missed in the analysis.
Therefore, due to both the anomalously high optical depth of dust near Mira B and the motion of the emission counter to to the prevailing wind from Mira A, we conclude that the mid-infrared emission is inconsistent with a clump in the wind from Mira A.
3.2 Emission from the Wind Interaction Region?
Although the variability of the mid-infrared flux near Mira B is consistent with re-processed radiation from Mira B, the phase coverage and signal-to-noise of the data in Table 1 is clearly inadequate to exclude processes independent of Mira A’s radiation field. Therefore, we will check if the energy involved in the wind interaction region is enough to explain the mid-infrared emission. Wood & Karovska (2006) model the early 2004 outflow from Mira B as a 450 km s-1 wind losing yr-1. This wind is variable, with evidence that it was weaker in the late 1990s and stronger in the IUE era (Wood et al., 2002). As this wind encounters the more dense wind from Mira A, it will lose it’s energy in a shock front. This shock luminosity () will be , which is a tiny fraction of the mid-infrared luminosity coming from near Mira B, which is .
Thus, if the mid-infrared emission were to originate from the wind-interaction region, it would have to be due to a quasi-static increase in the density of Mira A’s wind due to the wind from Mira B. According to the model of Section 3.1, this region has to have at least solar-masses of material, over a length scale of AU. 20 AU is roughly the maximum distance over which the flux would still be largely unresolved in our images, once projection effects are taken into account.
The simplest geometry in which to consider the outflow from Mira B is one where the wind from Mira B is largely perpendicular to the wind from Mira A. In this geometry, the mass excess due to the slowing of Mira A’s wind by Mira B’s wind is of order over length scales , which is , or 6 orders of magnitude too little material.
The outflow from Mira B may be nearly spherically-symmetric, including a component as just described, as well as a region where the two winds collide nearly head-on, possibly forming a stagnation point. Calculation of the stagnation point position is a simple balance of dynamic (ram) pressures , where is the wind density and the wind speed (for either Mira A or Mira B). This stagnation point is significantly influenced by the gravitational field from Mira B: both by an change in density of Mira A’s wind and an increase in velocity.
We have taken these effects into account using Newtonian physics, and calculated the stagnation point position. With Mira B wind parameters of at 450 km s-1, Mira A wind parameters of at 6.7 km s-1 (Knapp et al., 1998) a Mira AB distance of 90 AU and a Mira B mass of 0.7 M☉ (see Section 3.4), this stagnation point occurs only 1 AU from Mira B (projection effects not taken into account). An upper limit for this distance is the 3.7 AU calculated in Wood et al. (2002) for the stronger IUE era wind, with different assumed wind and orbital parameters. Therefore, a large build-up of dust at this stagnation point could not form a region geometrically large enough to provide the mid-infrared flux.
3.3 Emission from a Centrally-Illuminated Accretion Disk
T Tauri stars are well known to have significant mid-infrared excesses. As accretion onto Mira B occurs through a disk, we can also ask if the emission is consistent with expectations from known and well-characterized accretion disks. By comparing the emission of the Mira B system to T Tauri stars (i.e. systems with significant accretion luminosity) as in Figure 3, it is clear that although the blue and ultraviolet accretion luminosity is typical, the very large mid-infrared flux from Mira B is anomalous by more than a factor of 50. Therefore, this emission must be due to a mechanism atypical of isolated systems with a disk and outflow. Furthermore, the problem of the in-phase variation with the Mira A primary presents an additional stumbling block to this model.
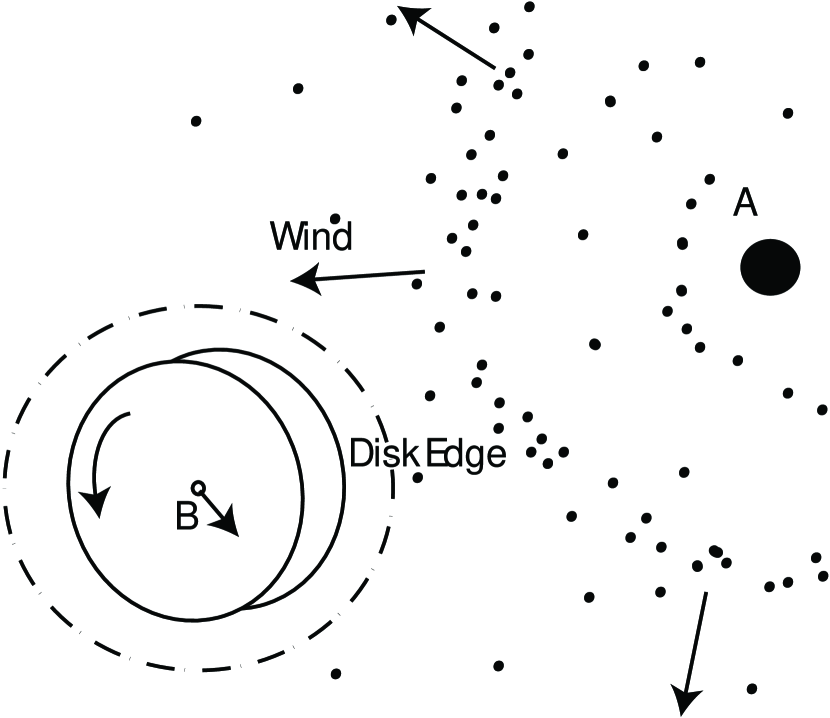
3.4 The Edge of a Self-Shadowed Accretion Disk
We will now examine a model of the mid-infrared emission near Mira B that is caused by illumination of an accretion disk around Mira B by radiation from Mira A. In this section we will not discuss the possibilities of this disk being around a white dwarf or a main sequence star. This disk will be supposed to be in the plane of the Mira AB orbit, so that one edge is illuminated and the opposite edge is in shadow. This co-planar geometry is expected if angular momentum is preferentially accreted in the plane of the orbit. It is illustrated in Figure 4. First, we shall review the theory of wind accretion as it applies to Mira AB.
The accretion of the wind from Mira A onto Mira B is given by the formulae of Bondi-Hoyle-Lyttleton accretion (e.g. Edgar, 2004). In its simplest form, the wind is gravitationally focused into a wake behind the accretor, and the wake is accreted wherever it is gravitationally bound to the accretor. This gives an accretion radius, which is the radius of a circular area that corresponds to the effective cross-section of the accretor:
| (1) |
Here is the accretor (i.e. Mira B) mass, the wind velocity and the orbital velocity. This formula is most applicable to highly supersonic flows, which is the case for Mira B accreting the wind from Mira A. This accretion radius can be used to find an accretion rate:
| (2) |
The accretion luminosity is then given by the simple formula , where is the radius of the companion. This formula assumes an equilibrium situation, which may not be the case if material is accumulating within the disk.
In order to test hypotheses that the accretion disk around Mira B has been directly observed, we should first examine some basic parameters of the system. The best estimate for is per year, with km s-1 (Knapp et al., 1998). This mass-loss rate is based on a CO to H2 ratio of which is in turn based on a near-solar metallicity. If Mira A has sub-solar metallicity as expected from its kinematic association with the thick-disk population, then this mass-loss rate will be underestimated. The orbit of Mira B is poorly known due to it’s long period, but if we assume a circular orbit and fix the total system mass to 1.5 , then the astrometry of Prieur et al. (2002) combined with the most recent HST epoch (in Table 1) gives a crude orbital radius of AU, an inclination is 63 degrees and a period of 610 years. Changing the assumed total system mass to 2.0 only changes the orbital radius to 85 AU and the inclination to 66 degrees. For the total mass 1.5 orbit, we have an orbital velocity km s-1 and an accretion radius in AU of 32 according to Equation 1.
The maximum size of the accretion disk around Mira B will be approximately the Bondi-Hoyle accretion radius, as beyond this radius the wind from Mira A will have enough energy to both escape from the gravity of Mira B and transfer some momentum onto material orbiting around Mira B. Conversely, the minimum accretion radius is the size of the disk measured from the difference in astrometry between Mira B and the mid-infrared emission. In the plane of the sky, the mid-infrared emission is separated from Mira B by AU. The error in this astrometric difference is difficult to quantify in individual images, particularly given the possibility that asymmetries in the atmosphere of Mira A could move its centroid around by of order 1 AU. However, even if we do not count the Lopez et al. (1997) result as a single measurement, then we have 6 independent measurements of the astrometric difference in Table 1 that give the same sign and a similar magnitude. Determination of the average separation between Mira B (from the UV) and the mid-infrared emission therefore appears statistically robust with reliable errors. The true separation of Mira B and the mid-infrared emisson is then AU, given that the vector between Mira A and B is at 38 degrees to the line-of-sight from our preferred orbit. This is consistent with a disk AU in size once the effect of the curved geometry of the disk edge is taken into account.
This disk size is is consistent with Bondi-Hoyle accretion theory, predicting an accretion radius range from 16 to 22 AU for between 0.5 and 0.7 . Importantly, the disk size shows that the accretion radius cannot be under-predicted using Bondi-Hoyle accretion theory by more than a factor of 2.
We must also establish that the amount of mid-infrared emission seen from the edge of the disk around Mira B is consistent with the observed emission. Already in Section 3.1 we have seen that the emission is consistent with a region of cross-sectional area about 100 square AU at temperature 310 K (from the slab model with a radius of 59 mas). If Mira B is on the far side of Mira A as viewed from Earth, we see the edge of the disk that is directly illuminated by Mira A.
If the disk edge has a temperature of 310 K, then its hydrostatic equilibrium density distribution is Gaussian with Full-Width Half-Maximum (FWHM) of 1.5 AU at a 10 AU radius. This disk of diameter 20 AU would only give a 100 square AU cross-sectional area if the disk remained optically-thick to radiation from Mira A out to several times the density FWHM. However, given the significant uncertainties and simplifications in the slab model (including the opacities themselves), this emission is certainly consistent with an origin in a side-illuminated accretion disk.
Note also that the spectral energy distribution shown in Figure 3 is not consistent with the optical depth of unity temperature being the same throughout the mid-infrared: the sillicate emission peak and the upper limit at 7.9 m (from the near-minimum Gemini epoch) demonstrate that the outer surface of the disk has to be heated. This is an essential part of any physical model of the disk, where radiative energy flows inwards.
Given that we have established that Mira B has a 10 AU radius dusty disk around it, we should establish whether the term ‘protoplanetary’ can be applied to it. This term implies that there is or will be enough material in the disk to form planets. According to the prescription of Hayashi (1981), the minimum-mass solar nebula had 2 Jupiter masses out to a radius of 10 AU. The total mass accreted onto Mira B during the lifetime of Mira A is of order 7 Jupiter-masses, assuming that Mira B has 0.7 solar-masses and Mira A loses 0.6 solar masses while on the Asymptotic Giant Branch. The ability for such a disk to form planets clearly depends on a number of factors, such as the role of viscosity in the disk and the maximum accretion rate that will occur as Mira A’s wind transitions to a radiatively driven wind with a 20 times increase in mass-loss rate.
According to the viscous evolution prescription of Alexander et al. (2006) with their ‘typical’ disk parameters, the current equilibrium disk mass around Mira B is only 0.26 based on a 0.7 , an accretion rate given by Equation 2 and a disk radius of 10 AU. The time scale for viscous evolution of the disk is years. As the time scale for Mira A’s evolution is based on the time between thermal pulses which is of order years (Vassiliadis & Wood, 1993), the disk will likely maintain a near-equilibrium mass. At the time Mira A becomes a white dwarf, and the mass-loss rate from Mira A is solar-masses per year, the equilibium disk mass will have increased to several Jupiter-masses, certainly enough to justify the title ‘protoplanetary disk’.

4 Discussion
4.1 Nature of Mira B
Now that we have established that Mira B has a AU accretion disk around it, we should re-examine the idea that Mira B is a main-sequence star and not a white dwarf as often identified in the literature. The Mira AB system is quite different to symbiotics such as MWC 560, where the accretion luminosity is 1000 instead of 0.1 . However, accretion luminosity should vary by several orders of magnitude for symbiotics due to differing accretion rates, and as Mira AB is unique in its relatively well-known geometry and wind properties, it is difficult to make quantitative comparisons. A second general property of symbiotics such as MWC 560 is that there are spectral features with wind absorption and emission profiles with widths that are one to several thousand km s-1 (Schmid et al., 2001), comparable to or greater than the escape velocity from the surface of a white dwarf. Despite the large number of lines observed for Mira B (e.g. Wood & Karovska, 2006), there are no lines with half-widths of several thousand km s-1 as one would expect if Mira B were a white dwarf.
The analysis of Section 3.4 demonstrated that the observed size of the accretion disk around Mira B is consistent with Bondi-Hoyle accretion, and that this accretion theory cannot underestimate the accretion rate onto Mira B by more than a factor of a few. On the other hand if we assume that Mira B is a 0.6 white dwarf, then the same analysis gives an accretion rate of /yr and an accretion luminosity of 9.4L☉. This is inconsistent with the measured accretion luminosity of Mira B, which is , depending on what fraction of the flux is from accretion and what the extinction is. The value of is an upper limit based on all the measured luminosity at m being due to accretion and , the extinction calculated from full silicate condensation in Mira A’s wind. There is a possibility that the accretion luminosity is lower than expected for Mira B due to a non-equilibrium situation where mass is accreted into a disk but not onto Mira B itself. The disk evolution time-scale discussed in Section 3.4 makes this a highly unlikely scenario. If on the other hand, we assume that Mira B is a 0.7 main-sequence star, then the accretion luminosity is 0.2, completely consistent with the measured luminosity of Mira B.
Finally, if Mira B were a main-sequence star, we could expect to see spectral features that indicate the presence of a main-sequence star, although these features could be very weak. The weak features are due to significant veiling by the accretion flux: a good example of this is for T Tauri stars can be found in the spectrum of BP Tau, which is significantly veiled for all wavelengths shorter than 0.5 m (Gullbring et al., 2000). The Faint Object Camera (FOC) spectra partially published in Karovska et al. (1997) do indeed show weak (i.e. veiled) spectral features of an early-mid K dwarf.
We have examined the full wavelength range of this spectrum (including that not published), derived from HST data set X31G010AT, and displayed the long-wavelength end of it in Figure 5. We took the wavelength scale calibration from Chapter 8 of the FOC manual, referencing the zero point to the Mg II doublet near 2800 Åprominent in the Mira B spectrum. Prominent spectral features at 4250 Åand 5100 Åare both detected at , matching a veiled model 4000 K dwarf spectrum well. The 60% veiling in V-band places the photospheric spectrum of Mira B at an absolute V magnitude of , also consistent with a 0.7 K5 dwarf (with mag of extinction at V band).
All remaining possibilities for the nature of Mira B that could influence our conclusions consist of some kind of exotic geometries. An example could be a triple system with a radial velocity signature less than km s-1 (so that it is not betrayed by ultraviolet spectral shifts) and a close-system separation less than AU. In the absence of any data to support such a possibility, we will eliminate these possibilities with an appeal to Occam’s razor. Therefore, we conclude that Mira B is indeed a main-sequence star, with a most probable mass of roughly 0.7 .

4.2 How common are systems like Mira B?
From the standpoint of population synthesis, we can examine how common we expect Mira B like systems to be. Our current galactic location in-between spiral arms means that the column-integrated star formation rate is about a quarter of what it was when Mira A’s progenitor was born (Schröder & Pagel, 2003). In order to accrete at least a Jupiter mass via wind-accretion, a wind-accreting binary should have log(P) between 4 and 6.5 in days (the upper limit for P is dependent on primary and secondary mass). According to Duquennoy & Mayor (1991), 23% of solar-mass stars have companions with log(P) in this range. These results, taken together, imply that the birth-rate of Mira B-like disks around companions to 1-2 stars should be similar to the local birth-rate of 1-2 stars themselves.
This immediately raises the question: where are the disks that formed by wind-accretion? Most debris disks in the solar neighborhood are around stars likely belonging to young associations (Moór et al., 2006). However, these debris disks are also generally cool and large, while a wind-accretion disk will be truncated by the dynamical pressure of the wind at roughly the Bondi-Hoyle accretion radius. The disks around secondaries in wind-accretion binaries should grow viscously after the primary dwindles into a white-dwarf, but clearly this process must leave debris disks much less often than the large primordial disks around young stars.
The expected abundance of disks around companions to young white dwarfs is a clearly testable hypothesis of the Bondi-Hoyle truncation model of wind-accretion disks presented here. However, in order to test it, a sample of very young white dwarfs in binaries would have to be chosen. There are some such systems discovered through UV excesses: Burleigh et al. (1997) discusses many of them and some of the difficulties in forming a near-complete sample. Other systems are discovered through infrared excesses to white dwarfs: many of these have been imaged with HST (Farihi et al., 2006). Disk fraction around the main sequence companions should approach unity for appropriate separations and ages less than several times the disk viscous evolution time-scale, i.e. a few years.
5 Conclusions
This paper has presented evidence that Mira B is a 0.7 main sequence star surrounded by a AU radius disk. The new observations on which this is based were made possible by the high-contrast imaging capability of non-redundant interferometry on single-aperture telescopes. Mira AB is unique amongst wind accretion binaries in its well known binary and wind parameters, but this class of system is predicted to be relatively common as the end product of roughly 1 in 5 star systems with a solar-type primary. Systems like Mira AB should produce the clear observational signatures of an accretion disk around the secondary for at least a few years after the primary becomes a white dwarf.
References
- Aitken (1923) Aitken, R. G. 1923, PASP, 35, 323
- Alexander et al. (2006) Alexander, R. D., Clarke, C. J., & Pringle, J. E. 2006, MNRAS, 369, 229
- Burleigh et al. (1997) Burleigh, M. R., Barstow, M. A., & Fleming, T. A. 1997, MNRAS, 287, 381
- Dorschner et al. (1995) Dorschner, J., Begemann, B., Henning, T., Jaeger, C., & Mutschke, H. 1995, A&A, 300, 503
- Duquennoy & Mayor (1991) Duquennoy, A., & Mayor, M. 1991, A&A, 248, 485
- Edgar (2004) Edgar, R. 2004, New Astronomy Review, 48, 843
- Farihi et al. (2006) Farihi, J., Hoard, D. W., & Wachter, S. 2006, ApJ, 646, 480
- Gullbring et al. (2000) Gullbring, E., Calvet, N., Muzerolle, J., & Hartmann, L. 2000, ApJ, 544, 927
- Hauschildt et al. (1999) Hauschildt, P. H., Allard, F., & Baron, E. 1999, ApJ, 512, 377
- Hayashi (1981) Hayashi, C. 1981, Progress of Theoretical Physics Supplement, 70, 35
- Ireland et al. (2006) Ireland, M. J., Monnier, J. D., & Thureau, N. 2006, in Advances in Stellar Interferometry. Edited by Monnier, John D.; Schöller, Markus; Danchi, William C.. Proceedings of the SPIE, Volume 6268, 58
- Ireland & Scholz (2006) Ireland, M. J., & Scholz, M. 2006, MNRAS, 367, 1585
- Jura & Helfand (1984) Jura, M., & Helfand, D. J. 1984, ApJ, 287, 785
- Karovska et al. (1997) Karovska, M., Hack, W., Raymond, J., & Guinan, E. 1997, ApJ, 482, L175+
- Karovska et al. (2005) Karovska, M., Schlegel, E., Hack, W., Raymond, J. C., & Wood, B. E. 2005, ApJ, 623, L137
- Kastner & Soker (2004) Kastner, J. H., & Soker, N. 2004, ApJ, 616, 1188
- Knapp et al. (1998) Knapp, G. R., Young, K., Lee, E., & Jorissen, A. 1998, ApJS, 117, 209
- Koike et al. (1995) Koike, C., Kaito, C., Yamamoto, T., Shibai, H., Kimura, S., & Suto, H. 1995, Icarus, 114, 203
- Lopez et al. (1997) Lopez, B., Danchi, W. C., Bester, M., Hale, D. D. S., Lipman, E. A., Monnier, J. D., Tuthill, P. G., Townes, C. H., Degiacomi, C. G., Geballe, T. R., Greenhill, L. J., Cruzalebes, P., Lefevre, J., Mekarina, D., Mattei, J. A., Nishimoto, D., & Kervin, P. W. 1997, ApJ, 488, 807
- Marengo et al. (2001) Marengo, M., Karovska, M., Fazio, G. G., Hora, J. L., Hoffmann, W. F., Dayal, A., & Deutsch, L. K. 2001, ApJ, 556, L47
- Matthews & Karovska (2006) Matthews, L. D., & Karovska, M. 2006, ApJ, 637, L49
- McCabe et al. (2006) McCabe, C., Ghez, A. M., Prato, L., Duchêne, G., Fisher, R. S., & Telesco, C. 2006, ApJ, 636, 932
- Monnier et al. (2004) Monnier, J. D., Tuthill, P. G., Ireland, M. J., Cohen, R., & Tannirkulam, A. 2004, in Bulletin of the American Astronomical Society, 1367
- Moór et al. (2006) Moór, A., Ábrahám, P., Derekas, A., Kiss, C., Kiss, L. L., Apai, D., Grady, C., & Henning, T. 2006, ApJ, 644, 525
- Prieur et al. (2002) Prieur, J. L., Aristidi, E., Lopez, B., Scardia, M., Mignard, F., & Carbillet, M. 2002, ApJS, 139, 249
- Schmid et al. (2001) Schmid, H. M., Kaufer, A., Camenzind, M., Rivinius, T., Stahl, O., Szeifert, T., Tubbesing, S., & Wolf, B. 2001, A&A, 377, 206
- Schröder & Pagel (2003) Schröder, K.-P., & Pagel, B. E. J. 2003, MNRAS, 343, 1231
- Sokoloski et al. (2001) Sokoloski, J. L., Bildsten, L., & Ho, W. C. G. 2001, MNRAS, 326, 553
- Vassiliadis & Wood (1993) Vassiliadis, E., & Wood, P. R. 1993, ApJ, 413, 641
- Weiner et al. (2003) Weiner, J., Hale, D. D. S., & Townes, C. H. 2003, ApJ, 588, 1064
- Weiner et al. (2006) Weiner, J., Tatebe, K., Hale, D. D. S., Townes, C. H., Monnier, J. D., Ireland, M., Tuthill, P. G., Cohen, R., Barry, R. K., Rajagopal, J., & Danchi, W. C. 2006, ApJ, 636, 1067
- Wood & Karovska (2006) Wood, B. E., & Karovska, M. 2006, ApJ, 649, 410
- Wood et al. (2002) Wood, B. E., Karovska, M., & Raymond, J. C. 2002, ApJ, 575, 1057