Suzaku Observations of the Soft X-ray Background
Abstract
We have analyzed a pair of Suzaku XIS1 spectra of the soft X-ray background, obtained by observing towards and to the side of a nearby ( pc) absorbing filament in the southern Galactic hemisphere. We fit multicomponent spectral models to the spectra in order to separate the foreground emission due to the Local Bubble (LB) from the background emission due to the Galactic halo and unresolved AGN.
We obtain LB and halo parameters that are different from those obtained from our analysis of XMM-Newton spectra from these same directions. The LB temperature is lower ( versus 6.06), and the flux due to the LB in the Suzaku band is an order of magnitude less than is expected from our XMM-Newton analysis. The halo components, meanwhile, are hotter than previously determined, implying our Suzaku spectra are harder than our XMM-Newton spectra.
1 Introduction
Previous analyses have shown that several different components contribute to the soft X-ray background (SXRB), including a hot bubble surrounding the solar neighborhood (the Local Bubble; LB), hot gas in the Galactic halo, and unresolved AGN composing the extragalactic background. X-ray spectroscopy of the SXRB is important as it enables us to determine the thermal properties, ionization state, and chemical abundances of the X-ray-emitting plasma. This helps us constrain models for the origin of the hot gas in the LB and halo, both of which are poorly understood.
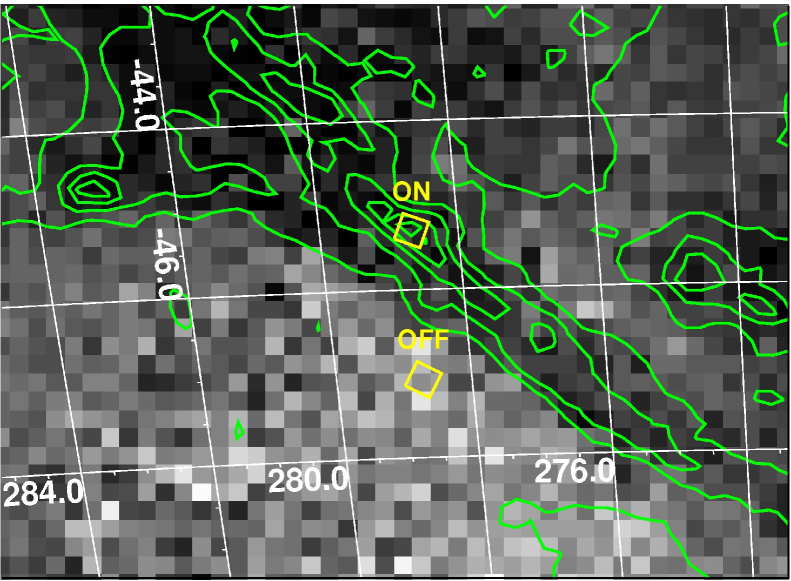
In this paper we determine the spectra of the LB and the halo from a pair of Suzaku observations. The Suzaku observations were obtained for pointings on and off a nearby absorbing filament in the southern Galactic hemisphere (, pc), which appears as a shadow in the soft X-ray background (see Fig. 2). Both observed spectra are expected to be of the form
Since the absorbing column is different in the two pointing directions ( [on] versus [off]), fitting models simultaneously to both spectra enables one to disentangle the LB and halo contributions.
2 Spectral Analysis
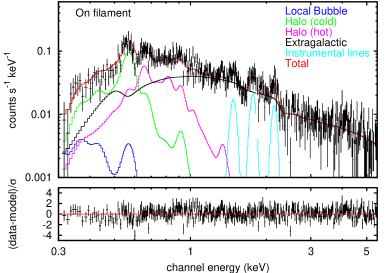
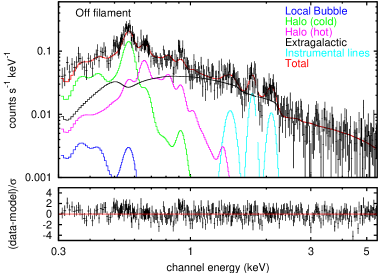
In our analysis, we concentrate only on data from the XIS1 detector, as this has the greatest sensitivity at low energies. We simultaneously fit models consisting of LB, halo, and extragalactic components to our on- and off-filament spectra. As indicated in §1, the LB component is not subject to any absorption, whereas the halo and extragalactic components are. We modeled the Local Bubble plasma as an isothermal optically thin plasma, and the halo plasma as an optically thin plasma having two temperature components. To model the plasmas’ thermal emission, we used the APEC plasma emission code.[7] We modeled the extragalactic background’s spectrum with a power-law. To help constrain the model at low energies we included R12 data from the ROSAT All-Sky Survey in the fit. To model the ROSAT emission we used the Raymond & Smith code[5], as APEC is not accurate below 0.25 keV.111See http://cxc.harvard.edu/atomdb/issues_caveats.html The temperatures and emission measures of the Raymond & Smith components were tied to those of the corresponding APEC components.
Our observed spectra and best-fitting model are shown in Figure 3. The best-fitting model parameters are shown in Table 1 (model A). For comparison, Table 1 also contains the results of our XMM-Newton analysis for these observation directions[3] (model B).
| Suzaku ROSAT | XMM ROSATa | ||
| Model A | Model B | ||
| Local Bubble | |||
| ( pc) | 0.0043 | 0.018 | |
| Halo (cool) | |||
| ( pc) | 0.022 | 0.17 | |
| Halo (hot) | |||
| ( pc) | 0.0057 | 0.011 | |
| Exgal powerlaw | Normalizationb | 10.5c | |
| aRef. \citenhenley07 | |||
| bkeV cm-2 s-1 sr-1 keV-1, assuming a photon index of 1.46[1]) | |||
| cFrozen; ref. \citenchen97 | |||
3 Discussion
The LB temperature we obtain from our Suzaku spectra is smaller than that obtained from our XMM-Newton analysis,[3] and also from analyses of ROSAT All-Sky Survey data.[4] The emission measure is also smaller than our XMM-Newton-determined value, though this is largely due to a difference between the spectral codes used.[3] Both models predict similar ROSAT R12 count rates from the LB: counts (model A) versus counts (model B), compared with the observed on-filament R12 count rate of counts (the difference between the LB model count-rates and the observed count-rate can be attributed to background [halo extragalactic] emission that has leaked through the filament). The big difference between the models is in the Suzaku band: in model A, the 0.3–0.7 keV surface brightness of the LB ( erg ) is an order of magnitude smaller than in model B. The intensities of the LB O vii emission at 0.57 keV in the two models are 0.13 photons (model A) and 2.9 photons (model B). To put these results another way, the Suzaku spectra seem to be largely consistent with just an absorbed halo extragalactic spectrum, without a significant foreground component. It is currently unclear why our Suzaku spectra give different results from our XMM-Newton spectra.
The halo parameters in model A are also different from those in model B. Both halo components are hotter in model A than in model B, implying that the Suzaku spectra are harder than the XMM-Newton spectra. Indeed, in the Suzaku spectra, the Fe-L and Ne ix emission at 0.8–0.9 keV is brighter relative to the oxygen emission than in the XMM-Newton spectra. Also, the oxygen emission is distributed differently between the two halo components. In the XMM-Newton model (model B), the hotter component is the source of 60% of the halo O vii emission and 95% of the O viii emission, whereas in the Suzaku model it is the source of only 20% of the halo O vii emission and 75% of the O viii emission. Again, it is not currently clear why the Suzaku spectra are different from the XMM-Newton spectra.
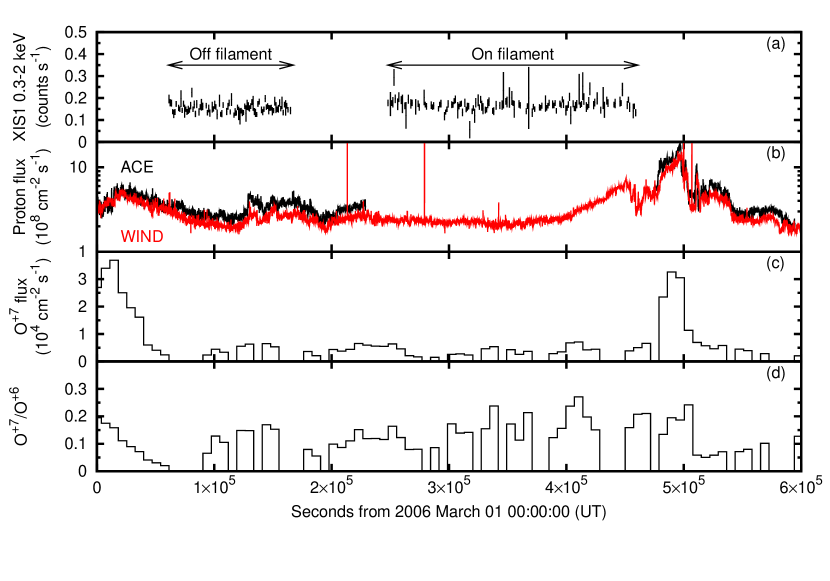
One might wonder if solar wind charge exchange (SWCX) is affecting one or both of our spectra, which would render our modeling method invalid. We have examined solar wind data from ACE and WIND, to see if there are any changes in solar wind properties between our observations. Various solar wind properties are plotted as functions of time in Figure 2, along with the Suzaku XIS1 0.3–2.0 keV count rate. The solar wind proton flux is fairly constant during the two observations, though it does start to rise towards the end of the on-filament observation. However, there is not an associated rise in the soft X-ray count rate in this observations, nor does there seem to be a change in the spectrum. Furthermore, the O+7 flux and the O+7/O+6 ratio is similar for both observations, and the values of these parameters are similar to what has been measured for other X-ray observations at times of low SWCX contamination.[9, 2] It therefore seems unlikely that SWCX is significantly contaminating our spectra, or, if it is, the SWCX emission should be the same for both observations, composing a fixed fraction of the foreground emission.
4 Summary
We have analyzed two Suzaku XIS1 spectra of the soft X-ray background, one obtained towards a nearby absorbing filament, and one to the side of the filament. We simultaneously fit multicomponent spectral models to both spectra in order to disentangle the Local Bubble (LB) and Galactic halo emission.
We obtain LB and halo parameters that are different from those obtained from XMM-Newton spectra from these same directions.[3] The LB component is 25% cooler, and gives an order of magnitude less flux in the Suzaku band than is expected from our XMM-Newton analysis. The halo components, meanwhile, are both hotter, implying that our Suzaku spectra are harder than our XMM-Newton spectra.
It is not currently clear why our Suzaku spectra give different results from our XMM-Newton spectra. Inspection of contemporaneous solar wind data implies that the discrepancy is not due to solar wind charge exchange contaminating our Suzaku spectra. We are continuing to work on this problem.
References
- [1] L.-W. Chen, A. C. Fabian and K. C. Gendreau, \JLMon. Not. R. Astron. Soc.,285,1997,449
- [2] R. Fujimoto, K. Mitsuda, D. McCammon, Y. Takei, M. Bauer, Y. Ishisaki, F. S. Porter, H.Yamaguchi, K. Hayashida and N. Y. Yamasaki, \JLPubl. Astron. Soc. Jpn.,59,2007,S133
- [3] D. B. Henley, R. L. Shelton and K. D. Kuntz, Astrophys. J., accepted (astro-ph/0701834)
- [4] K. D. Kuntz and S. L. Snowden, \AJ543,2000,195
- [5] J. C. Raymond and B. W. Smith, \JLAstrophys. J. Suppl. S.,35,1977,419
- [6] D. J. Schlegel, D. P. Finkbeiner and M. Davis, \AJ500,1998,525
- [7] R. K. Smith, N. S. Brickhouse, D. A. Liedahl and J. C. Raymond, \AJ556,2001,L91
- [8] S. L. Snowden, R. Egger, M. J. Freyberg, D. McCammon, P. P. Plucinsky, W. T. Sanders, J. H. M. M. Schmitt, J. Trümper and W. Voges, \AJ485,1997,125
- [9] S. L. Snowden, M. R. Collier and K. D. Kuntz, \AJ610,2004,1182