The Spitzer/IRS Infrared Spectrum and Abundances of the Planetary Nebula IC 2448
Abstract
We present the mid-infrared spectrum of the planetary nebula IC 2448. In order to determine the chemical composition of the nebula, we use the infrared line fluxes from the Spitzer spectrum along with optical line fluxes from the literature and ultraviolet line fluxes from archival IUE spectra. We determine an extinction of CHβ = 0.27 from hydrogen recombination lines and the radio to H ratio. Forbidden line ratios give an electron density of 1860 cm-3 and an average electron temperature of 12700 K. The use of infrared lines allows us to determine more accurate abundances than previously possible because abundances derived from infrared lines do not vary greatly with the adopted electron temperature and extinction, and additional ionization stages are observed. Elements left mostly unchanged by stellar evolution (Ar, Ne, S, and O) all have subsolar values in IC 2448, indicating that the progenitor star formed out of moderately metal deficient material. Evidence from the Spitzer spectrum of IC 2448 supports previous claims that IC 2448 is an old nebula formed from a low mass progenitor star.
Subject headings:
abundances — infrared: general — ISM: lines and bands — planetary nebulae: individual (IC 2448) — stars: AGB and post-AGB1. Introduction
Determining accurate abundances of planetary nebulae (PNe) is important for understanding how stars and galaxies evolve (Kaler, 1985). PNe abundances of elements made in low and intermediate mass stars (such as helium, carbon, and nitrogen) can be used to test stellar evolution models (Kwok, 2000). Abundances of elements which are not changed during evolution of low and intermediate mass stars (such as neon, argon, sulfur, and in some cases oxygen), can give insight into the chemical content of the gas from which the progenitor star formed (Kwok, 2000); thus abundances of PNe dispersed throughout a galaxy can be used to test galactic evolution models.
IC 2448 is an elliptical, average sized PN located at RA = , DEC = (J2000.0, Kerber et al. (2003)). Optical emission line images of IC 2448 show that diffuse [N II] and [O III] emission pervade the same oval region, which agrees with IC 2448 being an old, evolved nebula (Palen et al., 2002). McCarthy et al. (1990) give further evidence for IC 2448’s advanced age, finding that its evolutionary age is 8400 years and its dynamical age is 7000 years. IC 2448 has an H diameter of x (Tylenda et al., 2003). Thus at a distance of 2.1 0.6 kpc (Mellema, 2004), IC 2448 has an H size of 0.11 x 0.10 pc.
Two optical surveys and one optical+ultraviolet survey of PNe include abundance determinations for IC 2448 (Torres-Peimbert & Peimbert, 1977; Milingo et al., 2002b; Kingsburgh & Barlow, 1994). Here we report the first use of mid-infrared line fluxes from IC 2448 to determine its abundances. Using infrared (IR) lines to derive abundances has several advantages over using optical or ultraviolet (UV) lines (Rubin et al., 1988; Pottasch & Beintema, 1999). First, the correction for extinction in the IR is smaller than in the optical and UV, and therefore errors in the extinction coefficient and law affect IR line fluxes less. Second, IR lines are less sensitive to uncertainties in the electron temperature because they come from levels close to the ground level. Finally, some ions have lines in the IR spectrum of IC 2448, but not in the optical or UV spectra. When combined with ionic lines of these elements observed in the optical and UV, we have line fluxes for more ions of these elements than previous studies, reducing the need for ionization correction factors (ICFs) to account for unseen ionization stages.
In this paper we use the Spitzer IR spectrum supplemented by the optical and UV spectra to derive ionic and total element abundances of He, Ar, Ne, S, O, N, and C in IC 2448. The next section describes the Spitzer observations and the data reduction. §3 gives the optical and UV data. In §4 we derive the extinction, electron density, electron temperature, and ionic and total element abundances. §5 compares the abundances of IC 2448 with solar and discusses the nature of the progenitor star.
2. Spitzer Observations and Data Reduction
IC 2448 was observed with all four modules (Short-Low (SL), Long-Low (LL), Short-High (SH), and Long-High (LH)) of the Infrared Spectrograph (IRS) (Houck et al., 2004) on the Spitzer Space Telescope (Werner et al., 2004) as part of the GTO program ID 45. The AORkeys for IC 2448 are 4112128 (SL, SH, LH observed 2004 July 18), 4112384 (SL, SH, LH off positions observed 2004 July 18), and 12409088 (LL observed 2005 February 17). The data were taken in ‘staring mode’ which acquires spectra at two nod positions along each IRS slit. For the on target AORkeys (4112128 and 12409088), the telescope was pointed at RA = , DEC = (J2000.0). For the off target AORkey (4112384), the telescope was pointed at RA = , DEC = (J2000.0). Peak-up imaging was performed for AORkey 4112128, but not for the other AORkeys.
The data were processed through version s14.0 of the Spitzer Science Center’s pipeline. We begin our analysis with the unflatfielded (droopres) images to avoid potential problems in the flatfield. Then we run the irsclean111This program is available from the Spitzer Science Center’s website at http://ssc.spitzer.caltech.edu program to remove rogue and flagged pixels, using a mask of rogue pixels from the same campaign as the data. Next we remove the background. To do this we use the off positions for SL, SH, and LH; for LL we use the off order (for example, LL1 nod1 - LL2 nod1). The high resolution spectra (SH and LH) are extracted from the images using a scripted version of the SMART program (Higdon et al., 2004), using full-slit extraction. Due to the extended nature of IC 2448, the low resolution spectra (SL and LL) are extracted from the images manually in SMART using a fixed column extraction window of width 14.0 pixels () for SL and 8.0 pixels () for LL. The spectra are calibrated by multiplying by the relative spectral response function which is created by dividing the template of a standard star (HR 6348 for SL and LL, and Dra for SH and LH) by the spectrum of the standard star extracted in the same way as the source (Cohen et al. (2003); G. C. Sloan, private communication). Spikes due to deviant pixels missed by the irsclean program are removed manually.
The large aperture LH (11″.1 x 22″.3) and LL (10″.5 x 168″) slits are big enough to contain all of the flux from IC 2448. This is supported by the fact that the continuum flux from IC 2448 in LH matches that from LL with no scaling between them. However, the smaller aperture SH (4″.7 x 11″.3) and SL (3″.6 x 57″) slits are too small to contain the entire object. Thus we scale SL up to LL and SH up to LH. SL has a scaling factor of 2.30 and SH has a scaling factor of 3.00. No scaling factor is needed for orders within a module (for example, SL1, SL2, and SL3 all have the same scaling factor of 2.30). Additionally, there is no need of a scaling factor between the two nod positions.
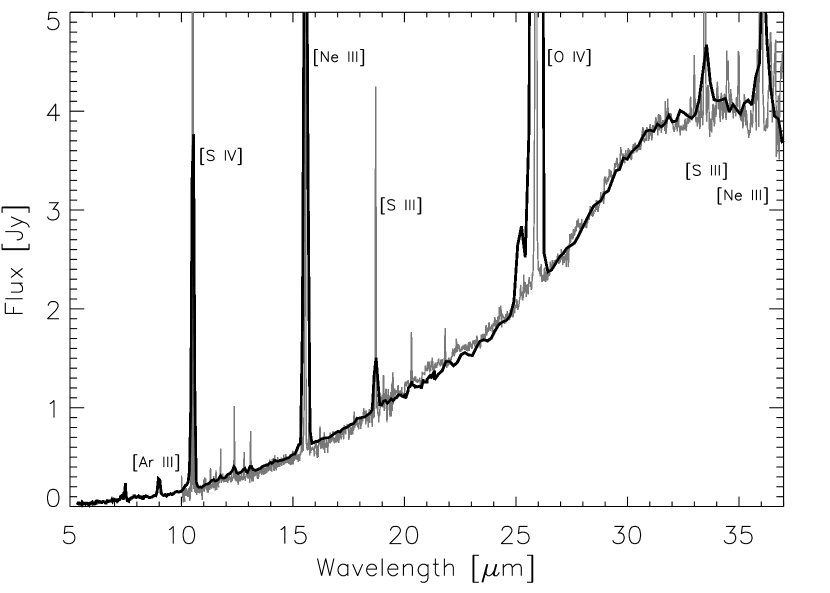
Figure 1 shows the average of the two nods of the Spitzer IRS spectrum of IC 2448. The peak of the continuum at 30 µm in Fλ units implies that the dust is cool, 100 K. No evidence of polycyclic aromatic hydrocarbons (PAHs) or silicate dust is seen in the spectrum. We see lines from ions of H, Ar, Ne, S and O in the IR spectrum of IC 2448. Close-ups of the lines in the high resolution Spitzer IRS spectrum of IC 2448 are shown in Figure 2. High ionization lines of [O IV] (ionization potential IP = 55 eV) and [Ar V] (IP = 60 eV) are observed, but even higher ionization lines such as [Ne V] (IP = 97 eV) and [Mg V] (IP = 109 eV) are not observed, indicating that there is only a moderately hard radiation field. Low ionization lines that would come from the photodissociation region (PDR) such as [Ar II] (IP = 16 eV) and [Si II] (IP = 8 eV) are not observed. A complete list of the observed lines and their fluxes is given in Table 1. The highest flux lines in the SH module (10.51 µm[S IV] and 15.55 µm[Ne III]) have bumps on each side of them that are instrumental artifacts, possibly resulting from internal reflection in the SH module or an effect of photon-responsivity. The bumps are just visible in Figure 2 for the [S IV] line. However, the bumps contain a negligible amount of flux – only 3% and 1% of the flux in the main [S IV] and [Ne III] lines respectively, and we did not include these small contributions in our line flux measurements.
The line fluxes are measured interactively in SMART for each nod position by performing a linear fit to the continuum on both sides of the line and then fitting a gaussian to the line. The values of the average line fluxes from both nod positions are given in Table 1. We estimate uncertainties in the line fluxes in two ways. In the first method, we propagate the uncertainties in the gaussian fit to the line flux to determine the uncertainty on the average flux from both nod positions. In the second method, we use the standard deviation of the fluxes measured in the two nod positions to determine the uncertainty on the average flux from both nod positions. We then take the final uncertainty as the greater of these two uncertainties. Lines fluxes typically have uncertainties 10%; lines with larger uncertainties ( 15% and 30%) are marked in Table 1. We determine 3 upper limits for lines not observed but relevant for the abundance analysis (denoted by a less-than sign in Table 1). Upper limits are obtained by calculating the flux contained in a gaussian with width determined by the instrument resolution and height equal to three times the root mean square (RMS) deviation in the spectrum at the wavelength of the line.

| (µm) | Line | FluxaaObserved flux in units of 10-14 erg cm-2 s-1. Flux uncertainties are 10% unless otherwise noted. | (µm) | Line | FluxaaObserved flux in units of 10-14 erg cm-2 s-1. Flux uncertainties are 10% unless otherwise noted. |
|---|---|---|---|---|---|
| 6.99 | [Ar II] | 13.9 | 14.32 | [Ne V] | 4.83 |
| 7.90 | [Ar V] | 25.7 | 15.55 | [Ne III] | 2080 |
| 8.99 | [Ar III] | 90.7 | 18.71 | [S III] | 103 |
| 10.51 | [S IV] | 1780 | 19.06 | H I(8-7) | 9.67ddFlux uncertainty 30%. |
| 11.30 | H I(9-7) | 12.0ccFlux uncertainty 15%. | 21.82 | [Ar III] | 6.74 |
| 12.37 | H I(7-6) + bbThe H I(7-6) and H I(11-8) lines are blended in the spectrum. | 30.5 | 24.30 | [Ne V] | 3.68 |
| 12.81 | [Ne II] | 10.7ccFlux uncertainty 15%. | 25.89 | [O IV] | 4280 |
| 13.10 | [Ar V] | 18.3ddFlux uncertainty 30%. | 33.47 | [S III] | 62.3 |
| 13.53 | [Mg V] | 4.36 | 36.01 | [Ne III] | 154 |
3. Optical and UV Data
We complement our IR line fluxes with optical and UV line fluxes in order to determine abundances. The optical and UV data provide line fluxes from ions not seen in the infrared spectrum (especially carbon and nitrogen). We obtain optical line fluxes from Milingo et al. (2002a). They observed IC 2448 with the 1.5 m telescope and Cassegrain spectrograph at the Cerro Tololo Inter-American Observatory in the Spring of 1997 using a 5 ″x 320″ slit. The slit width is about half of the diameter of IC 2448, and so Milingo et al. (2002a) missed some of the nebular flux. We assume that the optical lines measured in the small aperture are representative of the entire nebula of IC 2448 because IC 2448 has evenly distributed optical [N II] and [O III] line emission (Palen et al., 2002). The extinction corrected fluxes for the lines we use are listed in Table 2 as given by Milingo et al. (2002a). These authors report uncertainties in their line fluxes of 10% for their strong lines (with strengths H) and have flagged uncertainties of 25% and 50% for the weaker lines. These uncertainties are given in Table 2.
| (Å) | Line | FluxaaExtinction corrected flux relative to H=100. The H flux in the same aperture is 724.4 10-14 erg cm-2 s-1 (Milingo et al., 2002a). Flux uncertainties are 10% unless otherwise noted. | (Å) | Line | FluxaaExtinction corrected flux relative to H=100. The H flux in the same aperture is 724.4 10-14 erg cm-2 s-1 (Milingo et al., 2002a). Flux uncertainties are 10% unless otherwise noted. |
|---|---|---|---|---|---|
| 3727 | [O II] | 5.1bbFlux uncertainty 50%. | 6584 | [N II] | 1.0 |
| 3869 | [Ne III] | 103 | 6717 | [S II] | 0.1 |
| 4070 | [S II] | 1.1 | 6731 | [S II] | 0.1 |
| 4363 | [O III] | 16.4 | 7005 | [Ar V] | 0.1 |
| 4471 | He I | 3.3 | 7135 | [Ar III] | 4.8 |
| 4686 | He II | 40.3 | 7236 | [Ar IV] | 0.1ccFlux uncertainty 25%. |
| 4740 | [Ar IV] | 4.7 | 7264 | [Ar IV] | 0.1ccFlux uncertainty 25%. |
| 4959 | [O III] | 386 | 7323 | [O II] | 0.6 |
| 5007 | [O III] | 1173 | 7751 | [Ar III] | 1.2 |
| 5755 | [N II] | 0.1bbFlux uncertainty 50%. | 9069 | [S III] | 2.5 |
| 6312 | [S III] | 0.5 | 9532 | [S III] | 5.2 |
| 6436 | [Ar V] | 0.1bbFlux uncertainty 50%. |
High and low resolution large aperture International Ultraviolet Explorer (IUE) spectra of IC 2448 from the IUE Newly Extracted Spectra (INES) system are available on the web222The IUE INES system archive website is http://ines.vilspa.esa.es. The high resolution spectra we use are labeled SWP19067 and LWR15096, and the low resolution spectra we use are labeled SWP03194 and LWR02756. We use SMART to measure the line fluxes from the spectra, and the results are listed in Table 3. Uncertainties are obtained from the gaussian fit to each line and are 15% unless otherwise noted. The IUE large aperture (10″x 23″ ellipse) is big enough to contain essentially all of the flux from IC 2448, and no aperture scaling factor needs to be applied to the spectra.
| (Å) | Line | FluxaaObserved flux in units of 10-14 erg cm-2 s-1. Unless otherwise marked, all fluxes are from IUE low resolution spectra and have uncertainties of 15%. | (Å) | Line | FluxaaObserved flux in units of 10-14 erg cm-2 s-1. Unless otherwise marked, all fluxes are from IUE low resolution spectra and have uncertainties of 15%. |
|---|---|---|---|---|---|
| 1241 | N V | 8.86bbFlux from IUE high resolution spectra. | 1907 | C III] | 2250 |
| 1483 | N IV] | 58.5bbFlux from IUE high resolution spectra. | 2326 | C II] | 12.6b,cb,cfootnotemark: |
| 1548 | C IV | 1900 | 2422 | [Ne IV] | 184 |
| 1640 | He II | 2180 | 2471 | [O II] | 4.77b,db,dfootnotemark: |
| 1750 | N III] | 75.5 |
4. Data Analysis
Our goal is to calculate element abundances in IC 2448. In order to do this, we must first determine the extinction toward and physical conditions within the nebula. We iterate to find self-consistent solutions for the electron density and temperature. Then we use the derived values of extinction, electron density, and electron temperature to derive ionic abundances. Finally we sum the observed ionization stages of each element to derive total elemental abundances.
4.1. Extinction Correction
We calculate the amount of interstellar extinction in two ways. First, we compare the observed H flux for the whole nebula with the H flux predicted from infrared hydrogen recombination lines for case B recombination for a gas at Te = 10 000 K and Ne = 1000 cm-3 using the theoretical hydrogen recombination line ratios from Hummer & Storey (1987). The H I(7-6) and H I(11-8) are blended in the spectrum, and theoretically the H I(11-8) line should be 12.26% of the H I(7-6) line (Hummer & Storey, 1987); thus this amount is subtracted out before predicting the H flux from the H I(7-6) line. The results are shown in Table 4. Using the average predicted H flux from that table, and the total observed H flux of 1410 10-14 erg cm-2 s-1 (Acker et al., 1992), we obtain CHβ=0.33.
| (µm) | Line | aaObserved line flux in 10-14 erg cm-2 s-1. | bbPredicted H flux in 10-14 erg cm-2 s-1. |
|---|---|---|---|
| 11.30 | H I(9-7) | 12.0 | 3922 |
| 12.37 | H I(7-6) + ccFlux uncertainty 50%. | 30.5 | 2808 |
| 19.06 | H I(8-7) | 9.67 | 2336 |
| Average predicted H flux | 3022 |
The second method we use to determine the extinction is to compare the observed H flux to that predicted by the 6 cm radio flux using the following equation from Pottasch (1984):
where t is the electron temperature in 104 K and does the unit conversion so that is in Jy and F(H) is in erg cm-2 s-1. Using ionic helium abundances from §4.4, t=1.27, and = 0.089 0.008 Jy (Gregory et al., 1994), we predict that F(H) = 2345 10-14 erg cm-2 s-1, which gives CHβ= 0.22. This value is close to the value derived from the hydrogen recombination lines of CHβ=0.33.
We correct the IR and UV lines for extinction using the average of the results from our infrared hydrogen recombination line and radio predictions, CHβ= 0.27 (corresponding to EB V = 0.18) along with the extinction law from Fluks et al. (1994). We note that our value of the extinction is higher than in some previous studies. Milingo et al. (2002a) use the ratio of H/H to get CHβ= 0.09. Torres-Peimbert & Peimbert (1977) use Balmer line ratios to get CHβ= 0.15. Perhaps the short baselines used to measure extinction in those studies led to a low value of CHβ. In contrast, Kingsburgh & Barlow (1994) use radio data to predict H and get CHβ= 0.40. We use the extinction corrected optical line fluxes from Milingo et al. (2002a) as opposed to applying our own extinction correction to the observed fluxes because their extinction correction gives the correct Balmer decrement and corrects for calibration errors.
4.2. Electron Density
We assume an electron temperature (Te) of 12700 K to derive the electron density (Ne). We justify this choice of Te in §4.3; however, we use ratios of extinction corrected fluxes from pairs of lines of the same ion close in energy to derive the electron density, and these line ratios depend only slightly on Te, so an error in the adopted Te will not greatly affect the determination of Ne. The results of the density calculations are shown in Table 5. The S II density is unreliable because the lines used to determine it are weak (about 1/1000 of the H flux) and their ratio is in the non-linear regime of the line ratio versus density curve. The Ne III 15.55 µm/36.01 µm ratio is also in the non-linear regime and gives an imprecise density. The Ar III 8.99 µm/21.82 µm ratio is in the low density limit. We adopt a density of Ne = 1860 cm-3 derived from the S III line ratio as it provides the most accurate measurement of the density.
There is a wide range of values for Ne in the literature. For example, Torres-Peimbert & Peimbert (1977) give Ne from the intersection of [O II] and [N II] line ratios on a plot of Te vs Ne as 12000 cm-3 and Ne from the H flux as 1700 cm-3. Whereas Milingo et al. (2002b) give Ne = 10 cm-3 from the [S II] lines, which is an inaccurate density indicator in this case as discussed above. Finally Kingsburgh & Barlow (1994) give Ne = 490 cm-3 from the [Ar IV] 4711 Å/4740 Å lines, but those lines are weak (only 5% of the H flux), and the 4711 Å line is blended with He I, which makes the density derived from this line ratio unreliable. For the most part, abundances are not greatly affected by the adopted value of the density. For the range of densities for IC 2448 given in the literature (Ne = 10–12000 cm-3), all abundances are within 35% of their values for Ne = 1860 cm-3, except the sulfur abundance which is a factor of two larger at Ne = 12000 cm-3 than at Ne = 1860 cm-3.
| ion | lines used | Ioniz. Potential | Line Ratio | Ne |
|---|---|---|---|---|
| (µm) | (eV) | (cm-3) | ||
| S II | 0.6731/0.6717 | 10.36 | 1.00 | 781 |
| S III | 18.71/33.47 | 23.33 | 1.66 | 1860 |
4.3. Electron Temperature
We use extinction corrected fluxes from pairs of lines of the same ion widely separated in energy to derive the electron temperature (Te) assuming an electron density of Ne = 1860 cm-3. The results are shown in Table 6. It is possible to determine Te from pairs of ionic lines not in the table (e.g. N II 5755 Å/6584 Å and Ar V 7005 Å/13.10 µm); however, the Te determined from those ratios is not as accurate because one or both of the lines in each of those ratios is not high quality. We adopt Te = 12700 K from the average of the electron temperatures in the table. We use this value of the temperature in the subsequent abundance analysis. For comparison, Torres-Peimbert & Peimbert (1977) give T(O III) = 12500 K. Milingo et al. (2002b) give T(O III) = 12500 K, T(N II)=22400 K, and T(S III) = 25200 K; however, they deem the values of T(N II) and T(S III) unrealistic. Kingsburgh & Barlow (1994) give T(O III) = 11000 K. We note that there is no correlation of Te with ionization potential, although such a correlation has been noticed in some previous studies (e.g. Pottasch & Beintema (1999); Bernard-Salas et al. (2001)).
| ion | lines used | Ioniz. Potential | Line Ratio | Te |
|---|---|---|---|---|
| (µm) | (eV) | (K) | ||
| S III | 0.6312/18.71 | 23.33 | 0.125 | 13900 |
| Ar III | 0.7751/8.99 | 27.63 | 0.334 | 11500 |
| O III | 0.4363/0.5007 | 35.12 | 0.0140 | 13100 |
| Ne III | 0.3869/15.55 | 40.96 | 1.27 | 12400 |
4.4. Abundances
| Ion | (µm) | Nion/N | Nelem/N |
|---|---|---|---|
| He+ | 0.4471 | 0.060 | |
| He++ | 0.4686 | 0.034 | 0.094 |
| Ar+ aaAr+ may originate from the PDR (instead of the ionized region). However, it does not affect the total argon abundance because the upper limit is small compared to abundances of other argon ions. | 6.99 | 4.21 | |
| Ar++ | 8.99, 21.82 | 3.57 | |
| Ar3+ | 0.4740 | 7.73 | |
| Ar4+ | 13.10 | 1.82 | 1.15 |
| Ne+ | 12.81 | 5.24 | |
| Ne++ | 15.55 | 4.96 | |
| Ne3+ | 0.2422 | 1.41 | |
| Ne4+ | 24.30 | 1.31 | 6.42 |
| S++ | 18.71, 33.47 | 4.15 | |
| S3+ | 10.51 | 1.53 | 1.95 |
| O+ | 0.7323 | 2.82 | |
| O++ | 0.4363, 0.4959, 0.5007 | 2.10 | |
| O3+ | 25.89 | 3.86 | 2.51 |
| N+ | 0.6584 | 1.20 | |
| N++ | 0.1750 | 2.39 | |
| N3+ | 0.1483 | 3.09 | |
| N4+ bbN4+ probably originates from the star and thus it is not included in the total nitrogen abundance. | 0.1241 | 4.20 | 5.49 |
| C+ | 0.2326 | 2.09 | |
| C++ | 0.1907 | 1.64 | |
| C3+ | 0.1548 | 1.05 | 2.71 |
| Element | IC 2448 Abundances | SolarddFlux uncertainty 30%. | IC 2165eeIC 2165 abundances from Pottasch et al. (2004). | |||
| present | TPPaaTorres-Peimbert & Peimbert (1977) from optical data. | MbbMilingo et al. (2002b) from optical data. | KBccThe H I(7-6) and H I(11-8) are blended in the spectrum. The contribution of the H I(11-8) line is removed before predicting the Hβ flux (see §4.1). | |||
| He(-2) | 9.4 | 11 | 12 | 8.7 | 8.5 | 10 |
| Ar(-6) | 1.2 | … | 1.2 | 0.75 | 4.2 | 1.2 |
| Ne(-5) | 6.4 | 8.3 | 6.8 | 11 | 12 | 5.7 |
| S(-6) | 2.0 | … | 9.2 | 6.8 | 14 | 4.5 |
| O(-4) | 2.5 | 4.1 | 3.3 | 5.3 | 4.6 | 2.5 |
| N(-5) | 5.5 | 3.2 | 9.3 | 24 | 6.0 | 7.3 |
| C(-4) | 2.7 | … | … | 8.6 | 2.5 | 4.8 |
| C+N+O(-4) | 5.8 | … | … | 16 | 7.7 | 8.0 |
We use the Ne and Te given above together with the IR, optical, and UV extinction corrected line fluxes to determine the ionic abundances for ions of Ar, Ne, S, O, N, and C. The helium ionic abundances are calculated using emissivities in Benjamin et al. (1999). Then we sum the ionic abundances for all expected stages of ionization of an element to determine the abundance of that element. The S+ probably originates in the PDR because it has an IP of 10.4 eV; thus it is not included in the total sulfur abundance. The N4+ 1241 Å line probably originates from the star because no other ions with such large ionization potentials (IP = 77.7 eV) are observed; thus it is not included in the total nitrogen abundance.
The infrared spectrum enables us to observe lines of Ar4+, Ne+, S3+, and O3+ that are missing or weak in the combined optical and UV spectrum of IC 2448; and it additionally allows us to place upper limits on the amount of Ar+ and Ne4+. Observations of the S3+ and O3+ infrared lines are particularly important for determining accurate elemental abundances because those ionization stages contribute significantly to the total sulfur and oxygen elemental abundances respectively. The results for ionic and total element abundances are shown in Table 7. We do not need to apply an ionization correction factor (ICF) because we observe all ionization stages expected to have a significant contribution to the elemental abundances derived here.
One might expect S4+ to be present in the H II region because ions with higher ionization potentials are observed. However, a model of the PN Me 2-1, which has a star with similar temperature to IC 2448’s central star, indicates that the S4+ contribution to the total sulfur abundance is 15%. S4+ is not important because photons with enough energy to ionize S3+ to S4+ are absorbed by the more abundant ions of other elements that have similar ionization potentials (R. Surendiranath, private communication). We assume that the S4+ contribution to the total sulfur abundance is negligible, and so we do not use an ICF for sulfur.
5. Discussion
In Table 8 we compare the abundances we derive with those from previous works. Our helium, argon and neon abundances are all close to previous results. For the remaining elements, we discuss reasons why our results differ from previous ones below. The abundances of Ar, Ne, S, and O determined in this study should be more accurate and precise than in previous studies because we have used infrared lines that are less sensitive to temperature and extinction than optical and UV lines.
The sulfur abundance determined in this study is lower than previously reported. Milingo et al. (2002b) used an ICF of 39.18 to account for unseen S3+, and such a large ICF leads to a large uncertainty in their sulfur abundance result. Kingsburgh & Barlow (1994) used an ICF of 3.13 to account for unseen S2+ and S3+. Therefore, while we report a lower sulfur abundance than previous authors, it is more accurate because we observe both S2+ and S3+ in the IR spectrum and thus we do not need to use an ICF.
The oxygen abundance derived here is somewhat lower than given in former studies. This is mainly due to our use of the O3+ 25.89 µm line to determine the O3+ abundance, because the ICFs of previous studies overestimated the amount of O3+. We find that the O3+ abundance is only 15% of the total oxygen abundance, while ICFs used in previous studies assume that O3+ contributes between 42% and 57% of the total oxygen abundance.
The nitrogen and carbon abundances determined here and in previous studies are uncertain. The nitrogen abundances determined from the two optical studies have large uncertainties because the optical studies must use large ICFs (Torres-Peimbert & Peimbert (1977) use 33.9 and Milingo et al. (2002b) use 1279.69) to account for unseen N++, N3+, and N4+. This study and that of Kingsburgh & Barlow (1994) use UV lines for important ionization stages that dominate the element abundances of nitrogen and carbon. However, the ionic abundances determined from UV lines are very sensitive to the adopted electron temperature and extinction. For example, lowering (raising) the adopted Te by just 1000 K leads to an increase of 70% (decrease of 40%) in the derived nitrogen and carbon abundances. Lowering (raising) the adopted CHβ by 0.10 leads to up to a 30% decrease (increase) in the derived nitrogen and carbon abundances. We use a higher Te than Kingsburgh & Barlow (1994) (we use Te=12700 K and they use Te=11000 K), and we use a lower extinction (we use CHβ=0.27 whereas they use CHβ=0.40). Increasing the temperature and decreasing the extinction both have the effect of lowering the abundances derived from UV lines, causing the nitrogen and carbon element abundances derived in this study to be less than those derived by Kingsburgh & Barlow (1994).
The average of the Ar, Ne, and O abundances gives a metallicity of 0.45 Z☉, with an uncertainty of roughly 30%. These elements are left relatively unchanged during stellar evolution. Thus their low abundances imply that IC 2448’s progenitor star formed from metal deficient material, with a metallicity closer to that of the large magellanic cloud than to that of the sun. Sulfur is also left relatively unchanged during stellar evolution. However, many PNe have low sulfur abundances compared to solar, and so the sulfur abundance is not used in the average metallicity calculation. The sulfur abundance of IC 2448 is lower than the sulfur abundances of all 26 of the PNe studied by Pottasch & Bernard-Salas (2006), which supports the idea of a subsolar composition for IC 2448’s progenitor star. The abundance of helium derived here for IC 2448 is somewhat above solar, which implies that some chemical processing took place within IC 2448’s progenitor star. The nitrogen and carbon abundances are more uncertain, but close to solar.
Mendez et al. (1992) use their determinations of IC 2448’s stellar gravity (log g = 4.8) and effective temperature (Teff = 65000 K) to derive the current mass of IC 2448’s star as 0.58 M☉. This current stellar mass corresponds to an initial stellar mass of Mi 1 M☉ at a metallicity of Z = 0.5-1.0 Z☉ (Vassiliadis & Wood, 1993). This low stellar mass, along with the low metallicity of IC 2448’s progenitor star, imply that the first and perhaps the third dredge-up occurred.
First dredge-up would have increased the abundances of 4He, 14N, and 13C, decreased the abundance of 12C, and left the 16O abundance the same (Marigo et al., 2003). Second dredge-up (which increases 4He and 14N but decreases 12C, 13C, and 16O) is only expected to occur if the initial mass of the progenitor star is between 3 and 5 M☉ (Marigo et al., 2003), and so it is not expected to occur here. Third dredge-up, which significantly increases 4He and 12C and slightly increases the amounts of some other elements (Marigo et al., 2003), might have occurred. It is expected to occur in stars that have M 1.5 M☉ at Z = Z☉, but this limit is at lower masses for lower Z (Marigo et al., 1999). Third dredge-up enriches the amount of carbon relative to oxygen, and thus a C/O ratio greater than one would indicate that third dredge-up occurred (Iben & Renzini, 1983).
The C/O ratio in IC 2448 derived here is 1.1, but the carbon abundance of IC 2448 is very uncertain as discussed above. Thus we cannot determine if the C/O ratio is really greater or less than one. The IR spectrum of IC 2448 (Figure 1) does not show PAHs which are often observed in PNe with C/O 1, nor does it show silicates which are often observed in PNe with C/O 1 (Zuckerman & Aller, 1986; Bernard-Salas & Tielens, 2005). The uncertainty in our carbon abundance and the lack of PAHs and silicates in the IR spectrum do not allow us to determine if IC 2448 is carbon-rich or oxygen-rich.
The abundances of IC 2448 are close to the abundances of PN IC 2165 which is a spherical nebula with a low mass ( 3 M☉) progenitor star (Pottasch et al., 2004). IC 2165 probably experienced third dredge-up (in addition to first dredge-up) because it has C/O 2 (Pottasch et al., 2004). The elements not much affected by the various dredge-up episodes (Ar, Ne, S, and O) all have subsolar values in IC 2448 and IC 2165, which implies that the progenitor stars of these nebula were created from metal deficient gas.
The IR continuum of IC 2448 gives a cool dust temperature of 100 K, supporting previous studies that show IC 2448 to be an old, evolved nebula. Additionally, IR lines that would come from the photodissociation region such as [Ar II] and [Si II] are not observed. Perhaps this indicates that most of the photodissociation region has been destroyed, which fits the picture of IC 2448 being an old PN where the ionization front has gobbled up most of the photodissociation region.
6. Conclusions
This is the first mid-IR spectral study of IC 2448. The abundance of helium is slightly above solar, indicating that some chemical enrichment has occurred. The high uncertainties in the nitrogen and carbon abundances (due to their reliance on abundances determined from UV lines which depend strongly on the electron temperature and to a lesser extent on the extinction) make it difficult to determine how much chemical enrichment occurred. The elements not affected much by stellar evolution (Ar, Ne, S, and O) all have subsolar values in IC 2448, indicating that the progenitor star formed out of somewhat metal deficient material. Our use of infrared ionic lines which are less sensitive to extinction and temperature, and some of which arise from ions with no observable lines in the optical or UV, leads to a more accurate determination of abundances for Ar, Ne, S, and O than previously possible. The abundances determined fit with the picture of IC 2448 having a low mass progenitor star that underwent first and perhaps third dredge-up. The IR continuum gives a cool dust temperature of 100 K, supporting previous studies that show IC 2448 to be an old, evolved nebula. Additionally, lines that would arise from the PDR are missing or weak, indicating that much of the PDR is destroyed, consistent with IC 2448 being an old PN.
References
- Acker et al. (1992) Acker, A., Marcout, J., Ochsenbein, F., Stenholm, B., & Tylenda, R. 1992, Strasbourg - ESO catalogue of galactic planetary nebulae. Part 1; Part 2 (Garching: European Southern Observatory)
- Asplund et al. (2005) Asplund, M., Grevesse, N., & Sauval, A. J. 2005, in ASP Conf. Ser. 336: Cosmic Abundances as Records of Stellar Evolution and Nucleosynthesis, ed. T. G. Barnes, III & F. N. Bash, 25
- Benjamin et al. (1999) Benjamin, R. A., Skillman, E. D., & Smits, D. P. 1999, ApJ, 514, 307
- Bernard-Salas et al. (2001) Bernard-Salas, J., Pottasch, S. R., Beintema, D. A., & Wesselius, P. R. 2001, A&A, 367, 949
- Bernard-Salas & Tielens (2005) Bernard-Salas, J. & Tielens, A. G. G. M. 2005, A&A, 431, 523
- Cohen et al. (2003) Cohen, M., Megeath, S. T., Hammersley, P. L., Martín-Luis, F., & Stauffer, J. 2003, AJ, 125, 2645
- Feldman & Widing (2003) Feldman, U. & Widing, K. G. 2003, Space Science Reviews, 107, 665
- Fluks et al. (1994) Fluks, M. A., Plez, B., The, P. S., de Winter, D., Westerlund, B. E., & Steenman, H. C. 1994, A&AS, 105, 311
- Gregory et al. (1994) Gregory, P. C., Vavasour, J. D., Scott, W. K., & Condon, J. J. 1994, ApJS, 90, 173
- Higdon et al. (2004) Higdon, S. J. U. et al. 2004, PASP, 116, 975
- Houck et al. (2004) Houck, J. R. et al. 2004, ApJS, 154, 18
- Hummer & Storey (1987) Hummer, D. G. & Storey, P. J. 1987, MNRAS, 224, 801
- Iben & Renzini (1983) Iben, Jr., I. & Renzini, A. 1983, ARA&A, 21, 271
- Kaler (1985) Kaler, J. B. 1985, ARA&A, 23, 89
- Kerber et al. (2003) Kerber, F., Mignani, R. P., Guglielmetti, F., & Wicenec, A. 2003, A&A, 408, 1029
- Kingsburgh & Barlow (1994) Kingsburgh, R. L. & Barlow, M. J. 1994, MNRAS, 271, 257
- Kwok (2000) Kwok, S. 2000, The Origin and Evolution of Planetary Nebulae (Cambridge Astrophysics Series, Vol. 33; Cambridge, New York: Cambridge University Press)
- Marigo et al. (2003) Marigo, P., Bernard-Salas, J., Pottasch, S. R., Tielens, A. G. G. M., & Wesselius, P. R. 2003, A&A, 409, 619
- Marigo et al. (1999) Marigo, P., Girardi, L., & Bressan, A. 1999, A&A, 344, 123
- McCarthy et al. (1990) McCarthy, J. K., Mould, J. R., Mendez, R. H., Kudritzki, R. P., Husfeld, D., Herrero, A., & Groth, H. G. 1990, ApJ, 351, 230
- Mellema (2004) Mellema, G. 2004, A&A, 416, 623
- Mendez et al. (1992) Mendez, R. H., Kudritzki, R. P., & Herrero, A. 1992, A&A, 260, 329
- Milingo et al. (2002a) Milingo, J. B., Kwitter, K. B., Henry, R. B. C., & Cohen, R. E. 2002a, ApJS, 138, 279
- Milingo et al. (2002b) Milingo, J. B., Henry, R. B. C., & Kwitter, K. B. 2002b, ApJS, 138, 285
- Palen et al. (2002) Palen, S., Balick, B., Hajian, A. R., Terzian, Y., Bond, H. E., & Panagia, N. 2002, AJ, 123, 2666
- Pottasch (1984) Pottasch, S. R. 1984, Planetary Nebulae - A Study of Late Stages of Stellar Evolution (Astrophysics and Space Science Library, Vol. 107; Dordrecht: D. Reidel Publishing Company)
- Pottasch & Beintema (1999) Pottasch, S. R. & Beintema, D. A. 1999, A&A, 347, 975
- Pottasch & Bernard-Salas (2006) Pottasch, S. R. & Bernard-Salas, J. 2006, A&A, 457, 189
- Pottasch et al. (2004) Pottasch, S. R., Bernard-Salas, J., Beintema, D. A., & Feibelman, W. A. 2004, A&A, 423, 593
- Rubin et al. (1988) Rubin, R. H., Simpson, J. P., Erickson, E. F., & Haas, M. R. 1988, ApJ, 327, 377
- Torres-Peimbert & Peimbert (1977) Torres-Peimbert, S. & Peimbert, M. 1977, Revista Mexicana de Astronomia y Astrofisica, 2, 181
- Tylenda et al. (2003) Tylenda, R., Siódmiak, N., Górny, S. K., Corradi, R. L. M., & Schwarz, H. E. 2003, A&A, 405, 627
- Vassiliadis & Wood (1993) Vassiliadis, E. & Wood, P. R. 1993, ApJ, 413, 641
- Werner et al. (2004) Werner, M. W. et al. 2004, ApJS, 154, 1
- Zuckerman & Aller (1986) Zuckerman, B. & Aller, L. H. 1986, ApJ, 301, 772