Discovery of Very High Energy -ray emission from the Low-frequency peaked BL Lacertae object BL Lacertae
Abstract
The MAGIC collaboration observed BL Lacertae for 22.2 hr during 2005 August to December and for 26 hr during 2006 July to September. The source is the historical prototype and eponym of a class of low-frequency peaked BL Lacertae (LBL) objects. A very high energy (VHE) -ray signal was discovered with a 5.1 excess in the 2005 data. Above 200 GeV, an integral flux of was measured, corresponding to approximately 3% of the Crab flux. The differential spectrum between 150 and 900 GeV is rather steep with a photon index of . The light curve shows no significant variability during the observations in 2005. For the first time a clear detection of VHE -ray emission from an LBL object was obtained with a signal below previous upper limits. The 2006 data show no significant excess. This drop in flux follows the observed trend in optical activity.
Subject headings:
BL Lac objects: individual (BL Lacertae) – gamma rays: observations1. Introduction
BL Lacertae (1ES2200+420, =0.069, Miller et al. 1978) is the historical prototype of a class of powerful -ray emitters: ”BL Lac objects”. It belongs to an active galactic nucleus (AGN) subclass in which the jet is aligned very close to our line of sight. The mass of the supermassive black hole in the center is estimated to be (Wu et al., 2002). Electromagnetic emission from this class of sources can be observed from the radio up to very high energy (VHE) -rays 100 GeV), with spectral energy distributions (SEDs) characterized by a two-bump structure. So far, most of the measured SEDs could be interpreted using scenarios of a simple leptonic origin. The lower energy bump is produced by synchrotron radiation of relativistic electrons, while the higher energy bump originates from inverse Compton (IC) scattering of the same electron population accelerated in the jet. The target photons for IC scattering could be either synchrotron photons (synchrotron self-Compton scattering, SSC) or external photons either from the broad-line emission region or from the accretion disc (external inverse Compton scattering, EC). If both photon populations contribute to the IC emission, the corresponding IC component may have a double local-peak structure (e.g. Ghisellini et al., 1998). When the synchrotron emission peak is located in the sub-millimeter to optical band, the objects are classified as ”Low-frequency peaked BL Lacs” (LBLs), whereas in ”High-frequency peaked BL Lacs” (HBLs) the synchrotron peak is located at UV to X-ray energies (Padovani & Giommi, 1995; Fossati et al., 1998). BL Lac objects often show a strong flux variability down to timescales of a few minutes for the highest energy range (Gaidos et al., 1996; Albert et al., 2007c). It should be noted that other models, based e.g. on the acceleration of hadrons (Mannheim, 1993; Mücke & Protheroe, 2001), could also explain the SEDs of BL Lac objects.
Up to now, there are 13 well-established extra-galactic VHE -ray sources. Twelve are classified as HBL and one is the Fanaroff-Riley class I radio galaxy, M87. BL Lacertae is classified as an LBL object with a synchrotron peak frequency of Hz (Sambruna et al., 1999), and is one of the best-studied objects in the various energy bands. In 1998 and 2001, VHE -ray detection of the LBLs 3C66A and BL Lacertae were claimed (Neshpor et al., 1998, 2001). Subsequent observations with more sensitive instruments have not, however, revealed any evidence for VHE -ray emission consistent with these claims. No VHE -ray emission from any LBLs has previously been confirmed.
Villata et al. (2004) have presented long-term light curves in optical and radio emission over 30 years and reported cross-correlation between the optical light curve and radio hardness ratio with some delay in radio emission. They have claimed evidence of an 8 yr periodicity in radio but less evidence in optical. Several authors (e.g. Hagen-Thorn et al., 1997; Stirling et al., 2003) have also reported periodic and quasi-periodic variations in the optical and radio light curves.
Gamma-ray observations by EGRET resulted only in an upper limit of 1.4 10-7 until 1995. Later, EGRET observed -rays above 100 MeV at a flux level of (4.0 with 4.4 significance (Catanese et al., 1997). During an optical outburst in 1997, a -ray flare was measured with 10 significance by EGRET at a flux level of (1.720.42) 10-6 , 12 times higher than the previous upper limit (Bloom et al., 1997). The EC, in which the broad-line emission flux has been Comptonized, has been suggested for the interpretation of the -ray emission in the 1997 flare (e.g. Madejski et al., 1999; Ravasio et al., 2002).
In the VHE -ray range, the Crimean Observatory has claimed a detection with 7.2 significance (Neshpor et al., 2001), while HEGRA, observing in the same period, obtained only a much lower upper limit (Kranich, 2003, see details in Discussion). Other past observations of this target resulted in upper limits only (Catanese et al., 1997; Kranich, 2003; Aharonian et al., 2004; Horan et al., 2004).
In this Letter we report about the discovery of VHE -ray emission from BL Lacertae in 2005. Simultaneous observation in the optical band in 2005 and 2006 permitted a search for correlations between the optical and VHE -ray activities.
2. Observations and Data Analysis
BL Lacertae (R.A., decl.; J2000.0) was observed with the 17m diameter MAGIC (Major Atmospheric Gamma Imaging Cerenkov) telescope on the Canary Island of La Palma (N28.2∘, W17.8, 2225 m a.s.l.). The MAGIC telescope is the world’s largest Imaging Atmospheric Cerenkov Telescope (IACT). The telescope parameters and performance are described in Baixeras et al. (2004) and Cortina et al. (2005). The source was observed for 22.2 hr from 2005 August until December. The telescope was pointing directly onto the object, recording so-called ON data. The background was estimated from observations of regions where no -rays are expected, which we define as OFF data, which were taken with sky conditions similar to those of ON data.
The raw data were first calibrated (Gaug et al., 2005), and then processed with the standard MAGIC analysis and reconstruction software (Bretz et al., 2005). Data runs with anomalous trigger rates due to bad observation conditions were rejected from further analysis. The remaining ON data corresponded to 17.8 hr, while the OFF data corresponded to 57.2 hr. Image parameters of the raw data (Hillas, 1985) were calculated and compared for the ON and OFF data in order to check their consistency; excellent agreement was found. The selected data samples before the /hadron separation are completely dominated by hadron events and the expected admixture of -ray events are below the statistical fluctuations of the data.
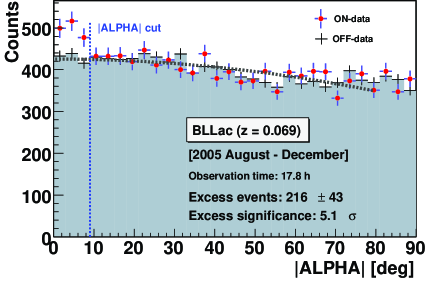
In order to reject most hadronic background while still conserving the majority of the -candidates, a multi-tree classifier algorithm based on the ”Random Forest (RF)” method (Breiman, 2001; Bock et al., 2004) was used for the /hadron separation. The selection conditions were trained with Monte Carlo simulated -ray samples (Knapp & Heck, 2004; Majumdar et al., 2005) and a sample of experimental background events. In the RF method for each event the so-called HADRONNESS parameter (H) was calculated from a combination of all the image parameters except the ALPHA parameter. ALPHA is the angle between the shower image principal axis and the line connecting the image center of gravity with the camera center. H assigns to each event a number between 0 and 1 of being more hadron-like (high H) or -ray like (low H values). The selection of events with low H value enriches -ray events in the surviving data sample. Finally, the image parameter ALPHA was calculated and the ALPHA distribution for the ON and OFF data compared after normalizing them on the area between and . Any -ray signal should show up as an excess at small ALPHA values. The number of background events in the ON distribution at small ALPHA was determined by a second order polynomial fit (without linear term) to the ALPHA distribution of the normalized OFF data. For our analysis we used an ALPHA cut of (see also Albert et al., 2006, 2007a, 2007b).
The cuts in H and ALPHA were optimized using data samples from Crab Nebula observations at comparable zenith angles. The significance of an excess visible in the ALPHA distribution was calculated according to Eq.17 in Li & Ma (1983). The energy of the -ray events was also reconstructed by means of the RF method with MC -samples. The average energy resolution is estimated to be about 24% rms.
Optical -band observations were provided by the Tuorla Observatory Blazar Monitoring Program111more information at http://users.utu.fi/kani/1m/ with the 1.03 m telescope at the Tuorla Observatory, Finland, and the 35 cm KVA telescope on La Palma, Canary Islands. The magnitudes were then converted to linear fluxes using formula F[Jy] .
Radio observations were also performed with UMRAO222UMRAO is partially supported by a series of grants from the NSF and by funds from the University of Michigan. at 4.8, 8.0 and 14.5 GHz, and at 37 GHz with the Metsähovi Radio Observatory.
3. Results
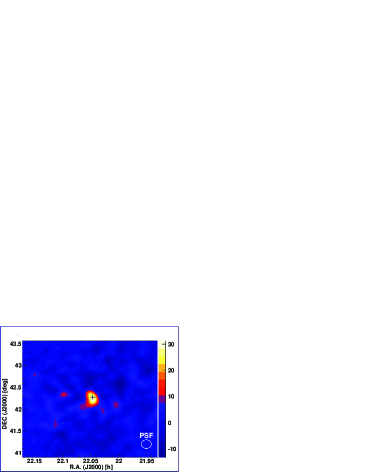
Figure 1 shows the local sky map for the 2005 -ray candidates using the DISP method (Lessard et al., 2001). Only events 350 photo-electrons were used, corresponding to an energy threshold of about 200 GeV -ray energy. The map was produced from the excess events distribution smoothed with a 2-D Gaussian of . The black cross marks the nominal position of BL Lacertae. The small offset and the extension of the image are comparable to the telescope point spread function (PSF, ) and the telescope pointing error ().
In Figure 2, the ALPHA distribution is shown. An excess of 216 events over 1275.6 normalized background events yields a significance of 5.1 for data above 350 photo-electrons. Two mostly independent analyses confirmed the result.
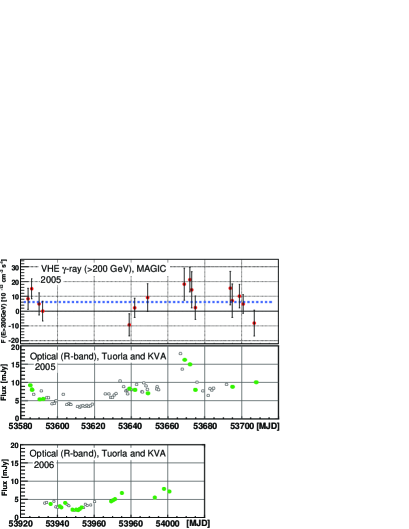
The 2005 VHE -ray and the 2005 and 2006 optical light curves are shown in Figure 3. No significant evidence of flux variability in VHE -rays was found in the 2005 data. The derived average integral flux is , which corresponds to about 3% of the Crab Nebula flux as measured by the MAGIC telescope (Wagner et al., 2005). In the optical light curve, the contribution from the host galaxy (1.38 mJy) was subtracted. The optical light curve shows a flare around the end of 2005 October (MJD 53,670). Also radio light curves at 37 GHz (A. Lähteemäki 2006, private communication) and 14.5 GHz (UMRAO) suggest some minor flaring activity starting in 2005 November.
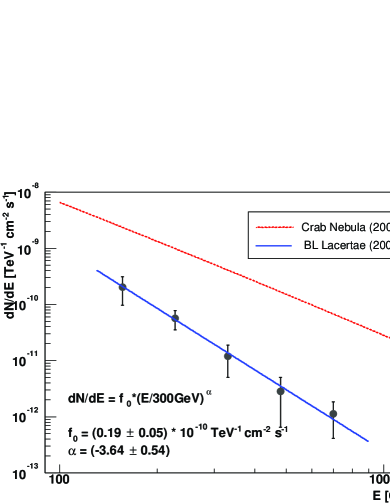
The reconstructed differential energy spectrum (Fig. 4) is well described by a simple power law:
Because of the relatively steep slope, the systematic errors are estimated to be 50% for the absolute flux level and 0.2 for the spectral index.
Follow-up observations were carried out from 2006 July to September for 26.0 hr, using the so-called wobble mode (Daum et al., 1997), where the object was observed at an offset from the camera center; 25.0 hr of the data passed all quality selection for the analysis. The DISP method was applied for the reconstruction of the shower direction with the final cut on the parameter (the squared angular distance between the nominal source position and the reconstructed -ray direction). However, no significant excess could be found in the 2006 data.
4. Discussion
The Whipple 10 m telescope observed BL Lacertae for 39.1 hr in 1995 and derived a flux upper limit above 350 GeV at 3.8% of Crab (Horan et al., 2004). HEGRA derived an upper limit above 1.1 TeV at 28% of Crab with 26.7 hr observation (Aharonian et al., 2004). These upper limits are consistent with our results. On the other hand, Neshpor et al. (2001) claim VHE -ray detection using the GT 48 telescopes of the Crimean Astrophysical Observatory from data taken in summer 1998. The reported integral -ray flux is , which is two orders of magnitude higher than the extrapolated value from this study. During the same period, 1998 July to August, no significant signal was found by HEGRA, and their reported flux upper limit in the same energy band is 7 times lower than the Crimean result (Kranich, 2003). The VHE -ray detection reported by Neshpor et al. cannot be explained without a remarkably huge and a very rapid flux variation offset by a few hours in consecutive nights from the HEGRA observation. In the case of a leptonic origin of the -ray emission, such a flare would possibly coincide with high activity in the optical as in the outburst of 1997 July, when the increase in flux was observed both in the optical and X-ray to -ray bands (Bloom et al., 1997; Tanihata et al., 2000). However, no increased optical activity was detected during the Crimean observation period (, while in 2005). Throughout the EGRET observations for BL Lacertae, such a notably huge and rapid flare feature was never reported in the high energy -ray emission, which is considered to have the same origin as the VHE -ray emission regardless of the scenarios for the emission origin.
In Figure 3, filled circles in the optical light curve represent simultaneous observations with the MAGIC telescope, accepting a 1 day offset with respect to the MAGIC observations. In 2005, there are 12 out of 16 nights with simultaneous observations (average flux: 9.2 mJy), while 16 out of 23 nights in 2006 (average flux: 4.2 mJy) have coinciding observations. The absence of a significant excess of VHE -rays in the 2006 data indicates that the VHE -ray flux in 2006 was significantly lower than the flux level in 2005. In summary our results show similar tendencies both in the optical and the VHE -ray flux variations. Similarly, the -ray activity seen by EGRET observations in 1997 showed a strong correlation with optical activity. Such a correlation is expected from leptonic origin scenarios (Bloom et al., 1997). Details of the 2006 data and radio data will be discussed elsewhere.
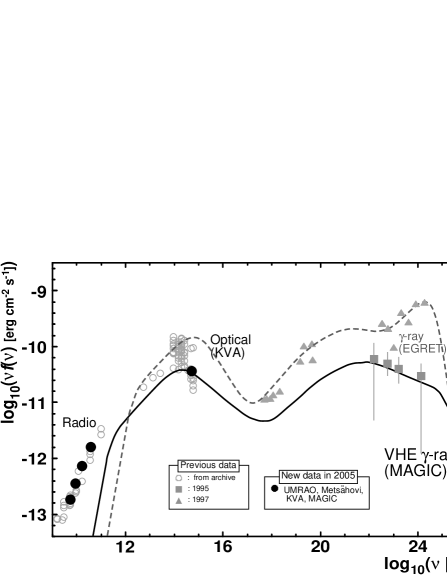
Figure 5 shows the SED of BL Lacertae with results of this work and some previous data and model calculations by Ravasio et al. (2002). The VHE -ray points are corrected for the extra-galactic background light (EBL) absorption using the ”Low” EBL model of Kneiske et al. (2004). Our optical and VHE -ray points agree well with the solid line, which was derived using a one-zone SSC model on the 1995 data, whereas some deviations can be seen from the dotted line, which describes the 1997 flare data and involves SSC as well as EC components (Ravasio et al., 2002). To describe our result such an additional EC component is not necessarily required.
BL Lacertae is the first LBL object with a clear detection of VHE -ray emission. The results of this work indicate that VHE -ray observations during times of higher optical states can be more efficient. Future long term monitoring of VHE -ray emission could provide detailed information of a possible periodicity predicted by e.g. Stirling et al. (2003) and correlations with other wavelengths. Due to the observed steep spectrum, lowering the energy threshold of IACTs (e.g. the upcoming MAGIC-II project) would significantly increase the detection prospects for this new source class.
References
- Aharonian et al. (2004) Aharonian, F., et al. 2004, A&A, 421, 529
- Albert et al. (2006) Albert, J., et al. 2006, ApJ, 639, 761
- Albert et al. (2007a) Albert, J., et al. 2007a, ApJ, 654, L119
- Albert et al. (2007b) Albert, J., et al. 2007b, ApJ, 663, 125
- Albert et al. (2007c) Albert, J., et al. 2007c, ApJ, in press (astro-ph/0702008)
- Baixeras et al. (2004) Baixeras, C., et al. 2004, Nucl. Instrum. Methods Phys, Res. A, 518, 188
- Bloom et al. (1997) Bloom, S. D., et al. 1997, ApJ, 490, L145
- Bock et al. (2004) Bock, R., et al. 2004, Nucl. Instrum. Methods Phys, Res. A, 516, 511
- Breiman (2001) Breiman, L. 2001, Machine Learning, 45, 5
- Bretz et al. (2005) Bretz, T., et al. 2005, AIP Conf. Proc. 745, High-Energy Gamma-Ray Astro- nomy, ed. F. A. Aharonian, H. J. Völk, & D. Horns (New York: AIP), 730
- Catanese et al. (1997) Catanese, M., et al. 1997, ApJ, 480, 562
- Cortina et al. (2005) Cortina, J., et al. 2005, Proc. 29th Int. Cosmic Ray Conf. (Pune), 5, 359
- Daum et al. (1997) Daum, A., et al. 1997, AstroPart. Phys., 8, 1
- Fossati et al. (1998) Fossati, G., Maraschi, L., Celotti, A., Comastri, A., & Ghisellini, G. 1998, MNRAS, 299, 433
- Gaidos et al. (1996) Gaidos, J., et al. 1996, Nature, 383, 319
- Gaug et al. (2005) Gaug, M., et al. 2005, Proc. 29th Int. Cosmic Ray Conf. (Pune), 5, 375
- Ghisellini et al. (1998) Ghisellini, G., Celotti, A., Fossati, G., Maraschi, L., & Comastri, A. 1998, MNRAS, 301, 451
- Hagen-Thorn et al. (1997) Hagen-Thorn, V. A., Marchenko, S. G., Mikolaichuk, O. V., & Yakovleva, V. A. 1997, Astronomy Report, 41, 154
- Hillas (1985) Hillas, A. M. 1985, Proc. 29th Int. Cosmic Ray Conf. (La Jolla), 3, 445
- Horan et al. (2004) Horan, D., et al. 2004, ApJ, 603, 51
- Knapp & Heck (2004) Knapp, J., & Heck, D. 2004, EAS Simulation with CORSIKA: A User’s Guide (Karlsruhe: Inst. Kernphysik)
- Kneiske et al. (2004) Kneiske, T. M., Bretz, T., Mannheim, K., & Hartman, D. H. 2004, A&A, 413, 807
- Kranich (2003) Kranich, D. (HEGRA collaboration) 2003, ASP Conf. Proc., Vol. 299, High Energy Blazar Astronomy, ed. L. O. Takalo & E. Valtaoja (San Francisco: ASP), 3
- Lessard et al. (2001) Lessard, R. W., Buckley, J. H., Connaughton, V., & Le Bohec, S. 2001, Astropart. Phys., 15, 1
- Li & Ma (1983) Li, T.-P., & Ma, Y.-Q. 1983, ApJ, 272, 317
- Madejski et al. (1999) Madejski, G. M., Sikora, M., Jaffe, T., Blazejowski, M., Jahoda, K., & Moderski., R. 1999, ApJ, 521, 145
- Majumdar et al. (2005) Majumdar, P., et al. 2005, Proc. 29th Int. Cosmic Ray Conf. (Pune), 5, 203
- Mannheim (1993) Mannheim, K. 1993, A&A, 269, 76
- Miller et al. (1978) Miller, J. S., French, H. B., & Hawley, S. A. 1978, ApJ, 219, L85
- Mücke & Protheroe (2001) Mücke, A., & Protheroe, R. J. 2001, AsrtoPart. Phys., 15, 121
- Neshpor et al. (1998) Neshpor, Y. I., et al. 1998, Astron. Lett., 24, 134
- Neshpor et al. (2001) Neshpor, Y. I., et al. 2001, Astron. Rep., 45, 249
- Padovani & Giommi (1995) Padovani, P. & Giommi, P. 1995, ApJ, 444, 567
- Ravasio et al. (2002) Ravasio, M., et al. 2002, A&A, 383, 763
- Sambruna et al. (1999) Sambruna, R. M., Ghisellini, G., Hooper, E., Kollgaard, R. I., Pesce, J. E., & Urry, C. M. 1999, ApJ, 515, 140
- Stirling et al. (2003) Stirling, A. M., et al. 2003, MNRAS, 341, 405
- Tanihata et al. (2000) Tanihata, C., et al. 2000, ApJ, 543, 124
- Villata et al. (2004) Villata, M., et al. 2004, A&A, 424, 497
- Wagner et al. (2005) Wagner, R. M., et al. 2005, Proc. 29th Int. Cosmic Ray Conf. (Pune), 4, 163
- Wu et al. (2002) Wu, X.-B., Liu, F.-K., & Zhang, T.-Z. 2002, A&A, 389, 742