Quasar 3C298: a test-case for meteoritic
nanodiamond 3.5 \mic emission
Abstract
Aims. We calculate the dust emission expected at 3.43 and 3.53 \mic if meteoritic (i.e. hydrogenated) nanodiamonds are responsible for most of the far-UV break observed in quasars.
Methods. We integrate the UV flux that hydrogenated nanodiamonds must absorb to reproduce the far-UV break. Based on laboratory spectra of H-terminated diamond surfaces, we analyse the radiative energy budget and derive theoretically the IR emission profiles expected for possible CH surface stretch modes of the diamonds.
Results. Using as test case a spectrum of 3C298 provided by the Spitzer Observatory, we do not find evidence of these emission bands.
Conclusions. While diamonds without surface adsorbates remain a viable candidate for explaining the far-UV break observed in quasars, hydrogenated nanodiamonds appear to be ruled out, as they would give rise to IR emission bands, which have not been observed so far.
Key Words.:
galaxies: active – ISM: dust, extinction – infrared: galaxies – ultraviolet: galaxies – quasars: individual: 3C2981 Introduction
The spectral energy distribution (SED) of quasars is composed of emission lines superimposed on various continuum emission components. The optical to near-infrared domain is reasonably well reproduced by a power law. The far-infrared and ultraviolet spectral regions are both characterised by a broad continuum excess with respect to the optical-IR power law. The UV flux excess is referred to as the big blue bump (BBB). According to general belief, it corresponds to the thermal signature from a hot accretion disk orbiting a supermassive black hole. The extension in the extreme UV of the BBB is expected to provide the ionising flux that powers most of the emission lines.
A serious problem with this picture, however, is that the BBB observed in quasars appears to be too soft to account for the high excitation lines from the broad emission line region (BELR) (see Korista et al. 1997). In effect, a marked continuum drop or steepening takes place shortward of Å, which we hereafter term the far-UV break. This break is observed in the composite quasar SED derived by Telfer et al. (2002), as well as in individual spectra of quasars with (Binette et al. 2005, hereafter B05). A possibility might be that this break is more akin to a localised continuum trough, followed by a marked recovery in the extreme UV, which is the energy region responsible for the high-excitation emission lines. Various mechanisms that could generate such a trough are summarised by Binette et al. (2007). State-of-the-art calculations of the SED for standard geometrically-thin, optically-thick accretion disks do not reproduce the observed break satisfactorily, but these models assume a stationary disk with a vertical structure supported only by gas and radiation pressure. To our knowledge, no detailed SED calculations have been carried out assuming a non-stationary disk or with an accelerating wind. Absorption by intergalactic H i and by intergalactic dust has been discarded by Binette et al. (2003) and B05, respectively. Eastman et al. (1983) proposed that H i absorption by local clouds that are accelerated up to 0.8 could generate a steepening of the transmitted continuum. To reproduce modern data, this model would need to be fine-tuned and extended to the extreme UV where the flux recovery is expected. More recently, B05 propose that the break could be the result of absorption by crystalline dust grains local to the quasars. They successfully reproduced the position and detailed shape of the UV break in 50 quasars, out of a total sample of 61 objects from HST-FOS archives whose spectra extended down to at least 900 Å (rest-frame). Their model required two flavours of crystallites: nanodiamonds without surface adsorbates and nanodiamonds with surface adsorbates as found in most measurements of meteoritic nanodiamonds from primitive carbonaceous chondrite meteorites; see Mutschke et al. (2004, hereafter MA04) and references therein, and also Jones et al. (2004, hereafter JH04). If the far-UV break is due to dust absorption, we expect to observe the infrared (IR) re-emission corresponding to the absorbed energy. This is not a straightforward test in the case of pure cubic diamonds, since only multi-phonon modes are active in the IR (JH04; Braatz et al. 2000; Edwards 1985). However, impurities or structural defects can enable one-phonon modes to become active (Andersen et al. 1998; Jones & d’Hendecourt 2000).
Guillois et al. (1999) and Van Kerckhoven et al. (2002, hereafter VK02) make a convincing case for the detection of hydrogenated nanodiamonds within circumstellar media for which the CH stretch emission bands at 3.43 \mic and 3.53 \mic were observed111Pure diamonds are extremely inefficient emitters compared to the one-phonon mode provided by vibrational modes of carbon bonds with H atoms, which populate the surface of meteoritic nanodiamonds. Therefore, considering only one-phonon modes for the cooling of the grains is considered an acceptable approximation.. As laboratory measurements of meteoritic nanodiamonds have shown them to be surface H-terminated (Lewis et al. 1989; Hill et al. 1997; Andersen et al. 1998; Braatz et al. 2000, MA04), we can test their presence by using a method similar to VK02. We adopt the spectra of the quasar 3C298 as an example test-case, since UV and mid-IR coverage are both available from the HST and Spitzer archives.
2 Calculations of IR emission from hydrogenated diamonds
Our first step consists in estimating the far-UV energy absorbed by hydrogenated (meteoritic) nanodiamonds, following the prescription of B05. The second step consists in defining a geometry for the dust and computing the IR emission profile using the same method as VK02. The derived profiles are finally compared to the mid-IR observations of 3C298.
We assume the quasar continuum source to be isotropic and surrounded by a dust screen that lies some distance away from it. For the sake of simplicity, the screen can be viewed as a spherical shell that covers a fraction of the source’s sky. The continuum source presumably consists of an accretion disk. Although the dust emits isotropically, the far-side dust screen is not directly observable, due to the opaqueness of the (intervening) accretion disk, which accounts for the factor in Eq. 1 below. The intrinsic SED over the whole UV domain is modelled as a power law of index , with and . To derive a more general formulation of the dust absorption trough, we use the concept of equivalent width , which we define relative to the continuum flux at 1350 Å, longward of the break, which is a spectral region relatively free of lines (e.g. Fig. 5 of B05). The total energy absorbed by the dust and expected to be re-emitted in the IR is given by
| (1) |
where is the observed flux at 1350 Å (rest-frame) for the quasar of interest. The value of is given by the integral
| (2) |
where is the transmittance of the dust in terms of its opacity , and the UV flux impinging on the dust screen. The opacity can be formulated in terms of the screen column times the extinction curve cross-section normalised to H. In the model of B05, the dust typically consists of 40% of nanodiamonds without surface adsorbates and 60% of hydrogenated nanodiamonds. Hence, the opacity due to hydrogenated nanodiamonds from meteorites is , where the latter cross-section corresponds to the extinction curve A1 calculated by B05 for hydrogenated nanodiamonds, assuming the small grain size regime. To describe the SED, we adopt a spectral index of , which is essentially the mean value encountered by B05 among their 39 class A quasars222The near-UV coverage provided by the HST-FOS spectrum of 3C298 was insufficient to constrain effectively.. B05 find that the H column that fitted the UV break of their class A quasars was . We obtain a satisfactory fit of the far-UV break in 3C298 by assuming a column of , the value assumed hereafter. Integrating Eq. 2, we derive a value of of 930 Å, which we consider representative of the majority of the class A spectra studied by B05.
To get a handle on the dust covering factor , we define, on the one hand, the maximalist case where the source is covered in all directions by the dust screen, and on the second, a minimalist case, in which the dust only covers the source’s sky as defined by the ionising bicone. The assumed bicone aperture is 45°. The two cases can be summarised as follows:
| (3) | |||||
| (4) |
With case B, we suppose that the UV radiation that emerges outside the ionising bicone is absorbed by the opaque torus rather than by crystallite dust. Since the UV break is ubiquitous in quasars, we consider the minimalist case B as a plausibly strict minimum for . The difference between the two cases amounts to an order of magnitude and represents the level of uncertainty regarding geometrical considerations.
3 The quasar 3C 298 as test-case
The well-known radio-loud quasar 3C 298 has a redshift of that allows the Spitzer IR Observatory to cover the relevant 3.5 \mic region (rest-frame), where emission from CH stretch modes is expected to occur. We retrieved the S14.0 IRS pipeline data from the Spitzer archive. The exposure times were 240 s with the Short-Low 2 (SL2+3) slit and 120 s with the Short-Low 1 (SL1) and Long-Low 2 (LL2) slits. The slit widths are 36, 37, and 106, respectively. The spectral resolving power is 86 at 5.2 \mic (2.1 \mic, rest) in SL2, 71 at 8.5 \mic (3.5 \mic,rest) in SL1 and SL3, 86 at 14.6 \mic (6 \mic, rest) in LL2, and it increases linearly with wavelength in each order. Two cycles were averaged, then nods were subtracted to remove the background emission. Spectra were extracted in standard apertures (SL2: 72 at 6 \mic, SL3: 72 at 8 \mic, SL1: 144 at 12 \mic, and LL2: 217 at 16 \mic). All orders and nods are well-matched in flux, indicating accurate pointing on the slits and no significant extended emission.
The resulting spectrum is shown in Fig. 1. Within the region of interest, 3–4 \mic, it agrees within 3% with the published (smoothed) version of the same spectrum by Haas et al. (2005)333The flux scaling in their Fig. 1 should read rather than the misprinted value of .. However, we note that our IRS fluxes are lower by a factor 2.5 compared to those quoted in the NASA/IPAC Database (NED), which consisted of ISO and Spitzer MIPS photometric measurements. Variability of the underlying non-thermal component, rather than of the dust, is the most likely explanation (Cleary et al. 2007).
The FOS-archived spectrum for this object indicates a flux value of (corrected for Galactic reddening). Using Eqs. 1 and 2, we derived integrated flux values of and for the cases A and B, respectively. That much energy should appear as two IR bands at 3.43 and 3.53 \mic.
3.1 The 3.43 and 3.53 IR bands from HD 97408 data
To model the nanodiamond emission, we adopted the 8-components fit of VK02 of the two bands444VK02 provide a comprehensive and self-consistent model of the IR bands, in which the stellar UV radiation heats up the dust. The profile of the strongest component at 3.53 \mic allowed these authors to infer a nanodiamond temperature of K and a grain size range of 10–100 Å. that were observed in the ISO spectrum of the stellar disk of Herbig Ae/Be star HD 97408. The method used by VK02 was to decompose the observed 3 micron region using Lorentzian profiles and to determine the peak frequency, width, and relative strength of the profiles by a least-square fitting routine. The other two stars studied by these authors show similar features, but with a lower S/N. The profile was normalised to reflect the values expected in 3C298 and is shown in Fig. 1 for cases A and B. The continuous lines show the result of convolving the nanodiamond emission profiles with the spectral resolution characterising the data on 3C298 ().
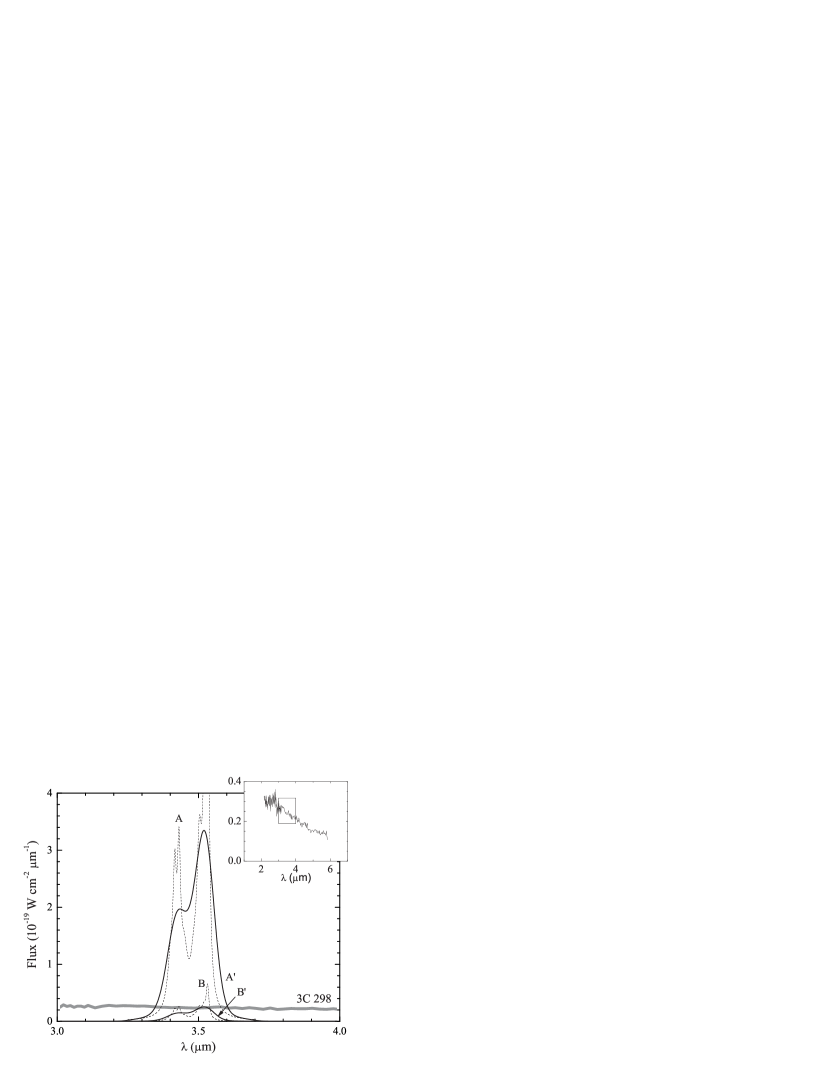
As shown in Fig. 1, hydrogenated nanodiamond emission should be detected clearly, if present. In the case A scenario, the prediction is of very strong emission bands (thin line A′ peaks at times above the quasar continuum height) that should swamp the IR spectrum at wavelengths near 3.5 \mic, which is not observed. For case B, where the emission only originates within the near-side ionising cone of the quasar, the nanodiamond emission is much less dramatic but still comparable to the height of the continuum. The lack of any dust signature on the IR spectrum of 3C 298 appears to rule out that hydrogenated nanodiamonds similar to the meteoritic type are present in the amount predicted by the UV absorption model of B05.
3.2 The 3.43 and 3.53 \mic bands from the laboratory
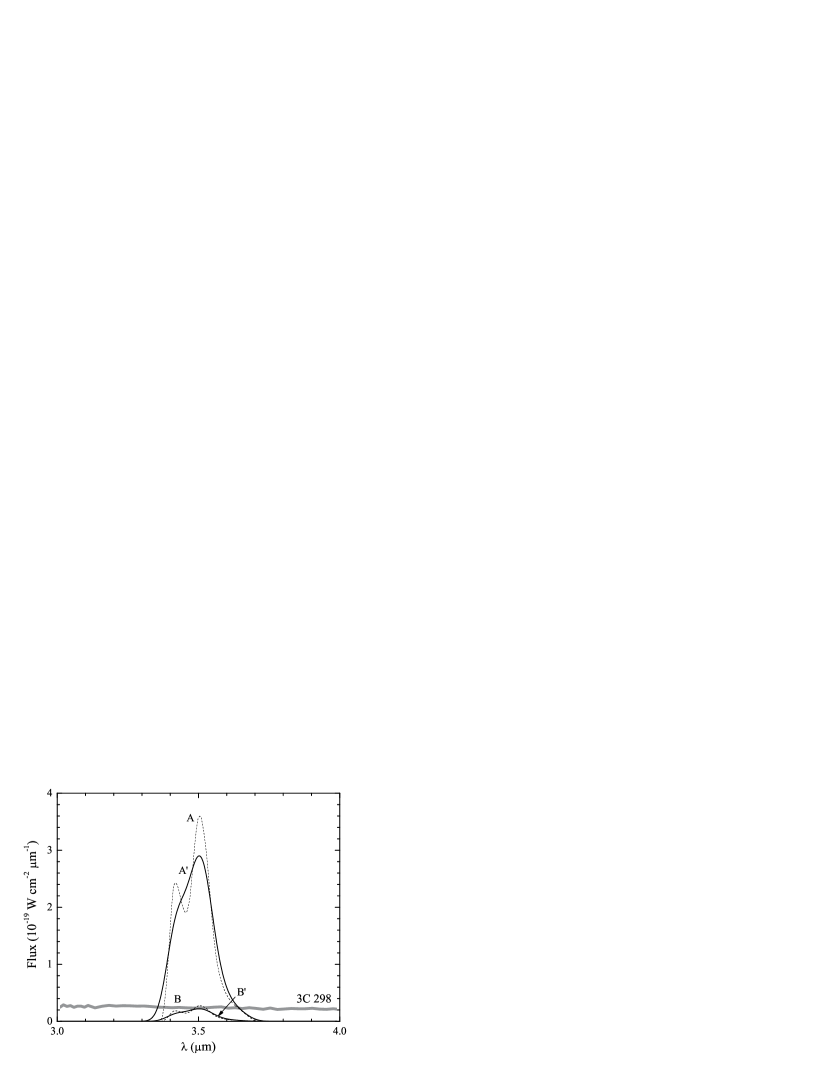
Independent laboratory measurements of nanodiamonds from distinct meteorites show different peak positions and strengths for the features around 3.43 and 3.53 \mic (see Table 1 in Braatz et al. 2000). It is not clear whether these variations disclose a real physical difference between the diamond populations from different carbonaceous chondrites, or if they are the result of the laboratory procedures. MA04 used 100 g of the Allende meteorite, while JH04 used 1 g of the Orgueil meteorite for their otherwise almost identical laboratory measurements. The data by MA04 show similar features to those observed by VK02, while the data from JH04 do not present the same features. JH04 compared the Orgueil data with the bands produced by larger hydrogenated synthetic diamonds and, in contrast to VK02, conclude that the spectra observed from HD 97408 and Elias I are better matched by the larger diamonds’ profiles. Supposing that JH04 is right, instead of using the empirical profiles from HD 97408, we should then consider using the profiles measured by JH04 (their Fig. 1) corresponding to the nanodiamonds of the Orgueil meteorite. In this way, we would ensure that the grain size regime remains consistent with the B05 model, which relies on a dust model containing meteoritic nanodiamonds of radii nm. In Fig. 2 we present the expected IR bands, assuming the JH04 profiles inferred from the nanodiamonds of the Orgueil meteorite. The areas under the profiles and the notation are the same as in Fig. 1. As can be seen by comparing both figures, the conclusions reached do not depend on whether we follow the interpretation of VK02 or of JH04.
4 Discussion
No emission bands are observed in 3C298 at 3.43 and 3.53 \mic (rest-frame), which we could ascribe to hydrogenated diamond CH stretches, whether we assume the VK02 or the JH04 profiles. Before concluding that meteoritic (i.e. hydrogenated) nanodiamonds are ruled out in quasars, we must contend with the following issue. We have assumed that all the energy absorbed in the UV was to reappear entirely within the 3.43 and 3.53 \mic bands. Jones & d’Hendecourt (2000) differ on this point, as they propose that the nanodiamonds account for many of the PAH features as well. However, VK02 argue against this view. On the other hand, even if we considered the whole of the 7.7 \mic feature and the 20 \mic plateau observed in HD 97408 to be the results of nanodiamond emission, this would still leave 30% of the energy to be emitted at 3.43 and 3.53 \mic. Even after a reduction by a factor of three of the area below the profiles in Figs. 1 and 2, we estimate that the inferred absence of the bands would still hold as a significant result, at least for intermediate values of , between cases A and B.
Our conclusion is that hydrogenated nanodiamonds identical to those found in meteorites are not present in the mid-IR spectrum of 3C298. An interesting possibility, however, is that the surface CH bonds have been photo-destroyed by the quasar’s intense UV flux. Such nanodiamonds could not generate the bands discussed in this paper. Furthermore, the UV properties of the crystallites should mimic those of cubic terrestrial diamonds rather than those of meteoritic nanodiamonds (with surface CH bonds). Haro-Corzo et al. (2007) modify the original B05 dust model by replacing the meteoritic type by an enlarged size distribution of the cubic terrestrial type alone. This dust model reproduces the far-UV break of quasars and would not generate any CH stretch emission. To verify such a model, we now need to consider bulk impurities of the CN or CO type (Andersen et al. 1999) or the much less efficient multi-phonon modes (Braatz et al. 2000; Edwards 1985; Jones & d’Hendecourt 2000).
Acknowledgements.
This work was funded by the CONACyT grant J-50296 and the UNAM PAPIIT grant IN118601. It is partly based on observations made with the Spitzer Space Telescope, which is operated by the Jet Propulsion Laboratory, California Institute of Technology under NASA contract 1407. The Dark Cosmology Centre is funded by the Danish National Research Foundation. We thank Diethild Starkmeth and Dominique Binette for help with proofreading.References
- Andersen et al. (1998) Andersen, A. C., Jørgensen, U. G., Nicolaisen, F. M., Sørensen, P. G., & Glejbol, K. 1998, A&A, 330, 1080
- Andersen et al. (1999) Andersen, A. C. 1999, PhD thesis, University of Copenhaguen
- Binette et al. (2003) Binette, L., Rodríguez-Martínez, M., Haro-Corzo, S., & Ballinas, I. 2003, ApJ, 590, 58
- Binette et al. (2005) Binette, L., Magris C., G., Krongold, Y., Morisset, C., Haro-Corzo, S., de Diego, J. A., Mutschke, H., & Andersen, A. C. 2005, ApJ, 631, 661 (B05)
- Binette et al. (2007) Binette, L., Krongold, Y., Haro-Corzo, S., & Andersen, A. 2007, ASP Conf. Ser.: The central engine of active galactic nuclei, ed. L. C. Ho and J.-M. Wang, in press
- Braatz et al. (2000) Braatz, A., Ott, U., Henning, T., Jäger, C., & Jeschke, G. 2000, Meteoritics and Planetary Science, 35, 75
- Cleary et al. (2007) Cleary, K., Lawrence, C. R., Marshall, J. A., Hao, L., & Meier, D. 2007, ApJ, in press (astro-ph/0612702)
- Eastman et al. (1983) Eastman, R. G., MacAlpine, G. M., & Richstone, D. O. 1983, ApJ, 275, 53
- Edwards (1985) Edwards, D. 1985, Cubic Carbon (Diamond), in Handbook of Optical Constants of Solids, ed. E. Palik (Academic Press Inc., Harcourt Brace Jovanovich, Publishers, Orlando, Florida, USA), 665
- Guillois et al. (1999) Guillois, O., Ledoux, G., & Reynaud, C. 1999, ApJ, 521, L133
- Haas et al. (2005) Haas, M., Siebenmorgen, R., Schulz, B., Krügel, E., & Chini, R. 2005, A&A, 442, L39
- Haro-Corzo et al. (2007) Haro-Corzo, S.A.R., Binette, L., Krongold, Y., Benitez, E., Nicastro, F., & Rodríguez-Martínez, M. 2007, ApJ, in press (astro-ph/0702358)
- Hill et al. (1997) Hill, H.G.M., d’Hendecourt, L.B., Perron C., & Jones, A.P., 1997, Meteoritics, 32, 713
- Jones & d’Hendecourt (2000) Jones, A.P., & d’Hendecourt, L.B. 2000, A&A, 355, 1191
- Jones et al. (2004) Jones, A.P., d’Hendecourt, L.B., Sheu, S.-Y., Chang, H.-C., Cheng, C.-L., & Hill, H.G.M. 2004, A&A, 416, 235 (JH04)
- Korista et al. (1997) Korista, K., Ferland, G., & Baldwin, J. 1997, ApJ, 487, 555
- Lewis et al. (1989) Lewis, R.S., Anders, E., & Draine, B.T., 1989, Nature, 364, 607
- Mutschke et al. (2004) Mutschke, H., Andersen, A. C., Jäger, C., Henning, T., & Braatz, A. 2004, A&A, 423, 983 (MA04)
- Telfer et al. (2002) Telfer, R. C., Zheng, W., Kriss, G. A., & Davidsen, A. F. 2002, ApJ, 565, 773
- Van Kerckhoven et al. (2002) Van Kerckhoven, C., Tielens, A. G. G. M., & Waelkens, C. 2002, A&A, 384, 568 (VK02)