The interaction between radio lobes and hot gas in the nearby radio galaxies 3C 285 and 3C 442A
Abstract
We present Chandra observations of two nearby radio galaxies in group environments, 3C 285 and 3C 442A. The host galaxies of both sources are involved in mergers with nearby massive galaxies, and the hot gas in the systems is extended along lines joining the interacting galaxies. Both sources show strong evidence for interactions between the radio lobes and the asymmetrical hot gas. We argue that the structure in the hot gas is independent of the existence of the radio lobes in these systems, and argue that hot gas shaped by an ongoing massive galaxy merger may play an important role in the dynamics of radio lobes in other objects. For 3C 442A, our observations show that gas is being driven out of both members of the host interacting galaxy pair, and the implied constraints on galaxy velocities are consistent with mildly supersonic motions with respect to the group-scale hot gas. The previously known filamentary radio structure in the center of 3C 442A may be a result of the interaction between hot gas expelled from these galaxies and pre-existing radio-emitting plasma. In 3C 285, where there is no ongoing galaxy merger, the powerful radio source is probably having a significant effect on the energetics of the host group.
1 Introduction
1.1 Radio lobes, hot gas, and mergers
Chandra and XMM-Newton observations now routinely allow us to measure both the inverse-Compton emission from the lobes of radio galaxies and the thermal bremsstrahlung from the intra-group or intra-cluster media in which they are embedded (e.g., Hardcastle et al., 2002; Croston et al., 2004). In almost all cases studied to date, the internal pressures in the radio lobes are comparable to those in the hot, X-ray emitting phase of the external medium, rather than greatly exceeding it as had sometimes been thought to be the case (cf. Hardcastle & Worrall, 2000). We know of only a few objects — the best example being the inner lobes of Centaurus A (Kraft et al., 2003) — in which the internal lobe pressures must be much larger than the inferred external pressure, although the limited numbers of such sources found to date is almost certainly affected by selection effects.
In the objects where the pressures of the radio-emitting plasma and the X-ray-emitting external medium are comparable, the dynamics of the large-scale radio structures, the lobes and plumes, will be determined, at least in part, by the properties of the hot gas. Clear evidence that this is so pre-dates the launch of Chandra and XMM-Newton (e.g., Hardcastle, Worrall & Birkinshaw, 1998) but much more detailed studies have been possible in recent years, particularly in nearby, low-power radio galaxies (e.g. Croston et al., 2003; Hardcastle, Sakelliou & Worrall, 2005). At the same time, the lobes displace and compress the material that they expand into, as is evident from observations of ‘cavities’ in the X-ray-emitting material (e.g., Bîrzan et al., 2004). This means that, when we observe a radio galaxy and its environment, and see a relationship between radio-emitting structures and those in the X-ray, it is often not clear whether what we are seeing is a pre-existing distribution of hot gas that has shaped the radio source that lies in it, or whether, on the other hand, we are seeing the effects of the radio source on what would otherwise have been a relatively structure-free external medium.
In a relaxed system that does not host a powerful radio source we do not expect to find long-lasting complex structure in the hot X-ray-emitting plasma of a group or cluster atmosphere, since any such structure will be washed out on a sound-crossing time. However, complex structures can be created by dynamical processes related to the group or cluster galaxies. Cluster or group mergers are known to produce large-scale asymmetries in the ICM/IGM which may affect the dynamics of radio sources hosted by one of the group/cluster galaxies (e.g., Kraft et al., 2006). On smaller scales, galaxy-galaxy interactions and mergers would be expected to give rise to structures in the group or cluster atmosphere, both because they produce a local gravitational potential that is not radially symmetrical and because frictional and tidal processes will give rise to the stripping and heating of gas from the galaxy (e.g., Osmond, Ponman & Finoguenov, 2004): the latter process is of course important if one or both of the merging systems are massive elliptical galaxies with large pre-existing galaxy-scale hot gas haloes. This makes it particularly interesting to observe radio galaxies in which a major merger is taking place. In this paper we present new Chandra observations of two nearby radio galaxies, 3C 285 and 3C 442A, which meet this selection criterion. We show that structures in the X-ray-emitting gas, likely related to the mergers, are almost certainly affecting the dynamics of the lobes of the radio galaxies, and discuss the implications of this result for the radio galaxy population as a whole. More detailed discussion of the dynamics of 3C 442A in relation to the ongoing galaxy merger can be found in Worrall et al. (2007).
1.2 3C 285
3C 285 is a nearby (, Sandage 1967) low-power FRII radio galaxy, with a 178-MHz luminosity111Here, and throughout the paper, we use a concordance cosmology with km s-1 Mpc-1, and . of W Hz-1 sr-1, just above the canonical Fanaroff-Riley (1974) break at W Hz-1 sr-1. At the distance of 3C 285 1′′ corresponds to a projected distance of 1.50 kpc: the luminosity distance is 360 Mpc. Although 3C 285 shows jets and hotspots (best seen in the images of van Breugel & Dey 1993) the jets are relatively bright, and the hotspots relatively weak, compared to more luminous FRII sources, suggesting that it is in some sense an intermediate object. 3C 285’s host galaxy is the brightest member of a small optical group (Sandage, 1972) and is strongly elongated towards a fainter spiral companion 40′′ (60 kpc) to the NNW, suggesting a tidal interaction: an extended filament of optical emission-line gas connects the two galaxies (Baum et al., 1988). Several other galaxies with magnitudes that make them likely to be group members lie within 200 kpc. In HST imaging (Allen et al., 2002) 3C 285’s host galaxy can be seen to be strongly disturbed, with several distinct linear dust features, suggesting a recent merger with a large, gas-rich galaxy (cf. Roche & Eales, 2000). 3C 285 is best known for the association of its radio jet with a blue, star-forming region, making it one of the few objects to show direct evidence for jet-induced star formation (van Breugel & Dey, 1993). Saslaw, Tyson & Crane (1978) claim a detection of an optical counterpart to the E hotspot, which we discuss further below (§3.2.1). 3C 285 had not been detected in the X-ray until the observations discussed in the present paper: the Einstein HRI upper limit quoted by Fabbiano et al. (1984) shows that the system is not very X-ray luminous (their limit corresponds to erg s-1 between 0.5 and 3.0 keV within in the cosmology we use).
1.3 3C 442A
3C 442A2223C 442A is sometimes referred to as 3C 442 in the literature. Early maps of the field (e.g. Mackay, 1969) showed the presence of two radio sources. One of these sources was extended and associated with the NGC 7236/7237 galaxy pair; the other, 28 arcmin to the SSE, was compact, with a flux density around 1 Jy at 1.4 GHz, had a steep spectrum, and was not associated with any bright galaxy. Its 178-MHz flux density contributes to the measured 3CR flux (Véron, 1977). The designation 3C 442A was given to the first source (apparently first used in print by Jenkins, Pooley & Riley 1977; subsequently adopted by Laing, Riley & Longair 1983) to make it clear that the two were unrelated. The second source could have become known as 3C 442B, but is in fact generally referred to as 4C 13.83 or PKS 2212+131, and is coincident with an SDSS quasar with . Because of its distance from 3C 442A it is not detected in any of the X-ray datasets discussed in this paper. is associated with the interacting galaxy pair NGC 7236/7 at (Greenstein, 1962). Its 178-MHz luminosity of W Hz-1 sr-1 puts it below the FRI/FRII break. At the distance of 3C 442A 1′′ is 0.54 kpc: the luminosity distance is 118 Mpc. In the radio (Birkinshaw, Laing & Peacock, 1981; Comins & Owen, 1991), 3C 442A shows a double-lobed structure with no sign of any jet, although a compact flat-spectrum radio core coincident with NGC 7237 suggests current AGN activity in that object. Comins & Owen argue that the compact features in and close to the lobes are unrelated to the source, which, if true, would make 3C 442A a member of the class of ‘fat doubles’ or ‘relaxed doubles’ (e.g., Laing, 1993), a number of which are found in the 3CRR sample close to the FRI/FRII luminosity break. 3C 442A is remarkable for the detection by Comins & Owen of two filaments of steep-spectrum radio emission that cross the region containing the host galaxy, NGC 7237. Optically this galaxy, an elliptical (assumed to be the host on the basis that it hosts a compact radio source) appears to be interacting with an S0 neighbour of similar luminosity to the NE, NGC 7236: the two are separated by 35′′ (19 kpc) and are embedded in a common, distorted stellar envelope which also includes another, smaller elliptical 38′′ (21 kpc) to the SW of NGC 7237, denoted NGC 7237C hereafter (Borne & Hoessel, 1988). The measured radial velocities for NGC 7236 and NGC 7237 are very similar, suggesting an interaction close to the plane of the sky, which allowed Borne (1988) to make detailed models of the system. HST imaging (Martel et al., 1999) shows some weak evidence for dust emission in NGC 7237, but generally the inner parts of the system appear like an undisturbed elliptical, in contrast to 3C 285’s host. NGC 7236/7 lies at the center of a group of galaxies (Comins & Owen, 1991). In the X-ray, Hardcastle & Worrall (1999) used ROSAT data to show that the soft X-ray emission had relatively complex structure, with a small-scale extension around NGC 7237 as well as large-scale (3′, or 100 kpc) extension in a direction perpendicular to the radio lobe axis.
2 Observations
2.1 X-ray observations
3C 285 and 3C 442A were both observed using the ACIS instrument on Chandra. 3C 285 was observed for a total livetime of 39.3 ks in a single observation with the ACIS-S in the HRC guaranteed time program (PI: Stephen Murray), as part of a larger project to complete Chandra observations of the 3CRR sample at . 3C 442A was observed in four separate observations, with three distinct roll angles, with the ACIS-I as a guest-observer observation (PI: Ralph Kraft) for a total livetime of 93.6 ks. Table 1 lists the observing times and OBSIDs for the observations. We reprocessed and filtered the data in the standard way, using the standard ASCA grade set. Both observations were made in VFAINT mode and so we used VF cleaning to reduce the background level. The 0.5-pixel event position randomization in the standard pipeline processing was also removed. We then used light curves excluding the nucleus and bright point sources to search for intervals of high background. For 3C 285 this flagged a small fraction of the data, as shown in Table 1.
| Source | Detector | Chips on | Date | OBSID | Roll angle | Original | Filtered |
|---|---|---|---|---|---|---|---|
| (degree) | livetime (s) | livetime (s) | |||||
| 3C 285 | ACIS-S | 23678 | 2006 Mar 18 | 6911 | 147.6 | 39625 | 39280 |
| 3C 442A | ACIS-I | 01236 | 2005 Jul 27 | 5635 | 141.5 | 27006 | 27006 |
| 2005 Jul 28 | 6353 | 141.5 | 13985 | 13985 | |||
| 2005 Oct 07 | 6359 | 262.3 | 19884 | 19884 | |||
| 2005 Dec 12 | 6392 | 312.2 | 32694 | 32694 |
2.2 Radio data
Both radio galaxies have been well observed with the Very Large Array (VLA) in the radio at a number of frequencies (van Breugel & Dey, 1993; Comins & Owen, 1991) and images showing the overall source structure at 1.4 GHz are available from the online 3CRR atlas of J.P. Leahy et al.333http://www.jb.man.ac.uk/atlas/. We required high-resolution radio images at multiple frequencies to allow us to compare the radio data with the X-ray data at the highest resolution, and we also needed multi-frequency data sampling the largest angular scales of the sources to allow us to carry out internal pressure and inverse-Compton calculations for the radio lobes. Accordingly, we retrieved various VLA datasets from the online archive (see Table 2 for a complete list) and reduced them in the standard manner within aips. Where the VLA had observed the sources at a given frequency at more than one configuration, we reduced the data from each configuration separately, cross-calibrated for phase and then concatenated the datasets with appropriate reweighting using the aips task DBCON. Mapping was carried out using the aips tasks IMAGR (for the lowest resolutions) and VTESS (for maps of combined datasets at high resolutions). In addition, for flux measurements of the lobes of 3C 285 at low frequencies, we used Giant Meter-wave Radio Telescope (GMRT) data at 240 and 610 MHz taken for another purpose (PI: Martin Hardcastle). Maps from these observations will be presented elsewhere.
| Source | Program ID | Date | Frequency | Configuration | Time on source |
|---|---|---|---|---|---|
| (GHz) | (h) | ||||
| 3C 285 | AV127 | 1986 May 07 | 1.51 | A | 2.6 |
| AV127 | 1986 Aug 29 | 4.85 | B | 1.9 | |
| AV127 | 1986 Aug 29 | 1.51 | B | 1.1 | |
| AV127 | 1986 Dec 02 | 4.85 | C | 0.9 | |
| AV127 | 1986 Dec 02 | 1.51 | C | 0.5 | |
| AS549 | 1995 Apr 11 | 4.91 | D | 0.7 | |
| 3C 442A | AC131 | 1985 May 13 | 1.44 | B | 3.0 |
| AC131 | 1985 May 13 | 4.85 | B | 2.9 | |
| AC131 | 1985 Jul 19 | 1.44 | C | 2.8 | |
| AC131 | 1985 Jul 19 | 4.85 | C | 2.8 | |
| AC131 | 1985 Dec 06 | 1.44 | D | 1.5 |
Note. — Observations were made at two observing frequencies. The frequency quoted is the mean of the two.
2.3 Optical and infrared data
Both sources are close enough that images from the Digital Sky Survey (DSS2) can be used to indicate the positions of the galaxies in the host group. In addition, both have been observed with the Hubble Space Telescope (HST), as discussed above, and with Spitzer as part of a survey of the low-redshift 3CRR objects (PI: Mark Birkinshaw). We use DSS2 and archival HST data, the latter processed using the standard pipeline, where optical information is important to our analysis. The Spitzer observations of 3C 442A are discussed by Worrall et al. (2007) and we only refer to them in passing in the present paper.
3 Results
In this section we discuss the main observational results from the Chandra observations. We first briefly describe the small-scale emission seen from the active nuclei of the systems, the detections of or limits on any hotspot or jet-related components, and the other galaxies in the group. We then discuss in detail the extended X-ray emission seen in the Chandra data and its relationship to the radio source.
All the X-ray analysis we describe was carried out using ciao 3.3 and caldb 3.2.2 for spectral extraction, and xspec 11.3 for spectral fitting. The specextract script was used for spectral extraction for extended sources, and the psextract script for point sources. Galactic column densities of cm-2 and cm-2 are assumed for 3C 285 and 3C 442A respectively (interpolated from the data of Stark et al. 1992) and are included in all spectral fits. We fitted to data in the energy range 0.4–7.0 keV unless otherwise stated: spectra were binned, typically to 20 net counts per bin after background subtraction, so that statistics could be applied. Errors quoted on parameters derived from xspec fitting are the 90 per cent confidence range for one interesting parameter, unless otherwise stated, but errors quoted on measured numbers such as flux densities or numbers of counts are the errors. Where counts are quoted the errors are derived from the Gaussian () approximation to the true confidence range, as calculated by the funtools code used to determine the background-subtracted values – this is accurate to better than 10% for counts (cf. Gehrels 1986), and the Gaussian assumption is necessary in any case if we are to combine errors in the standard way with the uncertainty on the expected background counts.
3.1 Nuclei
The X-ray nucleus of 3C 285 has already been discussed by Hardcastle, Evans & Croston (2006), using the same Chandra dataset. They found that it was well modelled as a double power law, with one component being heavily absorbed ( cm-2) and one having only Galactic absorption. The nucleus was relatively weak, and so in their fits the poorly constrained power-law indices were fixed to 2.0 and 1.7 for the unabsorbed and absorbed components respectively. A combination of absorbed and unabsorbed emission is consistent with what is seen for other narrow-line FRII radio galaxies.
3C 442A is a low-excitation radio galaxy (Laing et al., 1983) – i.e., a nuclear spectrum of NGC 7237 shows no strong high-excitation emission-line features – and so we might expect not to see a heavily absorbed nuclear component (Hardcastle et al., 2006). We extracted spectra for the X-ray source corresponding to the currently active radio core using a small (6 standard Chandra pixels in radius) circular extraction region and a concentric background annulus (between 6 and 9 pixels). The nuclear spectra can be fitted acceptably ( for 12 degrees of freedom) with a single power law model with Galactic absorption and variable normalization (see below), although the best-fitting single power-law photon index fitted to all four spectra simultaneously is rather flat (). There is some evidence in radial profiles of the core region that even this small-scale extraction region contains extended emission, and so it is possible that the spectra are contaminated by some thermal emission, but adding a thermal component does not significantly change the best-fitting power-law spectrum. Adding some intrinsic absorption (the same column density for all four epochs) gives a more typical power-law index () and a column density of cm-2, with a somewhat improved fit ( for 11 degrees of freedom). This column density is high, but not unprecedentedly high, compared to other low-power sources, and may indicate some obscuration by the small-scale dust lane that is seen to cross the nucleus in the HST observation. We estimate a maximum for the off-nuclear extinction seen in the HST data taken with the F547M filter, which would be consistent with the lower end of the confidence range for the X-ray absorbing column for a Galactic gas to dust ratio.
The core was clearly variable over the time period of our observations, and acceptable fits were not obtained unless we allowed the normalizations of the power laws fitted to each dataset to vary. The normalizations for the four epochs listed in Table 1 correspond to 1-keV flux densities of , , and nJy respectively (assuming Galactic absorption only: flux densities would be approximately a factor 2 higher for the best-fitting absorbing column). Variability of the photon index as well as the normalization might explain the relatively poor fit and flat photon index given by the combined dataset, but the data are not good enough to constrain this possibility. We were initially concerned that the variability might be an artefact of the data, as the core in the third observation (obsid 6359) lies close to a node boundary, with many events in the core region in the level 1 events file being flagged as being on or near a bad pixel. However, we are satisfied that the ancillary response files (ARFs) make an adequate correction for this reduced effective exposure time, and we have verified that regions taken from the thermal emission close to the core (§3.4.2) do not show any variability in count rate or fitted parameters. We therefore infer that the core is genuinely variable, presumably because of ongoing AGN activity. The 5-GHz flux density of the core of 3C 442A is 3.1 mJy in the VLA data we use, compared to the value of 1.9 mJy from earlier radio observations tabulated by Fabbiano et al. (1984), so that it appears that the radio core may be similarly variable on long timescales (months in the case of the X-ray, years in the case of the radio). The approximate positions, given the uncertainties imposed by variability and non-simultaneous observations, of the source on the radio/X-ray core flux density and luminosity correlations for low- sources (Evans et al., 2006) are consistent with expectations. The bolometric unabsorbed X-ray luminosity of the core region ranges between 2 and erg s-1, which puts it well above the expectation from X-ray binaries from the whole galaxy (O’Sullivan, Forbes & Ponman, 2001) given the -band optical luminosity of (Laing et al., 1983).
3.2 Jets, knots and hotspots
3.2.1 3C 285
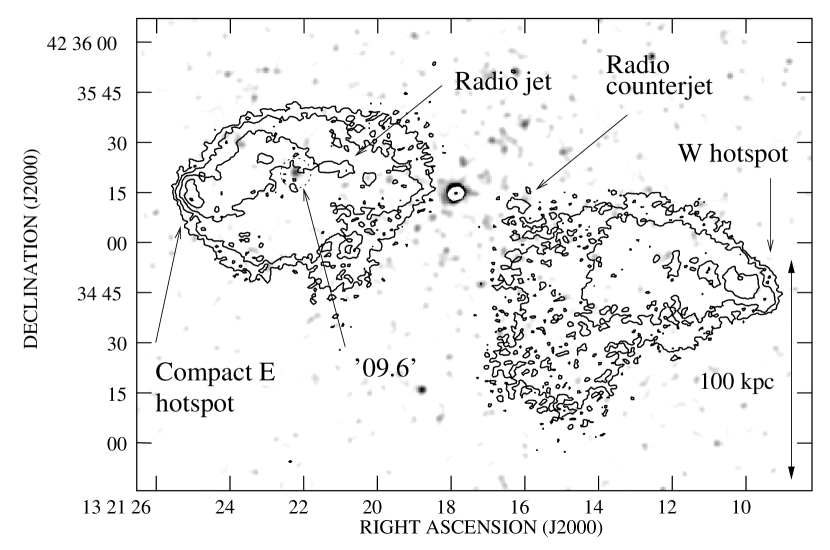
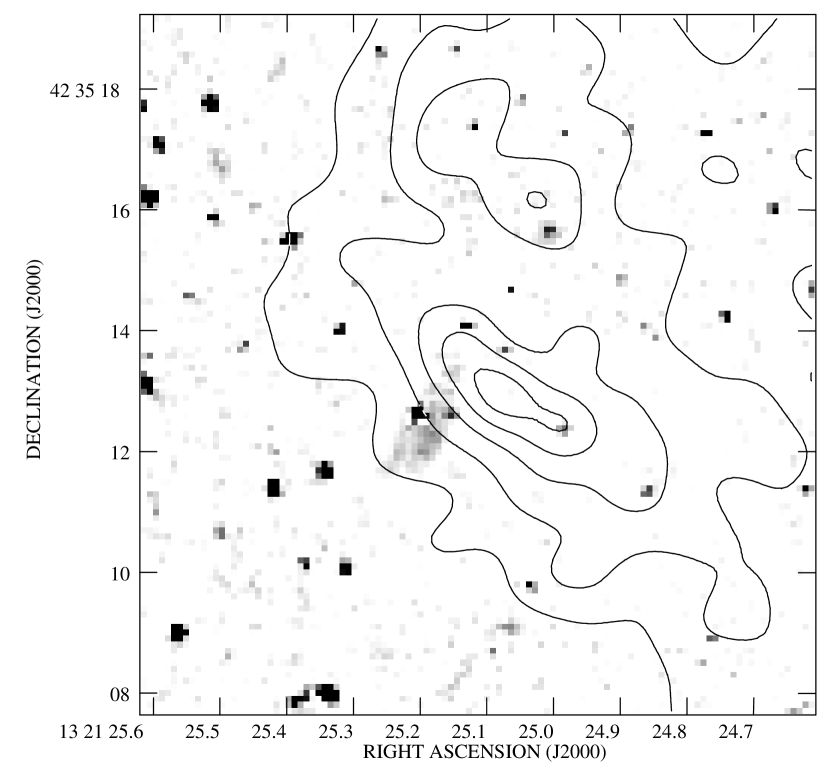
The jets and hotspots of some low-power FRII radio galaxies (e.g., 3C 403, Kraft et al. 2005) show prominent synchrotron X-ray counterparts to compact radio features. 3C 285 has a well-defined though faint jet and counterjet in the radio and a bright compact hotspot (in the E lobe). However, none of these is detectable as an X-ray source in the Chandra observation (Fig. 1). The only convincingly detected compact feature in the lobes in the Chandra data (with counts in the 0.5-5.0 keV energy band) is spatially coincident with the blue object denoted 09.6 by van Breugel & Dey (1993), lying within of the peak of the resolved optical emission in the HST images, with a centroiding uncertainty of . 09.6 was identified by van Breugel & Dey (1993) as a star-forming galaxy that is at the redshift of 3C 285’s host, whose star formation may be related to the nearby radio jet. Roughly, the unabsorbed bolometric X-ray luminosity of this object in the Chandra band is of the order of erg s-1 (assuming a MEKAL model with keV), which is a plausible luminosity for a dwarf starburst system with (the absolute magnitude quoted by van Breugel & Dey: our different cosmology makes no significant difference): for example, it is comparable to, though somewhat higher than, the luminosities derived for a sample of nearby, generally somewhat optically fainter dwarf starbursts by Ott, Walter & Brinks (2005). The X-ray detection is thus consistent with the starburst interpretation for 09.6.
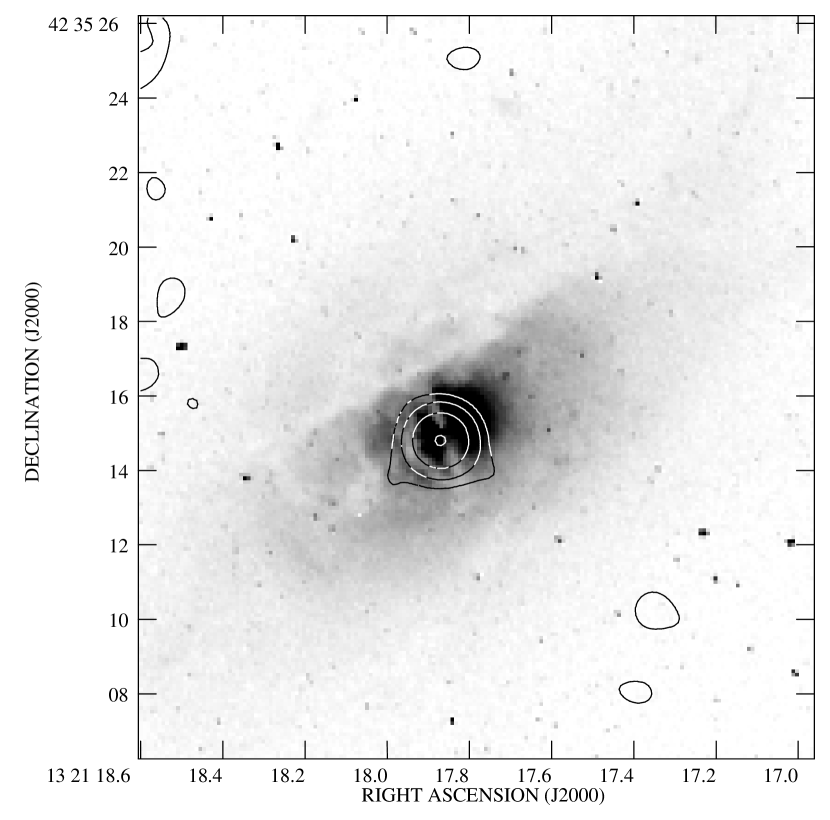
The non-detections of X-ray emission from the jets and hotspots in 3C 285 correspond to upper limits on the X-ray flux density. Roughly, a upper limit on the total background-subtracted counts in the 0.5-5.0 keV energy range from a region corresponding to the brightest compact hotspot (in the E lobe) is counts: this corresponds to a flux density limit of nJy at 1 keV for a source with photon index 2.0. However, the radio flux densities for the hotspot components are faint compared to the sources in which X-ray emission has been seen. The total 5-GHz flux density of the E hotspot is 6 mJy, which implies that (where is the two-point radio-to-X-ray energy spectral index: is defined here and throughout the paper in the sense that flux density ), but this is not a very strong constraint, as there are some hotspots with detected synchrotron X-ray emission that show (Hardcastle et al., 2004), while we would expect any synchrotron self-Compton emission at equipartition to be at the level of about 10 pJy. The E hotspot of 3C 285 is potentially interesting as it is the one claimed by Saslaw et al. (1978) to show an optical counterpart. However, examination of the F702W HST observations (originally discussed by Martel et al. 1999) shows that the peak of the optical emission from the hotspot region is offset by from the peak of the radio emission, using the default astrometry, which gives a reasonably good alignment (offset ) between the radio core and the center of the galaxy (Fig. 2). More importantly the optical object is morphologically quite different from the radio structure, and seems most likely to be a faint irregular galaxy. We thus conclude that there is no evidence for any emission from the E hotspot of 3C 285 in any band other than the radio. The W hotspot is fainter in the radio, so again we can only put weak limits on the radio to X-ray spectral index, and it has no detectable optical counterparts. Overall, the hotspots of 3C 285 seem to present a rather different picture to those seen in other nearby FRII radio galaxies of similar power such as 3C 403 (Kraft et al., 2005), 3C 321 (Hardcastle et al., 2004) and 3C 33 (Kraft et al., 2007). The hotspots of these objects, which have radio luminosities spanning a range around that of 3C 285, often have optical/IR and X-ray counterparts; their X-ray emission, largely inferred to be of synchrotron origin, has . The lack of an optical counterpart in particular may suggest that 3C 285’s hotspots are not able to accelerate particles to even moderately high energies. However, the biased nature of existing observations of nearby radio galaxies, many of which have been selected for observation because of their prominent radio or optical hotspots, makes it hard to say which is more typical.
3.2.2 3C 442A
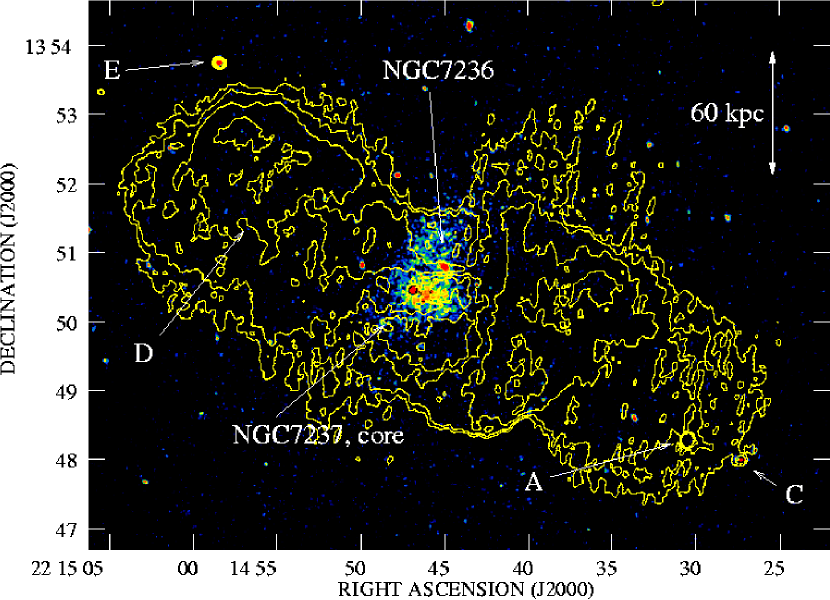
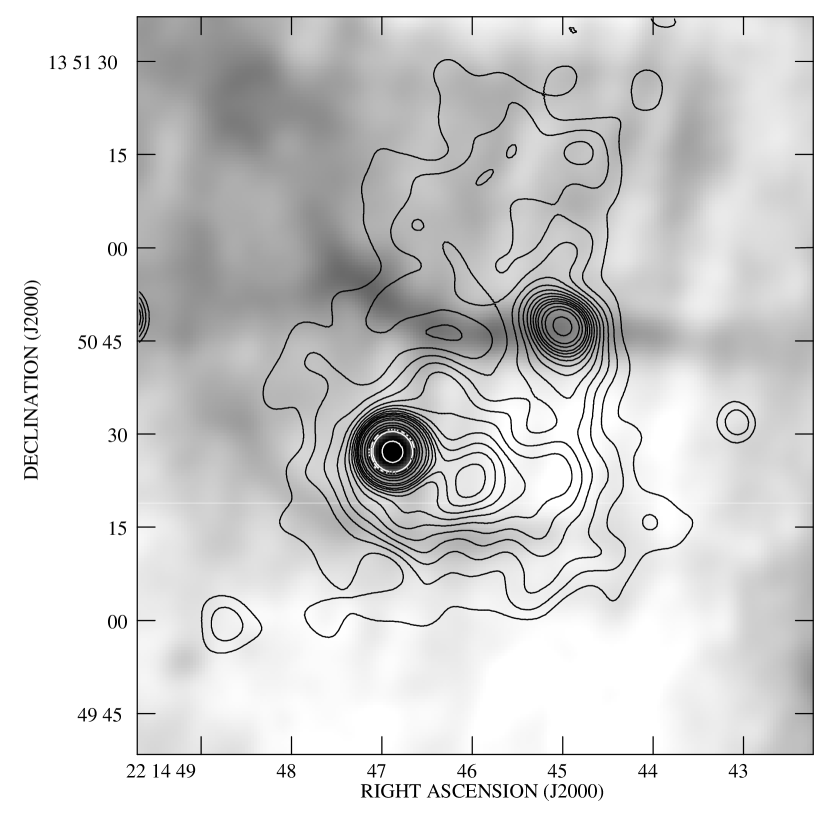
As discussed in §1.3, it is not clear whether any of the bright compact radio sources in the 3C 442A lobe are related to the radio galaxy itself. The X-ray data shed some light on this question, but do not completely resolve it. Fig. 3 shows our highest-resolution radio map overlaid on lightly smoothed Chandra data in the 0.5-5.0 keV band, with point sources labeled using the notation of Comins & Owen (1991). It can be seen that the two point sources, C and E, that lie outside or just on the edge of the lobes are relatively strong X-ray sources, having respectively and net counts in total in our observations. As Comins & Owen report, both these sources have optical counterparts, and it seems most likely that they are background AGN of some kind. C has an inverted radio spectrum between 1.4 and 4.9 GHz () while E is steep-spectrum (). The most puzzling of the bright point sources, A, is not detected in the X-ray and has no optical counterpart on DSS2 images (neither the HST nor Spitzer fields of view are large enough to give us more sensitive infrared or optical constraints). It is resolved at the highest radio resolution we have available () into two components separated by , the northern one unresolved and containing most of the flux, the southern one slightly resolved. Its radio spectrum is steep (), consistent with the results of Birkinshaw et al. (1981) at lower frequencies, which might imply that it is part of the source: but the lack of any connection to the filamentary structure in the lobes remains a strong argument against this, and it might equally well be a high-redshift double or core-jet source. If the source were a hotspot, the upper limit of 6 net counts in our observations, corresponding to 0.1 nJy at 1 keV for a source with photon index 2.0, would imply , but again this is not incompatible with the behaviour of some hotspots. No X-ray counterpart is detected for the weak point source D discussed by Comins & Owen, but it seems likely to be part of the complex filamentary structure in that part of the lobe, rather than a true point source. We do not detect the source B, referred to by Comins & Owen, in our radio images.
3.3 Group members
3.3.1 3C 285
We used the NASA Extragalactic Database, NED444http://nedwww.ipac.caltech.edu/, to search for optical objects identified as galaxies around the position of 3C 285 and, where possible, to obtain their redshifts as determined by the Sloan Digital Sky Survey555http://www.sdss.org/. In a search radius (chosen to cover the ACIS-S3 chip: equivalent to 450 kpc at the distance of 3C 285) there are 13 objects classified as galaxies (including 3C 285 itself) of which 8 have measured radial velocities: 6 of these are possibly consistent with membership of the 3C 285 group, while the other two are foreground objects. The positions and redshifts of these nearby galaxies are listed in Table 3. A few of these galaxies are detected in X-rays in the Chandra data. We tabulate counts measured from the events file in (15 kpc) extraction regions with background subtraction from a larger local background region. Upper limits are values based on Poisson statistics and derived from the local background value.
| Galaxy name | RA | Dec. | Radial velocity | X-ray counts |
|---|---|---|---|---|
| (km s-1) | (0.5-5.0 keV) | |||
| 3C 285 | 23804 | |||
| SDSS J132116.31+423551.3 | – | |||
| SDSS J132114.49+423620.3 | – | |||
| SDSS J132114.01+423557.5 | 23738 | |||
| SDSS J132114.75+423631.1 | 24623 | |||
| SDSS J132117.98+423657.4 | 24130 | |||
| SDSS J132130.21+423544.3 | 22643 | |||
| MAPS-NGP O-219-0156129 | – | |||
| MAPS-NGP O-219-0183438 | – | |||
| SDSS J132131.68+423208.2 | 10678 | |||
| MAPS-NGP O-219-0156725 | – | – | ||
| SDSS J132051.31+423550.5 | 15351 | |||
| SDSS J132058.74+423147.6 | 22115 | – |
Note. — Galaxies are sorted by distance from 3C 285. Galaxies with no Chandra detection or upper limit lie partly or wholly off the detectors. Count measurements or upper limits marked with an asterisk are taken from the front-illuminated ACIS-S4 chip. Where objects are named by their 2MASS name in NED we have used the SDSS name instead to make the origin of the data clearer. SDSS J132114.49+423620.3 is not included in the NED listing but is clearly a nearby member of the group, so we have taken its name and position directly from the SDSS DR5. All counts tabulated are background subtracted: upper limits are .
Although the two bright galaxies adjacent to 3C 285 have no spectroscopic information available in SDSS, we can estimate the velocity dispersion of the group from the information we have. If we include all SDSS velocities with km s-1, then the mean heliocentric radial velocity is km , and the velocity dispersion is km s-1, which would be high for a group. However, as Table 3 shows, the two galaxies furthest away from 3C 285 have radial velocities that differ markedly from its velocity. If we consider only the four galaxies closest to 3C 285 on the sky then the mean velocity is 24070 km s-1, about 270 km s-1 higher than that of 3C 285 itself, but the velocity dispersion is a more reasonable km s-1 (where the errors are determined using the method of Danese, de Zotti & di Tullio 1980). We cannot draw many conclusions from such a small number of radial velocities (a relatively short optical observation would give us much better constraints on the nature of the optical group) but it seems likely that only the inner galaxies in this region should be considered to be bound group members. Using the relation of Helsdon & Ponman (2000) the lower velocity dispersion would be expected to correspond to a temperature for the X-ray gas of keV, where the errors here are only statistical and take no account of the scatter in the – relation.
3.3.2 3C 442A
As for 3C 285, we used NED to search for galaxies in the 3C442A group. As 3C 442A is substantially closer to us, the data are better: in a (450 kpc) radius aperture there are 40 galaxies, all of which have measured radial velocities from the SDSS or elsewhere. 31 of these have radial velocities within 1000 km s-1 of the value for NGC7236/7, and so are potential group members. Positions and radial velocities of these objects are tabulated in Table 4.
| Galaxy name | RA | Dec. | Radial velocity | X-ray counts |
|---|---|---|---|---|
| (km s-1) | (0.5-5.0 keV) | |||
| NGC 7237 | 7868 | |||
| NGC 7236 | 7879 | |||
| NGC 7237C | 7153 | |||
| SDSS J221439.24+134920.0 | 7997 | |||
| SDSS J221437.58+135053.0 | 8375 | |||
| 2MASX J22144047+1352416 | 8030 | |||
| SDSS J221437.45+135228.9 | 8280 | |||
| SDSS J221432.20+134825.4 | 7679 | |||
| SDSS J221437.45+135229.0 | 7915 | |||
| SDSS J221451.49+135543.8 | 35633 | |||
| CGCG 428-060 | 7270 | |||
| LSBC F673-02 | 7293 | |||
| SDSS J221445.84+134449.8 | 8161 | |||
| SDSS J221509.33+134813.3 | 7952 | |||
| SDSS J221424.81+134633.4 | 7263 | |||
| SDSS J221445.10+134304.9 | 8207 | |||
| CGCG 428-059 | 7245 | |||
| SDSS J221514.93+135419.6 | 17810 | |||
| SDSS J221413.65+135044.0 | 120542 | |||
| SDSS J221444.51+135836.6 | 7920 | |||
| LCSB S2633P | 7222 | |||
| SDSS J221414.03+135232.4 | 7276 | |||
| SDSS J221435.72+135822.6 | 8297 | |||
| CGCG 428-054 | 7795 | |||
| SDSS J221508.74+135815.1 | 7799 | |||
| SDSS J221450.80+134051.3 | 7374 | |||
| SDSS J221422.18+134248.3 | 18124 | |||
| SDSS J221527.93+135114.3 | 6634 | |||
| SDSS J221530.83+134912.5 | 115271 | |||
| SDSS J221404.42+134601.3 | 7645 | |||
| SDSS J221414.10+135901.2 | 29751 | |||
| SDSS J221514.34+134045.3 | 8356 | – | ||
| SDSS J221407.71+134230.7 | 7361 | – | ||
| SDSS J221402.08+134424.9 | 120609 | – | ||
| SDSS J221515.54+140059.1 | 7956 | – | ||
| SDSS J221540.36+135255.5 | 7434 | – | ||
| SDSS J221509.85+140230.4 | 8314 | |||
| SDSS J221356.95+135601.3 | 31005 | |||
| UGC 11953 | 7585 | – | ||
| SDSS J221542.30+134855.7 | 7923 |
Note. — Galaxies are sorted by distance from NGC 7237. Galaxies with no Chandra detection or upper limit lie partly or wholly off the detectors. Where objects are named by their 2MASS name in NED we have used the SDSS name instead to make the origin of the data clearer.
Several of the other galaxies in the 3C 442A group, and one or two of the background galaxies, are detected in the Chandra image. As with 3C 285, we measure counts in a aperture with a larger local background region, and these are tabulated in Table 4. Because the response is non-uniform over the field covered by the observations, as a result of the multiple Chandra pointings, we have used the exposure maps to correct all the counts tabulated to be equivalent to those measured at NGC 7237 with the full exposure of the combined dataset, by scaling the measured counts and error up by the ratio of the exposure map value at the position of the source to the exposure map value at the position of NGC 7237. Where there is no detection, an upper limit is tabulated, which is the value determined using Poisson statistics based on the local background count density and then scaled by the exposure in the same way: upper limits are thus higher for regions with shorter exposure. In all cases background-subtracted, scaled counts or limits are rounded to the nearest integer.
The only galaxy other than NGC 7237 bright enough for spectroscopy is NGC 7236. The nucleus of this source is a compact X-ray source with net counts in the 0.5–5.0 keV band (using a source circle and adjacent background). Because these counts are spread over the four observations, we had to bin the spectra to 10 net counts per bin (rather than our usual 20) to give us enough bins for spectral fitting. We then fitted the joint spectrum derived from the four datasets. The spectrum is equally well fitted with a very steep power law or with a thermal (MEKAL) model with keV, both with Galactic absorption, the latter giving for 6 d.o.f. with abundance fixed to 0.5 solar. The unabsorbed bolometric X-ray luminosity in the thermal model was erg s-1. There was no evidence for any variation of the normalization of the spectrum between the datasets. Thus there is no evidence for any AGN-related emission in the center of NGC 7236.
Using the subset of 31 galaxies with km s-1 we determine the mean heliocentric radial velocity of the group to be 7768 km s-1, within 100 km s-1 of the velocity of NGC 7236/7 itself. The velocity dispersion is km s-1, so we would expect a temperature for the intragroup gas of keV using the – relation of Helsdon & Ponman (2000).
Both SDSS quasars in the field (SDSS J221458.45+135344.7, with , and SDSS J221453.84+140022.2, ) are clearly detected in X-rays, with and exposure-corrected 0.5-5.0 keV counts respectively.
3.4 Extended emission
3.4.1 3C 285
Clear asymmetrical extended X-ray emission is visible on arcminute scales around 3C 285 (Fig. 4). Near the nucleus, the elongation is in a similar direction to the elongation of the optical axis of the host galaxy: on larger scales, it extends in the direction of the other nearby galaxies in the group, and essentially perpendicular to the radio source axis. The central region of emission, roughly corresponding to the red-colored region in (Fig. 4, extends for just over (90 kpc in projection) but the X-ray emission to the NW and SE of the main extended region is connected to it by other X-ray emission at per cent confidence, so it is possible that we should view the whole region from SE to NW of the nucleus as forming one physical bar or disk of X-ray-emitting material with varying density, with a size scale of up to (220 kpc). For convenience, and without presupposing any particular physical interpretation, we follow Osmond et al. (2004) and refer to the structure as the ‘ridge’ in what follows.
We extracted a spectrum for the ridge from a rectangle centred on the host galaxy, with the long axis in position angle (measured N through E). This region contains net 0.5–5.0 keV counts, using off-source background, and we found that it was acceptably fitted ( for 10 d.o.f.) with a single-temperature MEKAL model with fixed abundance of 0.35 solar (we adopt this value as the data are not adequate to constrain abundance) and keV. The bolometric unabsorbed X-ray luminosity of the ridge on this model is erg s-1. The residuals for this model show a soft excess which can be modeled as a -keV thermal plasma, also with 0.35 abundance (the temperature is not well constrained, but keV at 90 per cent confidence) without affecting the temperature of the hot component, keV: this gives an improvement in the fit to for 8 d.o.f.. A somewhat less good fit is obtained ( for 9 d.o.f.) if the second component in the two-temperature model is fixed to the temperature (0.64 keV) derived from fits to the group-scale gas (see below): in this case the hotter component has keV. The hotter component is always the dominant one in these fits, and the addition of a second thermal component reduces the emission measure by at most 10%.
Some weak excess emission is also spatially coincident with the lobes of 3C 285 (this is just visible in parts of the lobe in Fig. 4). We extract spectra in two circular regions matched to the E and W lobes, excluding point sources and the region of the ridge described above, and taking a background annulus concentric with the lobes. We find counts in the E lobe and counts in the W lobe: thus only the E lobe is significantly detected. Fitting a power-law model to the E lobe’s spectrum we find a photon index of ( error: for 2 d.o.f.) which is consistent with the expectations from the inverse-Compton process, although of course the errors are large and the spectrum would be equally consistent with a hot thermal model. Assuming the power-law model and best-fitting photon index, the 1-keV flux density of the E lobe is nJy, and, scaling by count rate, nJy for the W lobe. The predicted 1-keV flux density of emission from inverse-Compton scattering of the cosmic microwave background radiation (CMBR) for equipartition between magnetic fields and radiating electrons (using the code of Hardcastle, Birkinshaw & Worrall 1998) is 0.6 nJy for the E lobe and 0.9 nJy for the W lobe: thus, if all the emission from the E lobe is inverse-Compton in origin, the lobe must be somewhat out of equipartition, though not by a particularly unusual amount in the context of FRII sources in general (Croston et al., 2005b).
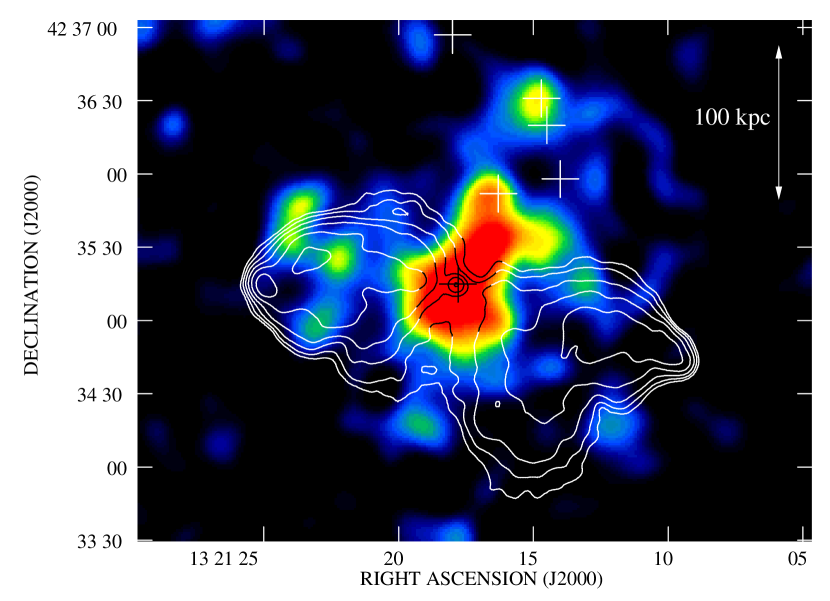
On larger scales, there is some excess emission on (150-kpc) scales even when the ‘ridge’, the lobes and all the point sources (including all those visible on Fig. 1) are masked out. In a source circle with an adjacent background annulus (the largest circular region that can be examined without going off the S3 chip) there are net 0.5–5.0 keV counts. Fitting a spectrum to this region, we found it to be adequately modeled ( for 5 d.o.f.) with a MEKAL model, again with fixed abundance of 0.35 solar, with keV. This temperature is consistent with the rough prediction of the group gas temperature made in §3. We used radial profiling (again masking out the lobes and elongated central region, but not masking the central few arcsec to allow fitting to the central point source), correcting for the small changes in Chandra’s response over this radial distance with an exposure map, to determine rough structural parameters of this extended component, fitting models convolved with the Chandra PSF in the manner described by Birkinshaw & Worrall (1993) (using the PSF models of Worrall et al. 2001) to the small- and large-scale structure. The nucleus is faint enough that distortions of the nuclear PSF as a result of pileup can be neglected. Although the values of are not well constrained (values are preferred) we find a good fit ( for 7 d.o.f.) with a combination of a point source (for the central active nucleus), a small-scale model with , , representing the environment close to the host galaxy, and a large-scale -model with , ( kpc), representing the group. The radial profile and best-fitting models are shown in Fig. 5. The number of counts in the entire model (i.e. assuming spherical symmetry, neglecting the fact that some material will have been removed from the lobes, and correcting for the contribution of the model to the background region) is 0.5–5.0 keV counts: this number is insensitive in our fits to the exact values of and used. Converting to a luminosity using the temperature fitted above, this would correspond to an undisturbed group bolometric X-ray luminosity of erg s-1 (note that this only includes statistical errors, and takes no account of systematics in our assumptions) which would place the system close to the temperature-luminosity relationship for groups in general (e.g., Osmond & Ponman, 2004), given the relatively large uncertainty in temperature. We therefore feel justified in assuming that this faint extended component is the group environment in which 3C 285’s host currently resides. We comment later in the paper (§4.3) on the effect the current radio source is likely to have on this environment.
The temperature determined above for the group-scale gas is clearly cooler than that of the ridge (within the joint 90% confidence limits) for our choices of a fixed abundance of 0.35 solar, which might suggest that the ridge and group-scale gas have a physically different origin. However, if the two components are fitted jointly, each with an independent normalization and temperature, lower abundances are preferred ( at 90% confidence), and for abundances fixed at a low value the best-fitting temperature of the ridge emission comes down to keV, consistent with that of the group gas within the errors: accordingly, acceptable, though poorer, fits are possible to the joint dataset with a single gas temperature around keV with these low abundances. Although we adopt the temperatures determined from our original fits in subsequent analysis, we cannot draw any strong conclusions from the apparent difference in temperature between the two components.

3.4.2 3C 442A
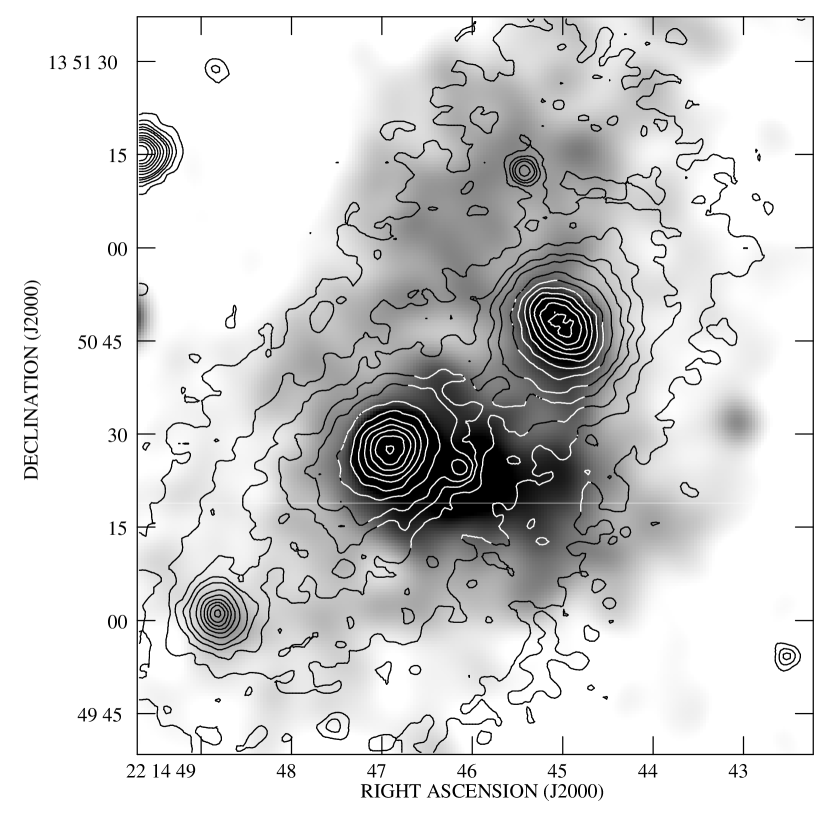
3C 442A shows striking X-ray structure related to the host interacting galaxy pair NGC 7236/7237 (Fig. 6). Both galaxies appear to have ‘tails’ of extended, asymmetrical X-ray-emitting material, presumably radiating thermally (see below), with size scales around (20 kpc). The tail of NGC 7237 lies in position angle (N through E) and that of NGC 7236 in position angle . The tail of NGC 7237 was seen with the ROSAT HRI by Hardcastle & Worrall (1999). As there is no evidence for corresponding emission in the optical image (Fig. 6), where the distorted isophotes of the two galaxies are on smaller scales (Borne & Hoessel, 1988), the tails must be formed not by tidal processes but by some hydrodynamical process such as ram pressure stripping (e.g., Acreman et al., 2003) or Bondi-Hoyle wake formation (Sakelliou, 2000). The X-ray tails are in the direction expected from the compression of the outer optical isophotes, which suggests that NGC 7237 is currently moving towards the NE and NGC 7236 towards the SW (Borne & Hoessel, 1988). Equally striking is the relationship between these tails and the filamentary structure in the radio, as seen in the right-hand panel of Fig. 6. The brightest filament in the center of 3C 442A passes directly through the gap between the two tails (crossing the nucleus of NGC 7236), while the other bright filament in the system runs along the S boundary of the NGC 7237 tail. Given this, together with the qualitative similarity between the shape of the NGC 7237 tail (E-W at the W end, curving to NE-SW at the N end) and those of the two filaments, it seems almost certain that the filamentary structure arises from interaction between the radio plasma and the tails. We return to this point below (§4.5).
We extracted X-ray spectra for the two tails using rectangular regions with adjacent background (excluding emission from the nuclei of both galaxies), and fitted them with MEKAL models with free abundance. This gives a good fit to the NGC 7237 tail ( for 56 d.o.f., keV, abundance solar) and an acceptable though rather poor fit to the NGC 7236 tail ( for 44 d.o.f., keV, abundance ). The bolometric X-ray luminosity of the tail regions with these fits is erg s-1 and erg s-1 respectively.
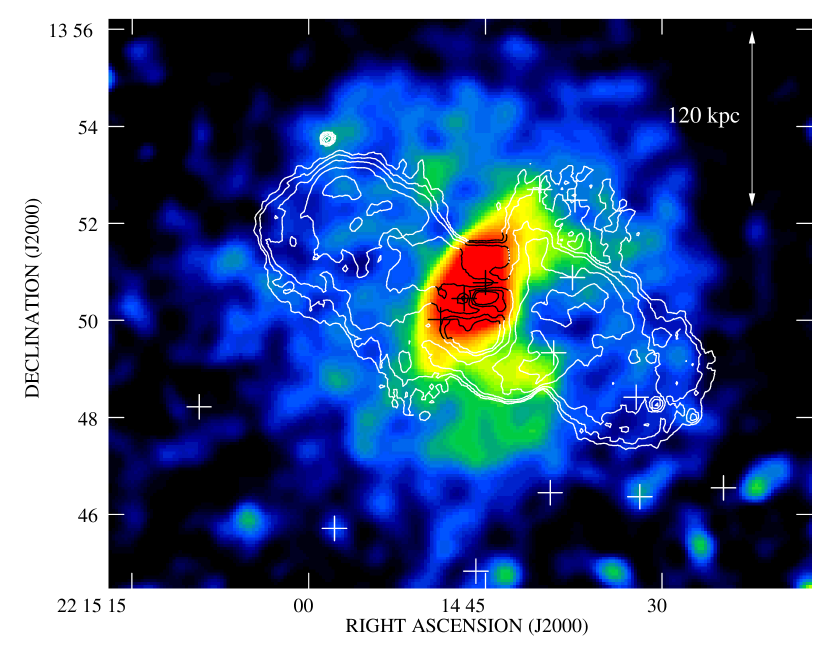
On larger scales, the tails merge into an elongated region that is very similar in appearance to the ‘ridge’ of 3C 285, confirming the result of Hardcastle & Worrall (1999). To illustrate this we masked out all point sources (including the central nuclear point sources) and produced an exposure-corrected image from the combined dataset, extending to the edges of the combined field of view of the observations. Smoothing this with a large Gaussian shows the large-scale structure in the source (Fig. 7). The ‘ridge’ in 3C 442A extends perpendicular to the radio source axis, as in 3C 285, for 4.5 arcmin (150 kpc), again (as in 3C 285) terminating near a bright galaxy that is probably a group member. Excess X-ray emission extends to the N and S of the SW lobe and there is a clear deficit of emission coincident with the lobe itself (and hints of a deficit associated with the NE lobe as well). We extracted a spectrum for the ridge using a rectangle centered on NGC 7237, excluding only the nuclear point sources of the two galaxies. This spectrum clearly contains much of the emission of the two X-ray tails discussed above. Although the spectrum is roughly consistent with the type of model that might have been expected from the results of fitting to the tails, the data are not very well fitted with a single-temperature model ( for 146 degrees of freedom: keV, abundance solar) and the fit is improved if a two-temperature model is used ( for 145 d.o.f., keV, keV: here we fix abundance to 0.3 solar, as determined in the fits above, since it is degenerate with relative normalization of the MEKAL models). This may suggest that the ‘ridge’ is a mixture of cool gas from the tails and hot gas from another source. The bolometric X-ray luminosity of the ridge in these models is erg s-1.
Azimuthally symmetrical emission on scales of is also clearly visible in the image of Fig. 7. As with 3C 285, this seems likely to be thermal emission from a typical group-scale atmosphere. We extracted spectra from a radius source circle around the source, with background taken from an adjacent annulus, using the three of the four observations (OBSIDs 5635, 6353 and 6392) with enough of a distance between the source and the edge of the chips to allow this. Point sources and the rectangular region around the ‘ridge’ were excluded, but the lobes were not, as there is no direct evidence that their X-ray emission is significant. Counts from the background dominate the spectrum (there were net counts but total counts in the extraction region) and the spectra were heavily binned before fitting to obtain adequate signal to noise. Fitting with a MEKAL model we obtain a reasonable fit ( for 39 d.o.f.) but with a poorly constrained temperature, keV. Abundance is not constrained in these fits and we set it to 0.3 solar, matching our results for the ridge. The temperature we determine here is appropriate for a rich group or poor cluster (it is consistent, for example, with the Virgo cluster at keV).
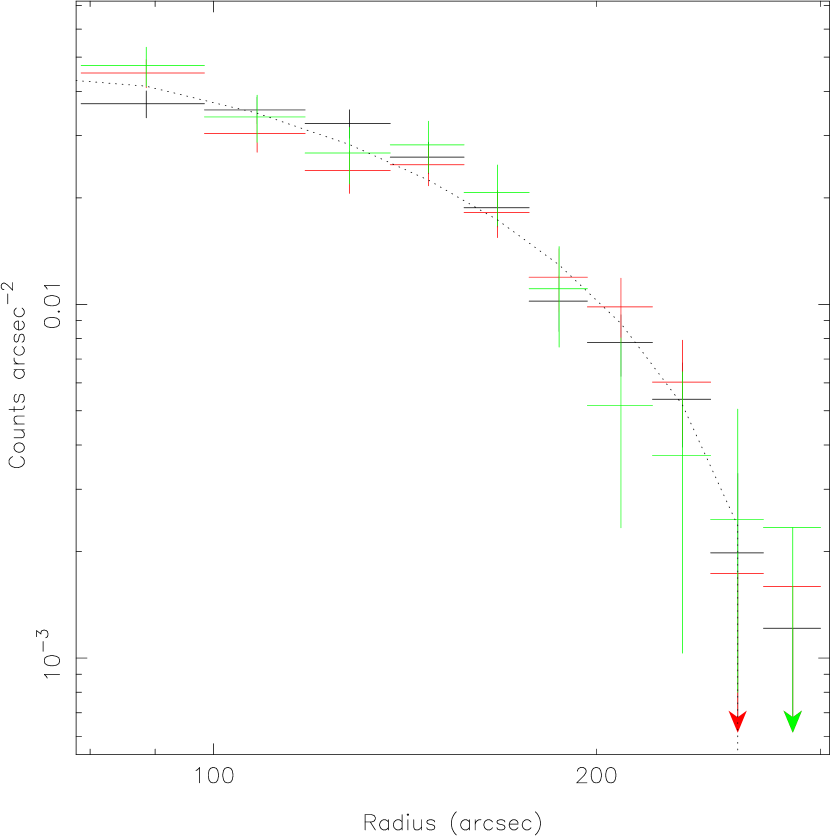
We extracted a radial profile for the large-scale emission, again using the three OBSIDs for which annuli out to could be fitted on the ACIS-I chips and correcting for vignetting using exposure maps. All structure on scales less than , as well as larger-scale emission from the ‘ridge’ and point sources, were excluded from the profile. We fitted models to the profile, and although the restricted angular range of the profile meant that it was not possible to constrain ( values are preferred) we obtained a good fit ( for 27 d.o.f.) with , ( kpc; error for fixed value only). Fig. 8 shows the profile and best-fitting model. Our fits allow us to estimate the 0.5-5.0 keV count rate in the three observations used, extrapolating the model, as s-1, which, assuming the temperature fits above, implies a bolometric X-ray luminosity of erg s-1 (again, errors quoted here come from the uncertainty in the radial profile alone and do not include systematic effects). Given the large uncertainty on derived temperature, this is consistent with the temperature-luminosity relation for the high- end of the group population (or low- end of the cluster population) particularly if the true temperature is closer to the lower end of its 90 per cent confidence range. A lower temperature would be more probable given the velocity dispersion for the group calculated in §4, but we note that groups around radio galaxies of similar luminosity to 3C 442A often have temperatures that exceed those predicted from the temperature-luminosity relation (Croston et al., 2005a).
4 Discussion
In this section we first consider (§4.1) the implications of these observations for the dynamics of the radio sources. We then go on to consider the origin of the asymmetrical ‘ridge’ structures in the two systems, and show (§4.2) that it is unlikely that the radio galaxy can have given rise to these features, implying that the environment shapes the radio source, rather than vice versa. This allows us to construct simple pictures of the history of both systems in terms of the interactions of gas and radio sources. The impact of the radio sources on their group environments may be substantial, and we comment on this in (§4.3). The process of ridge formation and interaction may be important to other sources with central gaps in the radio lobes, and we discuss these in §4.4. Finally, in §4.5, we discuss the gas being stripped from the merging galaxies hosting 3C 442A and its interaction with the filamentary radio structure at the center of the source.
4.1 Dynamics of the radio sources
To discuss the effects of the X-ray emitting material on the radio source it is first necessary to estimate the pressure in the radio lobes. We assume initially that only the radiating electrons/positrons and magnetic field contribute to the internal pressure: it follows (since the sound speed in a relativistic plasma is high) that it is appropriate to quote a single value for the internal pressure. Minimum pressures can then be derived in the standard way for the lobes of both sources given their sizes and flux densities. We use an electron spectrum with and , where is the Lorentz factor of the electrons (): the results are insensitive to the precise choices of the low- and high-energy cutoffs. The electron spectrum has a broken powerlaw form, such that for and for . , the low-energy electron energy power-law index (‘injection index’) is taken to be 2.0 and the value of is determined from a fit to the observed radio lobe spectrum. The filling factor is set to unity (as standard for minimum-energy calculations) and the magnetic field is assumed to be tangled on small scales. For 3C 285, the possible detection of inverse-Compton emission via scattering of CMBR photons from the N lobe gives us a measurement of the pressure, again assuming that only radiating particles and field are present, since it gives a direct constraint on the number density of electrons, which in turn fixes the magnetic field strength given the observed synchrotron emissivity. For 3C 442A, the non-detection of inverse-Compton emission gives us limits on the extent to which the lobe pressures can be dominated by electrons.
We determine pressures as a function of radius in the groups for the detected large-scale thermal components using the method of Birkinshaw & Worrall (1993), assuming spherical symmetry. For the ‘ridge’ components the appropriate assumptions are less obvious. We derive approximate pressures on the assumption of uniform particle density, converting from the xspec MEKAL normalization to density and thus pressure in the standard way. We use the two measured dimensions of the spectral extraction region for the ridge to estimate its size in the plane of the sky. The extension along the line of sight is uncertain, and we consider two cases, treating the ridge either as a cylinder whose long axis is in the plane of the sky, or as a disk viewed edge-on. Because the density depends only on the square root of the volume, these two geometries do not give rise to markedly different densities and pressures.
4.1.1 3C 285
The minimum pressures in the NE and SW lobes of 3C 285 are Pa and Pa respectively (the difference arises because of the fainter flux density and larger volume of the SW lobe). If we assume that all the X-ray flux from the NE lobe is inverse-Compton in origin, its pressure is Pa, where the error comes from the uncertainty on the measured X-ray flux density. This is an upper limit on the pressure if the lobes are electron-dominated.
For the group-scale emission, the extrapolated pressure at the base of the lobes, (15 kpc) in projection from the nucleus, using the best-fitting model, is Pa (the dominant error here is the uncertainty on the best-fitting X-ray temperature: the uncertainties on density from the model fits are far smaller). At the far end of the lobes, (140 kpc) from the core, the thermal pressure is Pa. Formal errors due to the arbitrarily assumed abundance of 0.35 solar cannot be estimated from the data, but pressure would increase by a factor 1.5 if the abundance were 0.1 solar and decrease by a factor 1.5 if it were 1.0 solar, giving a range which is similar in magnitude to that derived from the uncertainties in temperature. Even with the large uncertainties on both internal and external pressure, it is clear that 3C 285 resembles other low-power FRII sources in poor environments (e.g., Croston et al., 2004) as well as more powerful objects (e.g., Hardcastle et al., 2002) in having lobes that are close to being in pressure balance with the external thermal environment. It seems likely that at their far ends the lobes are continuing to expand at subsonic or mildly supersonic speeds (even the maximum possible external thermal pressure only just balances the internal minimum pressure of the NE lobe here), while at the ends closest to the nucleus they can no longer expand transversely.
The pressure in the central ‘ridge’, assuming our best-fitting temperature and a uniform distribution of X-ray emitting gas, is Pa (cylindrical geometry) or Pa (disk geometry), where the errors are again dominated by the errors on our spectrally determined temperature (we use the best-fitting single-temperature model for simplicity) and again extreme variations in abundance could cause pressure variations by a factor 1.5 in either direction. This ridge pressure is in some sense a mean pressure in the region — if there is a density gradient, as the surface brightness suggests, then the pressure will be higher closer to the center and lower at the edges. Thus, the fact that the ‘ridge’ pressure is comparable to or higher than the lobe pressure means that if our radio pressure calculations are correct (i.e. the lobes are not dominated in pressure terms by some non-radiating component such as protons) then we would predict that the lobes must avoid the region of the ridge. This is consistent with the observation (Fig. 4) that the lobe plasma largely avoids the ridge; in fact, the extensions of the lobes at the base to the S (‘wings’) are on scales that suggest that the lobe plasma may be flowing around the ridge. The anticoincidence between the lobe material and the ridge is not perfect, but this is likely to be due to projection, since the jet-counterjet asymmetry in 3C 285 strongly suggests that the radio source is not precisely in the plane of the sky.
4.1.2 3C 442A
For 3C 442A we measure minimum pressures (using the assumptions discussed above) from the outer regions of the lobe only, ignoring the central region where an assumption of uniform plasma filling factor would clearly not be appropriate, so that the pressures measured here are for the parts of the source that lie outside the ridge region on Fig. 7. The minimum pressures we obtain are and Pa for the NE and SW lobes respectively. These are lower than the 3C 285 pressures, since 3C 442A has both lower radio luminosity and a slightly larger physical size.
The external thermal pressures are much larger than the minimum pressures at all points in the radio source. At (25 kpc), the inner edge of the region measured for the NE lobe, the extrapolated pressure (our -model fit does not extend to this radius) is Pa (where the large (90% confidence) errors we quote come entirely from the poorly constrained temperature: the uncertainties from -model fitting are negligible by comparison, though there is a possibility of systematic errors due to the extrapolation, and we assume that large deviations from the abundance fitted to the ridge are not likely). At the edges of the lobes at – (150–180 kpc) the pressures are still Pa, at least an order of magnitude above the radio minimum pressures. Thus, although 3C 442A’s radio structure is not that of a classical FRI radio source, it obeys a tendency that has been known for many years (e.g., Morganti et al. 1988; Killeen, Bicknell & Ekers 1988; Feretti et al. 1990; Taylor et al. 1990; Feretti, Perola & Fanti 1992; Böhringer et al. 1993; Worrall, Birkinshaw & Cameron 1995; Hardcastle, Worrall & Birkinshaw 1998; Worrall & Birkinshaw 2000; Croston et al. 2003; Hardcastle et al. 2005) and rediscovered recently in the context of cluster-center sources (e.g., Dunn et al., 2005) for low-power radio sources to have minimum pressures that lie substantially (often 1–2 orders of magnitude) below the external thermal pressure.
Radio lobes cannot evolve to a state in which they are substantially underpressured with respect to the external medium: both theory (e.g., Kaiser & Alexander, 1997) and observation (Kraft et al., 2003) imply that they are likely to be strongly overpressured initially, and, while the internal pressure should drop as the linear size of the source increases, any drop below the external pressure will cause the external thermal material to expand into the lobe region, compressing the lobe plasma until pressure balance is restored. Observations that suggest that the minimum pressure is below the external pressure therefore imply some additional contribution to the internal pressure, via a large departure from equipartition, a low filling factor, and/or a dominant contribution from non-radiating particles such as protons. A departure from equipartition in the direction of electron dominance is almost certainly ruled out, since at pressure balance it would produce a 1-keV flux density via inverse-Compton scattering of the CMBR of about 90 nJy per lobe, giving a count rate in Chandra observations that would exceed that from the thermal emission from the entire group. In fact, if anything there is a deficit of X-ray emission from the lobes, particularly the W lobe, as mentioned above. As magnetic domination by large factors is not observed in lobes of sources where inverse-Compton emission can be studied (Croston et al., 2005b), we favor a model in which the lobe pressure is dominated by non-radiating particles. In the case of more typical FRI sources it has been suggested that protons from the external thermal material could be entrained and efficiently heated to high energies by the jets (temperatures much greater than that of the external thermal material are required to avoid the detection of this component through its thermal bremsstrahlung). As no jets of the sort seen in normal FRIs are present in 3C 442A, this explanation would only be viable if the lobes were at one time driven by FRI-type jets that are now no longer present, or no longer visible. Alternatively, a population of relativistic protons could have been injected into the lobes along with the radiating electrons (though this is inconsistent with the picture in FRII lobes where an energetically dominant proton population is disfavored: Croston et al. 2005b) or the lobes could have engulfed large regions of thermal material, though again some unknown efficient heating mechanism would be required.
The pressure in the ‘ridge’ in 3C 442A, again assuming uniform density, is Pa (cylindrical geometry) or Pa (disk geometry), so, unsurprisingly, the ridge pressure is equal to or exceeds the extrapolated central pressure of the extended emission, in spite of the lower temperature of the ridge material (here again we are using the best-fitting single-temperature model for the ridge). The pressures derived by Worrall et al. (2007), using a -model fit to the ridge region, are similar. Thus even if the lobe is in pressure balance with the thermal material further out (as it must be, to avoid collapse on a sound-crossing time) the lobe pressure will be lower than the ridge pressure, and the lobe material will be excluded from the ridge region unless it can achieve higher pressures. Fig. 7 shows that material in the lobes, particularly the W lobe, does seem to be avoiding the ridge and to be being pushed out in wings to the N and S, as well as possibly along the line of sight (note the strong radio brightness gradient to the W of the ridge). There is still radio-emitting material in the ridge region, but, as discussed above, the brightest components are in the form of filaments that are likely to be interacting strongly with the small-scale material from the galaxies, and these filaments will have pressures substantially higher than the lobe material as a whole (see below, §4.5, for more discussion of this point).
4.2 Origin of the ‘ridges’ and the evolution of the radio galaxies
Is the ‘ridge’ structure intrinsic to the system, or could it be a result of the interaction of the radio galaxy with an initially spherically symmetrical gas distribution? There are two strong indications that the former is the case: firstly, the ridges align well with the local distribution of galaxies and starlight, which cannot be affected by the radio galaxy, in both 3C 285 and 3C 442A; secondly, in 3C 442A, we observe material leaving the two central bright galaxies via the tails and merging with the ridge. Quantitatively, we can compare the mass in the ridges (or rather in the somewhat smaller spectral extraction regions used to derive temperatures and pressures) with the masses of thermal material affected by the lobes. Using the approximations of uniform density from the previous section, we find that the ‘ridge’ gas masses are in the range to for 3C 285 and to for 3C 442A. Using the -model fits to the larger-scale thermal emission, we find that for 3C 285 the ridge mass is similar to, but somewhat greater than, the total mass of gas that would be present in the lobe regions if the lobes were not there: thus, since only a fraction of the displaced gas would be expected to end up in the ridges, it is essentially impossible for the radio lobes to be responsible for producing the ridge in 3C 285 (though of course here we have to assume that the distribution of the gas in the regions away from the lobes of the radio source now is similar to its undisturbed distribution). The constraints are less strong for 3C 442A, with larger lobes, a denser thermal environment, and a smaller ridge mass: roughly of the displaced gas would be sufficient to produce the observed ridge. However, we know that in 3C 442A at least some of the gas in the ridge did not come via this route, since some of it must have passed through the tails. Some contribution from compressed, displaced gas would help to explain the overdensities seen to the N and S of the W lobe (§3.4.2 and Fig. 7) (although note that these are not included in our mass calculations). We conclude that the ridge structures in these two sources are largely or wholly independent of the presence of the radio lobes.
Our outline models of the evolution of the two radio sources are somewhat different, because we know that the formation of the ridge in 3C 442A is still going on given the observations of tails of gas from the two central galaxies (see §4.5, below) while there is no evidence that there is ongoing gas stripping in 3C 285. 3C 285 thus presents the simpler situation, and we consider it first. In this system we consider it entirely possible that the ridge was present in something like its current configuration before the radio activity began. It is possible, although the data do not require it, that some of the gas that now forms the ridge was stripped from the galaxies that merged to form the current host galaxy of 3C 285. Whether this is true or not, we have seen that the ridge is in rough pressure equilibrium with the external group-scale gas, at least in the center of the group. The timescale for the relaxation of the ridge back towards a spherically symmetrical situation, assuming that the gravitational potential is spherically symmetric, is thus likely to be comparable to the sound-crossing time for the long axis of the ridge, i.e. a few years. If the gravitational potential is non-static, the relevant timescale is the gravitational relaxation time, whch could be longer still. Since the expansion of the 3C 285 lobes is likely to have been supersonic initially (and may still just be supersonic at present) the growth of the lobes to similar size scales can take place in a much shorter time, a few years, and so it seems consistent to suppose that the ridge has not evolved greatly while the lobes have expanded. The expanding lobes would initially be confined by ram pressure and so would expand preferentially into the lower-density group-scale medium. Later, as the lobe internal pressure dropped, the ridge material would push any lobe material out of the center of the group, leading to the situation we now see, where the currently observed ridge is in rough pressure balance with lobes that avoid the central part of the system.
The more complex situation in 3C 442A is discussed in detail by Worrall et al. (2007). In outline, our suggested picture is that here a large, old radio source could well have been present before the start of the ongoing interaction that produced the presently visible ridge material. By stripping and disrupting the hot gas in the center of the group, the start of the interaction/merger between NGC 7236/7 may have terminated the energy supply to the lobes. In any case, the resulting ridge has now largely driven the lobe material out of the center of the group, although the interaction with radio filaments (see §4.5 below) shows that this process is not yet complete. Buoyancy will remove the remaining filaments on a relatively short timescale (unless they are magnetically anchored to one or other of the galaxies), while the ridge may continue to expand, driving the radio lobes ahead of it, as the merger of the two galaxies proceeds to completion.
4.3 Effect of the radio galaxies on the groups
Crudely, the work done on the thermal material by the expanding radio galaxy () may be estimated as , or for pressure balance. This estimate probably gives constraints that are of the right order of magnitude. For 3C 285 the numbers are between and a few J, depending on whether the source is in pressure balance or mildly overpressured at the present time, while for 3C 442A the energy input assuming rough pressure balance at the radio lobes is J. In both cases the energy stored in the lobes is 3 times this value (we assume a relativistic equation of state). These numbers may be compared to the total energy () of the thermal material in the groups (neglecting the ridges) integrated out to the radius of the edge of the lobes (150 kpc for 3C 285, 160 kpc for 3C 442A). For 3C 285 this thermal energy is J: thus the energy input by the lobes is certainly significant, and the total energy input by the source over its lifetime will be sufficient to unbind or move to large radii a large fraction of the currently existing group-scale gas. For 3C 442A, with a denser medium and larger temperature, the thermal energy of the gas is J, so that the impact of the radio source is less relative to the existing thermal energy than in 3C 285: however, again, the total energy input, once the internal energy of the lobes is thermalized, should be very important. Spectral aging (via inverse-Compton losses) puts a limit on the lifetime of 3C 442A of years, while in 3C 285 we expect a lifetime of a few years from the dynamical arguments of the previous section. Thus in both cases the rate of energy input is more than enough (by 1-2 orders of magnitude) to offset the radiative cooling of the group-scale gas given the bolometric luminosities determined in §3.4, although in the case of 3C 442A some of that work probably comes not from the active nucleus but (via the expansion of the ridge) from the dissipation of the energy of the galaxy-galaxy merger.
4.4 Central gaps in radio sources and the presence of ridges
A significant minority of radio galaxies, particularly low-luminosity FRIIs, have radio lobes that are apparently sharply truncated at an inner edge, as first pointed out by Jenkins & Scheuer (1976). The truncation means that in radio images there are well-defined sharp-edged gaps between pairs of radio lobes that typically contain no lobe-related radio emission. Gopal-Krishna & Wiita (2000) have compiled a sample of such objects, and suggest that the central gaps between the lobes are a result of hydrodynamical interactions with a cold thermal medium. While this may be true in some cases, our results show that asymmetrical structures in the hot phase of the IGM can have the same effect. A few other radio galaxies with truncated lobes have X-ray observations, and while some (e.g., 3C 33, Kraft et al. 2007; 3C 227, Hardcastle et al. in prep.) show no obvious signs of asymmetrical X-ray structure on scales comparable to the lobes, at least one other FRII radio galaxy, 3C 401, has both elongated X-ray emission filling between the gap between the lobes (Reynolds, Brenneman & Stocke, 2005), and, crucially, some evidence for elongation of the stellar population in the same E-W direction in Hubble Space Telescope images (Chiaberge et al., 2005), strongly suggesting that the ‘ridge’ structure cannot simply be a result of compression of pre-existing symmetrical gas in the cluster environment of the source. Given the evidence that mergers are important in the environments of FRII sources (e.g., Heckman et al., 1986) it is possible that central gaps are related to interaction of the lobes with pre-existing or developing X-ray structures in many other cases.
4.5 The X-ray tails and the filamentary structure in 3C 442A
‘Tail’ or ‘fan’-like X-ray structures have been seen in other strongly interacting galaxy pairs. The twin tails in NGC 7236/7 (Fig. 6) are very similar in structure and physical size to those seen by Machacek et al. (2006) in NGC 4782/3, which consists of two interacting galaxies of similar mass (one hosting the radio source 3C 278) with a projected separation of around 13 kpc. The tails in the 3C 278 system are overpressured with respect to the surrounding diffuse medium, implying that they originate in ram pressure stripping of the halos of the interacting ellipticals, and Machacek et al. carried out a detailed analysis of the X-ray surface brightness around the leading edge of one of the galaxy profiles to estimate the approximate speed of motion of the galaxy relative to the IGM. Because both tails in 3C 442A have some excess X-ray emission in front of the galaxies, we cannot repeat the Machacek et al. analysis for 3C 442A, but we can make a less rigorous estimate by determining the pressure inside the tails. The tail of NGC 7237 has only a weak surface brightness gradient over the inner 40′′ (20 kpc) of its length, so we model the X-ray emission as a uniform cylinder of length 20 kpc and radius 7 kpc. Our spectral fit to the tail (§3.4.2) then gives a density of m-3 and a pressure of Pa (where the dominant uncertainty comes from the small uncertainty on temperature). To explain why the two dominant galaxies of the group are being ram-pressure stripped now, rather than having being completely stripped at a much earlier stage of the group’s evolution, we must assume that it is their current close interaction that is responsible for the stripping: in this case it is appropriate to compare their pressure and density to the external medium in the ridge, which (as discussed above) we infer to be made up primarily of previously stripped material, rather than the group-center hot gas: in any case, the tails are clearly embedded in the ridge. This comparison gives a density contrast of a factor 3.3–4.5 (depending on the geometry assumed for the ridge, see §4.1.2) and a pressure contrast of a factor , assuming cylindrical geometry since that gives the closest pressure balance with the larger-scale medium. The tails in 3C 442A are thus overpressured and the leading edge must be ram-pressure confined, consistent with the picture of Machacek et al. Following Machacek et al. in adopting the relation of Vikhlinin, Markevitch & Murray (2001) between pressure contrast and Mach number , we find that this pressure contrast implies , or a speed with respect to the ridge material of km s-1. The models of merger dynamics by Borne (1988) imply velocities km s-1, in good agreement with this result. Away from the leading edge, we expect the tails to expand transversely into the medium of the ridge at the sound speed, giving rise to the short, stubby structures that are observed and possibly to the apparent flaring of the NGC 7236 tail (Fig. 6)
If the filaments seen in the radio image are directly interacting with the tails, we expect that the pressure in the radio-emitting plasma will be comparable to the pressures in the tail. The radio filaments are marginally resolved in our highest-resolution radio images, with radii of 1–2 arcsec. We can use observed radio surface brightness per unit length to estimate that they would need to have a radius of (0.09 kpc) for the minimum pressures to be comparable to the thermal pressure in the tails: this is probably inconsistent with the radio data for the southern filament, and almost certainly inconsistent with the data for the northern filament. However, if the pressure in the filaments exceeds the minimum pressure by the factor required in the lobes, then the radius must be , 0.8 kpc, for pressure balance with the brighter tail, which is similar to what we observe in the high-resolution radio images. Thus it is plausible that the filaments are produced by direct interaction with the tails, as suggested by their positions (Fig. 6).
Assuming that there are not strong variations in the ratio of magnetic field to electron energy density, the filaments must be overpressured with respect to the lobes in order to be visible at all, and so must be dynamically evolving structures. A model in which they are associated with the galaxies, which we know to be moving with respect to the radio plasma, is therefore a priori plausible. Since the filaments lie to the sides of the X-ray tails (Fig. 6) they cannot simply be a result of compression of the remaining central radio-emitting plasma by the moving galaxies. It is plausible that they arise in the shear layers between the stripped material in the tails and the external gas.
5 Summary and conclusions
We have presented Chandra observations of the nearby radio galaxies 3C 285 and 3C 442A. The main results of the paper can be summarized as follows.
-
•
The large-scale environments of both sources are groups, consistent with earlier optical results. The groups have similar X-ray luminosities, physical sizes and -model parameters, although the best-fitting temperature for 3C 442A’s group is hotter. Both sources have elongated, 150-kpc scale excess X-ray emission which aligns with galaxies in the group, and which we refer to as the ridge. This excess X-ray emission is coincident with the regions in which there is little or no radio emission from the lobes.
-
•
Using temperatures and pressures derived from the X-ray observations, we have shown that the pressure in the ridges in both sources, within the errors, is equal to or exceeds any plausible internal pressure in the lobes. Thus the ridges are capable of driving, or having driven, the existing radio lobes out of the central regions of the source.
-
•
We have shown that there is direct quantitative evidence in the case of 3C 285 (§4.2), and strong qualitative evidence in the case of 3C 442A, that the ridges are not the result of an interaction between pre-existing gas and the radio source, but must have arisen independently. In 3C 442A, we see hot gas in the process of being stripped from the central interacting galaxies and merging into the larger-scale ridge, suggesting that the ridge has been formed by the stripping of the haloes of the two merging galaxies. In 3C 285, the optical observations strongly suggest that the host galaxy has recently merged with a gas-rich system, and there is a tidal interaction with a more distant galaxy, although there is no evidence that the ridge is currently being fed with hot gas; it is thus possible (though by no means required by the data) that the ridge in 3C 285 also has an origin in galaxy-galaxy interactions. We argue that interaction with similar elongated structures may be responsible for some of the observed central gaps in the lobes of other radio sources. A prediction of this picture is that there will be ridge structures in other groups that do not host large, powerful radio galaxies: so far few of these are known, but the group hosting NGC 5171 (Osmond et al., 2004) may be a good example.
-
•
Our detailed view of the tails of hot gas associated with 3C 442A allows us to estimate the Mach number and speed of NGC 7237 (the host of 3C 442A) with respect to the diffuse IGM. We obtain results consistent with detailed modelling of the merger dynamics (Borne, 1988). The properties of the radio filaments at the center of 3C 442A are consistent with their being formed by interaction with the tails of the two galaxies in the system.
-
•
The X-ray nuclei of the two sources have spectra that are consistent with what is expected for objects of their emission-line type. No convincing evidence for X-ray counterparts to compact radio features, such as jets or hotspots, is found, and we have shown that the previously claimed optical counterpart to the E hotspot of 3C 285 is unlikely to be associated with the hotspot. X-ray emission is detected from the region of jet-induced star formation in 3C 285 reported by van Breugel & Dey (1993).
References
- Acreman et al. (2003) Acreman, D.M., Stevens, I.R., Ponman, T.J., & Sakelliou, I., 2003, MNRAS, 341, 1333
- Allen et al. (2002) Allen, M.G., et al., 2002, ApJS, 139, 411
- Baum et al. (1988) Baum, S.A., Heckman, T., Bridle, A., van Breugel, W., & Miley, G., 1988, ApJS, 68, 643
- Birkinshaw et al. (1981) Birkinshaw, M., Laing, R.A., & Peacock, J.A., 1981, MNRAS, 197, 253
- Birkinshaw & Worrall (1993) Birkinshaw, M., & Worrall, D.M., 1993, ApJ, 412, 568
- Bîrzan et al. (2004) Bîrzan, L., Rafferty, D.A., McNamara, B.R., Wise, M.W., & Nulsen, P.E.J., 2004, ApJ, 607, 800
- Böhringer et al. (1993) Böhringer, H., Voges, W., Fabian, A.C., Edge, A.C., & Neumann, D.M., 1993, MNRAS, 264, L25
- Borne (1988) Borne, K.D., 1988, ApJ, 330, 61
- Borne & Hoessel (1988) Borne, K.D., & Hoessel, J.G., 1988, ApJ, 330, 51
- Chiaberge et al. (2005) Chiaberge, M., et al., 2005, ApJ, 629, 100
- Comins & Owen (1991) Comins, N.F., & Owen, F.N., 1991, ApJ, 382, 108
- Croston et al. (2003) Croston, J.H., Hardcastle, M.J., Birkinshaw, M., & Worrall, D.M., 2003, MNRAS, 346, 1041
- Croston et al. (2004) Croston, J.H., Birkinshaw, M., Hardcastle, M.J., & Worrall, D.M., 2004, MNRAS, 353, 879
- Croston et al. (2005a) Croston, J.H., Hardcastle, M.J., & Birkinshaw, M., 2005a, MNRAS, 357, 279
- Croston et al. (2005b) Croston, J.H., Hardcastle, M.J., Harris, D.E., Belsole, E., Birkinshaw, M., & Worrall, D.M., 2005b, ApJ, 626, 733
- Danese et al. (1980) Danese, L., de Zotti, G., & di Tullio G., 1980, A&A, 82, 322
- Dunn et al. (2005) Dunn, R.J.H., Fabian, A.C., & Taylor, G.B., 2005, MNRAS, 364, 1343
- Evans et al. (2006) Evans, D.A., Worrall, D.M., Hardcastle, M.J., Kraft, R.P., & Birkinshaw, M., 2006, ApJ, 642, 96
- Fabbiano et al. (1984) Fabbiano, G., Miller, L., Trinchieri, G., Longair, M., & Elvis, M., 1984, ApJ, 277, 115
- Fanaroff & Riley (1974) Fanaroff, B.L., & Riley, J.M., 1974, MNRAS, 167, 31P
- Feretti et al. (1990) Feretti, L., Spazzoli, O., Gioia, I.M., Giovannini, G., & Gregorini, L., 1990, A&A, 233, 325
- Feretti et al. (1992) Feretti, L., Perola, G.C., & Fanti, R., 1992, A&A, 265, 9
- Gehrels (1986) Gehrels, N., 1986, ApJ, 303, 336
- Gopal-Krishna & Wiita (2000) Gopal-Krishna, Wiita, P., & 2000, ApJ, 529, 189
- Greenstein (1962) Greenstein, J.L., 1962, ApJ, 135, 679
- Hardcastle et al. (1998) Hardcastle, M.J., Birkinshaw, M., & Worrall, D.M., 1998, MNRAS, 294, 615
- Hardcastle et al. (2002) Hardcastle, M.J., Birkinshaw, M., Cameron, R., Harris, D.E., Looney, L.W., & Worrall, D.M., 2002, ApJ, 581, 948
- Hardcastle et al. (2006) Hardcastle, M.J., Evans, D.A., & Croston, J.H., 2006, MNRAS, 370, 1893
- Hardcastle et al. (2004) Hardcastle, M.J., Harris, D.E., Worrall, D.M., & Birkinshaw, M., 2004, ApJ, 612, 729
- Hardcastle et al. (2005) Hardcastle, M.J., Sakelliou, I., & Worrall, D.M., 2005, MNRAS, 359, 1007
- Hardcastle et al. (1998) Hardcastle, M.J., Worrall, D.M., & Birkinshaw, M., 1998, MNRAS, 296, 1098
- Hardcastle & Worrall (1999) Hardcastle, M.J., & Worrall, D.M., 1999, MNRAS, 309, 969
- Hardcastle & Worrall (2000) Hardcastle, M.J., & Worrall, D.M., 2000, MNRAS, 319, 562
- Heckman et al. (1986) Heckman, T.M., Smith, E.P., Baum, S.A., van Breugel, W.J.M., Miley, G.K., Illingworth, G.D., Bothun, G.D., & Balick, B., 1986, ApJ, 311, 526
- Helsdon & Ponman (2000) Helsdon, S.F., & Ponman, T.J., 2000, MNRAS, 315, 356
- Jenkins et al. (1977) Jenkins, C.J., Pooley, G.G., & Riley, J.M., 1977, MmRAS, 84, 61
- Jenkins & Scheuer (1976) Jenkins, C.J., & Scheuer, P.A.G., 1976, MNRAS, 174, 327
- Kaiser & Alexander (1997) Kaiser, C.R., & Alexander, P., 1997, MNRAS, 286, 215
- Killeen et al. (1988) Killeen, N.E.B., Bicknell, G.V., & Ekers, R.D., 1988, ApJ, 325, 180
- Kraft et al. (2003) Kraft, R.P., Vázquez, S., Forman, W.R., Jones, C., Murray, S.S., Hardcastle, M.J., Worrall, D.M., & Churazov, E., 2003, ApJ, 592, 129
- Kraft et al. (2005) Kraft, R.P., Hardcastle, M.J., Worrall, D.M., & Murray, S.S., 2005, ApJ, 622, 149
- Kraft et al. (2006) Kraft, R.P., Jones, C., Nulsen, P.E.J., & Hardcastle, M.J., 2006, ApJ, 640, 762
- Kraft et al. (2007) Kraft, R.P., Birkinshaw, M., Hardcastle, M.J., Evans, D.A., Croston, J.H., Worrall, D.M., & Murray, S.S., 2007, ApJ in press (astro-ph/0701458)
- Laing (1993) Laing, R.A., 1993, in Burgarella D., Livio M., O’Dea C.P., eds, Astrophysical Jets, Space Telescope Science Institute Symposium Series 6, Cambridge University Press, Cambridge, p. 95
- Laing et al. (1983) Laing, R.A., Riley, J.M., & Longair, M.S., 1983, MNRAS, 204, 151
- Machacek et al. (2006) Machacek, M., Kraft, R.P., Jones, C., Forman, W.R., & Hardcastle, M.J., 2006, ApJsubmitted, astro-ph/0610904
- Mackay (1969) Mackay, C., 1969, MNRAS, 145, 31
- Martel et al. (1999) Martel, A.R., et al., 1999, ApJS, 122, 81
- Morganti et al. (1988) Morganti, R., Fanti, R., Gioia, I.M., Harris, D.E., Parma, P., & de Ruiter H., 1988, A&A, 189, 11
- O’Sullivan et al. (2001) O’Sullivan, E., Forbes, D.A., & Ponman, T.J., 2001, MNRAS, 328, 461
- Osmond & Ponman (2004) Osmond, J.P.F., & Ponman, T.J., 2004, MNRAS, 350, 1511
- Osmond et al. (2004) Osmond, J.P.F., Ponman, T.J., & Finoguenov, A., 2004, MNRAS, 355, 11
- Ott et al. (2005) Ott, J., Walter, F., & Brinks, E., 2005, MNRAS, 358, 1453
- Reynolds et al. (2005) Reynolds, C.S., Brenneman, L.W., & Stocke, J.T., 2005, MNRAS, 357, 381
- Roche & Eales (2000) Roche, N., & Eales, S.A., 2000, MNRAS, 317, 120
- Sakelliou (2000) Sakelliou, I., 2000, MNRAS, 318, 1164
- Sandage (1967) Sandage, A.R., 1967, ApJ, 150, L145
- Sandage (1972) Sandage, A.R., 1972, ApJ, 178, 25
- Saslaw et al. (1978) Saslaw, W.C., Tyson, J.A., & Crane, P., 1978, ApJ, 222, 435
- Stark et al. (1992) Stark, A.A., Gammie, C.F., Wilson, R.W., Bally, J., Linke, R.A., Heiles, C., & Hurwitz, M., 1992, ApJS, 79, 77
- Taylor et al. (1990) Taylor, G.B., Perley, R.A., Inoue, M., Kato, T., Tabara, H., & Aizu, K., 1990, ApJ, 360, 41
- van Breugel & Dey (1993) van Breugel W.J.M., & Dey, A., 1993, ApJ, 414, 563
- Véron (1977) Véron, P., 1977, A&AS, 30, 131
- Vikhlinin et al. (2001) Vikhlinin, A., Markevitch, M., & Murray, S.S., 2001, ApJ, 551, 160
- Worrall & Birkinshaw (2000) Worrall, D.M., & Birkinshaw, M., 2000, ApJ, 530, 719
- Worrall et al. (1995) Worrall, D.M., Birkinshaw, M., & Cameron, R.A., 1995, ApJ, 449, 93
- Worrall et al. (2001) Worrall, D.M., Birkinshaw, M., & Hardcastle, M.J., 2001, MNRAS, 326, L7
- Worrall et al. (2007) Worrall, D.M., Kraft, R.P., Birkinshaw, M., & Hardcastle, M.J., 2007, ApJL, 658, in press (astro-ph/0702411)