A galaxy overdensity at z=0.401 associated with
an X-ray emitting structure of warm-hot intergalactic medium
††thanks:
Based on observations made with the Italian Telescopio Nazionale Galileo
(TNG), operated on the island of La Palma by the Fundación Galileo Galilei
of the INAF (Istituto Nazionale di Astrofisica), and with
the William Hershel Telescope (WHT), operated by the ING, both
at the Spanish Observatorio del Roque de los Muchachos
of the Instituto de Astrofisica de Canarias.
We present the results of spectroscopic observations of galaxies associated with the diffuse X-ray emitting structure discovered by Zappacosta et al. (2002). After measuring the redshifts of 161 galaxies, we confirm an overdensity of galaxies with projected dimensions of at least 2 Mpc, determine its spectroscopic redshift in z=0.4010.002, and show that it is spatially coincident with the diffuse X-ray emission. This confirms the original claim that this X-ray emission has an extragalactic nature and is due to the warm-hot intergalactic medium (WHIM). We used this value of the redshift to compute the temperature of the emitting gas. The resulting value depends on the metallicity that is assumed for the IGM, and is constrained to be between 0.3 and 0.6 keV for metallicities between 0.05 and 0.3 solar, in good agreement with the expectations from the WHIM.
Key Words.:
Intergalactic medium — Galaxies: distances and redshifts — X-rays: diffuse background1 Introduction
Recent cosmological models (Cen & Ostriker, 1999; Davé et al. 2001; Mittaz et al. 2004; Kang et al. 2005) have predicted the existence of large amounts of baryonic matter in the local universe dispersed in the intergalactic medium (IGM). This material, comprising about 1/3 of the total baryonic matter, is expected to be in the form of tenuous shock-heated warm-hot ( K) filaments of gas in moderate overdensities () tracing the dark matter cosmic web (Dolag et al. 2006), the so-called warm-hot intergalactic medium (WHIM). The existence of these structures is believed to be the solution of the “missing baryons problem” (Fukugita, Hogan & Peebles 1998; Fukugita & Peebles 2004), i.e., that finding that many more baryons are observed at high redshift than in the local universe. This is ascribed to the fact that about one third of the ordinary matter in the local universe is yet to be detected, as the density and temperature of the gas in the large-scale filaments make their detection very difficult.
Several effects contribute to making the detection of the X-ray emission from this material quite difficult. The soft X-ray background is dominated by the local hot bubble and the emission of the halo of the Milky Way (see, for example, Bregman & Lloyd-Davies 2006). Both these two contributions are poorly known and it is difficult to disentangled any diffuse extragalactic emission from these bright foreground sources.
Despite these difficulties, several possible detections of this WHIM have been reported by using different techniques (Zappacosta et al. 2002, 2005a; Mathur et al. 2003; Soltan et al. 2005; Soltan 2006). Recently, Dietrich et al. (2005) have demonstrated the correspondence of a dark matter filament, detected by a weak-lensing study, with a diffuse emission in the soft X-ray between two clusters of galaxies.
The only detections of WHIM beyond the local universe (z0.1) have been obtained by imaging in the soft X-ray (kT2keV). In particular, in Zappacosta et al. (2002) we detected a diffuse soft X-ray structure in a high Galactic latitude ROSAT field. Its properties, such as its dimensions (about 7 Mpc), surface brightness, temperature, and gas density, are consistent with the expectations for the WHIM according to the predictions of several models (Croft et al. 2001; Dolag et al. 2006; Roncarelli et al. 2006; Ursino & Galeazzi 2006). In particular, this structure has a spectral energy distribution (SED) consistent with plasma at kT0.3 keV, which is too soft to be ascribed to unresolved AGNs or to clusters of galaxies and is consistent with the spectrum expected for WHIM. Moreover, Zappacosta et al. (2002) demonstrated that an overdensity of galaxies is associated with the X-ray structure, as expected by the models by Viel et al. (2005) and Hernández-Monteagudo et al. (2006). The lack of spectroscopic observations of the galaxies resulted in a poor assessment that the overdensity is really present in the physical space and is not just a projection effect, as well as in a very uncertain measure of the distance of this structure. In fact, the photometric redshift of the galaxies in the overdensity, z=0.450.15, is highly uncertain and is adequate only for putting the WHIM far from the local universe.
Since this is the WHIM detection currently at the largest distance, it was used by Zappacosta et al. (2005b) to constrain the thermal history of the WHIM. The temperature of the WHIM is found to rapidly decrease with redshift, as expected by several models (Cen & Ostriker 1999; Davé et al. 2001). Confirming the existence of such a WHIM and measuring its properties is therefore very important for constraining the cosmological models. Measuring the metallicity of the gas and studying the interplay between IGM and galaxies would be particularly important, as the current cosmological models cannot constrain these two aspects.
With this aim, we observed more than 250 galaxies near the X-ray peak with two multi-object spectrographs to study the galaxy overdensity in greater detail, confirm its existence, measure its redshift, and study the properties of the galaxies. In the next sections we describe the observations (Sect. 2) and the redshift determination (Sect. 2.3). The redshift distribution, the spatial association with the X-ray peak, and the properties of the galaxies are discussed in Sects. 3 and 4.
Throughout the paper we use the concordance cosmology ()=(0.7, 0.3, 0.7).
| Instrument | Mag limits | Number of | Exp. time |
|---|---|---|---|
| () | sources | (min) | |
| WHT/WYFFOS | 20.0–20.7 | 77 | 60 |
| WHT/WYFFOS | 20.7–21.1 | 79 | 100 |
| WHT/WYFFOS | 21.1–21.5 | 81 | 230 |
| TNG/DOLORES | 20.6–21.6 | 32 | 150 |
2 Observations
Target galaxies were selected from the photometry in Zappacosta et al. (2002). We selected galaxies with band magnitudes between 20 and 21.5. This magnitude range was chosen in order to maximize the detection efficiency around z0.45. In fact, galaxies at this redshift are expected to have (Lin et al. 1999), corresponding to =20.2 at z=0.45. The magnitude limit on the bright side is needed to exclude nearby objects, given that galaxies significantly brighter than tend to be rare, while the limit of the faint side is needed not only to exclude more distant galaxies, but also to limit the required exposure time. The galaxy catalog comprises about 3000 galaxies within this magnitude range. About 10% of these were selected to be observed spectroscopically, trying both to maximize the number of galaxies near the X-ray peak and also to sample a large fraction of the region around it. We used two different multi-objects spectrographs (see Table 1) in order to maximize the number of observed objects both in the general field and on the X-ray peak.
2.1 William Herschel Telescope multifiber observations
First, we used the AF2/WYFFOS spectrograph (Watson, 1995) at the William Herschel Telescope (WHT). This instrument is based on a bundle of 160 fibers that can be placed over an area of about 60′ of diameter. The mounting of the fibers does not allow fibers to be placed fibers closer than 25″ from each other; as a consequence, we used this instrument to observe as many galaxies as possible over the whole field. The large dimension of the fiber mounting also limited the number of fibers that can be used together to about 80 per pointing. The fibers have a diameter of 90m , corresponding to 1.6″. For galaxies at z0.4, the radius of this aperture (0.8″) corresponds to 4.3 kpc, to be compared with the half-light diameters of 1-5 kpc for elliptical galaxies and 1-4 kpc for late-type galaxies (e.g., Shen et al. 2003, see also Cresci et al. 2006). For each pointing, 10 fibers are located in empty parts of the field and are used to sample the sky. Pointing and tracking are obtained by using dedicated fiber bundles and are precise to within a few tenths of arcsec. We used a low-resolution grating that provides a wavelength coverage between 4200 and 9300Å with a resolution of R600.
Three fiber settings were used (see Table 1) for a total of 237 galaxies. Target galaxies were split into three magnitude ranges in order to observe all the galaxies with similar magnitude with a similar exposure time, and spend longer time on fainter objects. Exposure times were between 60 and 230 min. For each image, a shorter (between 10 and 30 min) “sky” image was acquired, by displacing the telescope of a few arcsec with the same slit setting. A spectrophotometric standard star was observed through a few fibers to determine the average wavelength sensitivity of the instrument.
Special care was devoted to obtaining the best sky subtraction, which is usually a critical step during data reduction of multi fiber data. We had two possible choices for the sky subtraction. First, we could use the “contemporary” sky spectrum we obtained, together with the target spectra, through the 10 fibers pointed in empty parts of the sky. The sky spectrum was taken in perfect temporal coincidence with the science spectra, but through different fibers. Second, we could use the spectra in the “sky” image taken after the observations. In the latter case we have an estimate of the sky taken with the same fibers as were used for the targets, but the temporal variation of the sky must be taken into account. We decided to use the “contemporary” spectra because the temporal variation of the sky turned out to be dominant. Before subtraction, this sky spectrum was multiplied for a factor, changing from fiber to fiber, obtained by minimizing the residuals on the bright sky lines. This step is needed to correct the spatial variations in the sky brightness and the variations in transparency of the fibers not corrected by the flat field.
The wavelength calibration, another critical step when measuring redshifts with different instruments, was obtained by using images using a Neon lamp. The uncertainty in the wavelength calibration, estimated by the RMS of the residuals of the fit of the dispersion relation, is about 0.6Å.
2.2 Telescopio Nazionale Galileo (TNG) multislit observations
The multifiber observations described above were complemented by other spectroscopic data obtained at the TNG with the DOLORES spectrograph. This instrument uses multi-slit masks to observe up to 30 objects in a field of about 7′9′. As a consequence, in this case we have a lower multiplexing, but more objects can be observed in a small area, in our case near the X-ray peak. Two masks were used, for a total number of 32 galaxies. We used slits with dimensions 1″.120″ and a low-resolution grating, providing a resolution of R in the wavelength range between 4800 and 9500Å. For each mask, an integration time of 150 min was used. The exposure time was split into 2 or 3 images with a small telescope noddling along the slits. These images were used to subtract the sky and to correct for cosmic rays. A second-order sky subtraction was also obtained by spatially interpolating the long-slit spectra across the position of the targets. The wavelength calibration was obtained by using the sky lines and an observation of an Argon lamp. The resulting uncertainty is about 0.8Å.
2.3 Determining the redshifts
The redshift measure is based on the identification of emission lines, absorption lines, and spectral breaks. When an emission line is present in a wavelength range without bright sky lines, it drives the redshift determination.
From the average noise in the spectra, measured on part of the spectra between the sky lines, we estimated that the typical emission line flux for detection is about erg cm-2 sec-1 for both instruments. For the objects with no detected emission line, we tried to estimate the redshift by comparing the observed spectra with the templates in Mannucci et al. (2001) and by using the spectral shape and the absorption lines. In many cases, the 4000Å break, due to the presence of evolved stars, is visible, together with the CaII doublet. To each measured redshift we assign a numeric quality flag, from 1 (certain, because based on unambiguous high-quality spectral features) to 2 (reliable, some of the spectral features have low SNR or coincide with bright sky lines), 3 (uncertain), and 4 (tentative).
Of the 269 observed galaxies, we determined 161 redshifts of quality classes 1 and 2 (101 of quality 1, including 3 QSOs, and 60 of quality 2) and 52 more redshifts of lower quality. One object turned out to be a Galactic star. For the rest of this work, we only use the redshifts of classes 1 and 2 (certain and reliable). The error in the redshift determination can be computed by considering the uncertainties on both the wavelength calibration and the determination of the spectral features. When an emission line is detected, the typical uncertainty in the determination of the line center is below 2–3Å. When the redshift relies on absorption lines, the precision of the determination on the position of the line depends on its equivalent width (EW), and is of the order of about 4–7Å. For all the redshifts of classes 1 and 2 the estimated error is below (corresponding to 8Å for the [OII] line at z0.4).
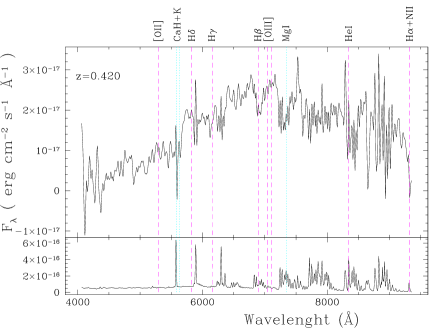
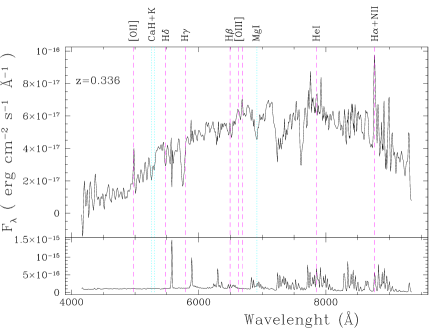
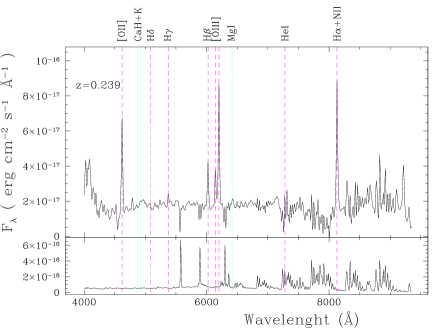
Galaxies have been classified in three classes according to their spectral characteristics: early-type (pronounced 4000Å break, CaII absorption lines with large EW, no emission lines), intermediate type (presence of both 4000Å break and weak emission lines), late type (strong emission lines). Three objects show broad emission lines with a line width larger than 5000 Km/sec, and were classified as QSOs. Fig. 2 shows some examples of the obtained spectra, one for each galaxy type.
The object catalog, together with the measured redshifts and the spectral classifications, is reported in Table 2, published in the electronic version of this paper, and available at VizieR (http://vizier.u-strasbg.fr/cgi-bin/VizieR). The columns of Table 2 report object identification, coordinates, -band magnitude, used telescope, measured spectroscopic redshift, redshift quality flag, and spectral classification.
.
3 Redshift distribution
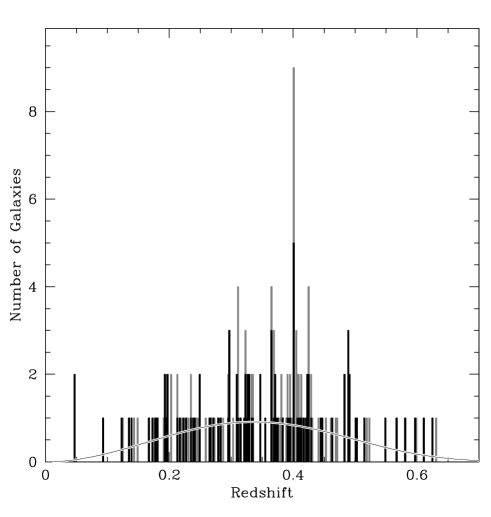
Figure 3 shows the histogram of the measured redshifts with quality classes 1 and 2, excluding the three quasars that have z1.5. The distribution ranges between 0.05 and 0.63 and peaks around z=0.40 as expected for the chosen limiting magnitudes of the sample (see Sect. 2). The bin at z=0.4010.001 contains 9 galaxies, a clear excess with respect to the nearby bins. The width of this bin corresponds to a velocity spread of km/sec and, considering only the contribution from the Hubble flow, to a comoving depth of Mpc.
To estimate the statistical significance of this result, we computed the expected number of galaxies from a universe with a flat distribution of galaxies using the luminosity function (LF) of Lin et al. (1999) and taking into account the volume sampled at the different redshift, the K-corrections (Fukugita, Shimasaku & Ichikawa, 1995), the photometric selection function, and the efficiency in measuring the redshift. The result, normalized to the total number of objects, is shown in Fig. 3 and has a broad peak at z0.35. In the z=0.401 bin, 0.84 galaxies are expected, and this number does not critically depend on the hypothesis of the computation. In particular, it is not possible to significantly increase the expected number of galaxies at z=0.401, since this value is already close to the maximum of the distribution. Using the Poisson distribution, we computed that there is less than probability to have 9 or more galaxies for a random fluctuation when 0.84 are expected. The probability that such an excess occurs in one of the 300 considered bins is, as a consequence, below . An analogous result is obtained when considering only the 98 class 1 redshifts: in this case, 0.50 objects are expected and 5 are observed, with a probability that the signal is due to a statistical fluctuation less than . A similar result is also obtained when restricting the analysis to the 43 galaxies within 6.5′ from the X-ray peak (see next section). In this case, 6 galaxies are found at z=0.401, while 0.22 are expected. Also in this case the statistical probability of a chance signal is below .
As a consequence, this overdensity of galaxies cannot be ascribed to a random fluctuation in the number of galaxies but, on the contrary, is the indication of a definite overdensity of galaxies at z=0.401. Instead, all the other peaks in the redshift distributions are consistent with random fluctuations.
If a large-scale structure is present at this redshift, the galaxies in it could have a velocity dispersion larger than the used bin width of =0.002 or could be dispersed across a larger region. In particular, this is true if the radial dimension of the detected WHIM filament is larger than the dimensions on the plane of the sky. This is likely to be the case, because the WHIM gas is optically thin to its own X-ray emission and, therefore, the apparent surface brightness is actually given by the total projected brightness. For this reason, filaments that “point” in our direction could be easier to be detected. The dispersion of the galaxy radial velocity across this region could be large, either because galaxies still follow the Hubble flow with different velocities or because they have different bulk motions in different points of the filament. Therefore we check if an overdensity is also present with a larger binning. When using a 5 times larger bin (), we find that the bin at z=0.4050.005 contains 17 galaxies, to be compared with 4.2 expected galaxies. In this case as well the probability of a random coincidence is negligible. The overdensity is also present when using a bin with : in this case 23 galaxies have 0.39z0.41, to be compared with the expected number of 8.7, with a probability of less than .
We checked that this overdensity of galaxies at z=0.40 is not due to an observational bias, such as a particular configuration of the main emission lines across the sky spectrum. At this redshift, the main emission lines ([OII], H [OIII], and H) fall at 5222, 6810, 7015, and 9193Å, respectively, and there is nothing at these wavelength that could justify a sharp increase in the redshift determination efficiency. As a conclusion, the large number of galaxies at z=0.401 is due to the presence of a real large-scale structure of galaxies at that redshift.
It should also be noted that Postman et al. (2002) detected as many as 6 galaxy clusters with spectroscopic redshift between 0.38 and 0.40 within 2 deg (about 40 Mpc) from the X-ray peak. This is 1/3 of their total sample, as in this area they detected and spectroscopically confirmed 18 galaxy clusters. As a consequence, the overdensity of galaxies at z=0.40 and the WHIM filament could be linked to a complex cosmological structure present on a much larger scale and traced by the observed clusters.


4 The spatial distribution of the galaxies at z=0.40
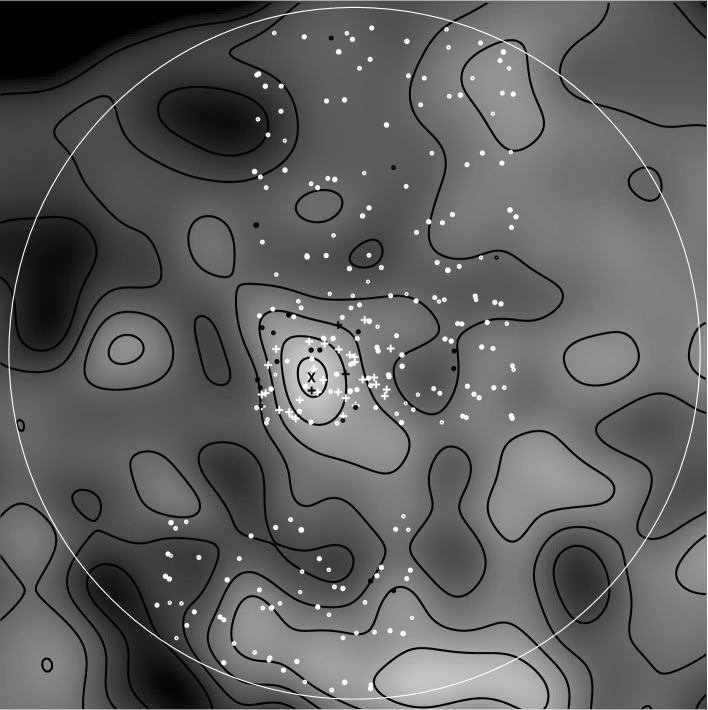
The presence of peaks in the redshift distribution of objects is a very common feature of many redshift surveys (see, for example, Steidel et al. 2000) and is known to be due to the large-scale structure of the universe. In this section we intend to study the spatial distribution of the galaxies belonging to the redshift peak to secure the spatial (and therefore physical) association between the X-ray peak and the galaxy overdensity. Zappacosta et al. (2002) have already shown that there is a good spatial coincidence between the X-ray peak and the galaxy overdensity as revealed both by the total number counts and the photometric redshifts in the range . (see their Fig. 6). In the following, we demonstrate that the galaxies with a spectroscopic redshift z0.4 have a distribution centered on the X-ray peak and, as a consequence, are spatially associated with it.
As seen in Fig. 1, the galaxies in the redshift peak are more spatially clustered around the X-ray peak than the rest of the galaxies, and in the previous section we have already noted that 6 out of the 9 galaxies at z=0.401 are found within 6.5′ from the X-ray peak. The presence of clustering in both the redshift and projected positions can be better seen in Fig. 4, where each one of the two spatial coordinates R.A. and Dec. are plotted as a function of the redshift.
In the following we intend to statistically verify that the 23 galaxies at 0.39z0.41 are spatially clustered and that their cluster center is compatible with the X-ray peak. The computation must take the spatial distribution of all the targets galaxies into account, that are not homogeneously distributed across the field.
If a group of galaxies are spatially clustered, a point of the field exists with the properties of a “center of the cluster”; i.e., the average distance of the galaxies of the selected group from this point must be significantly smaller that the average distance of all the galaxies of the full sample. For this reason we computed the average distance of the 23 galaxies at z0.4 from any given point of the field and normalized the result to the average distance of all the 158 target galaxies with a measured redshift (classes 1 and 2) from this point111As a comparison sample, we do not consider the full target sample because the efficiency of determination of the redshift in the WHT multifiber data decreases sharply with the distance from the field center. This is due to the fact that the WHT PSF degrades with the radial distance and the fraction of light impinging in the 1.6″fiber reduces with the distance from the optical axis, which falls near the X-ray peak. As a consequence, the comparison with the full target sample would reveal a false concentration of the galaxies near the X-ray peak.. This process compares the distribution of the selected galaxies to that of the total sample and therefore takes the distribution of the target galaxies into account. If the considered group of galaxies is not spatially clustered, the average distance from all the points in the field will be similar to that of all the target galaxies; i.e., the ratio between these two distances will be compatible with 1 for all the points in the field. If, in contrast, the selected galaxies are spatially clustered, a point of the field will exist for which this ratio is considerably lower than 1, and this point can be considered to be the “center” of the cluster. Figure 5 illustrates this computation for the 23 galaxies at z0.4. The distribution of the normalized average distance shows (1) the presence of a well-defined minimum of 0.64, meaning that the galaxies at z=0.4 are more clustered than all the target galaxies, and (2) the position of this center turns out to be consistent with the X-ray peak.
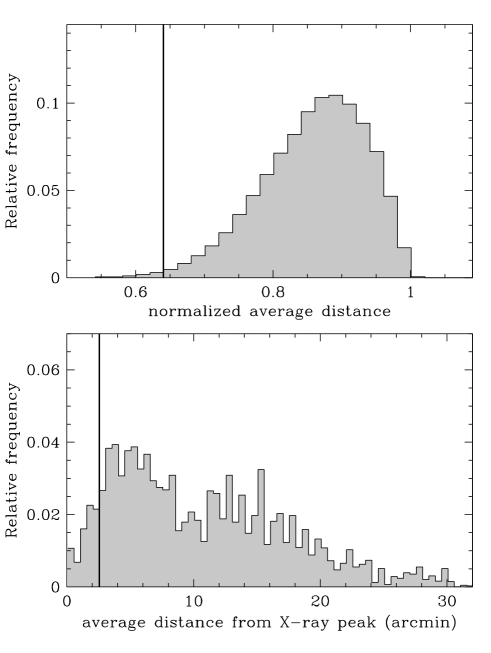
To verify that these results are not due to the target distribution, we have extracted 100,000 random samples of 23 galaxies from the target list and repeated the computation in Fig. 5 to see (1) how many random groups of galaxies appear to be as clustered as the galaxies at z0.4, and (2) what the spatial distribution of the centers is for the random groups showing a high degree of clustering. The results are shown in figure 6. In the upper panel, the distribution of the values of the minima is compared to the value (0.64) obtained for the galaxies at z=0.4. Only 0.7% of the random sample have normalized average distances below this value, demonstrating that (1) the galaxies at z0.4 are not a random sample and that (2) these galaxies show a strong clustering that cannot be attribute to the target distribution. Note that this result is obtained without any assumption on the position of the center, i.e., we are not using the position of the X-ray peak in any way. In the lower panel of Fig. 6 we concentrate on the random samples showing a significant clustering (values of the minimum ratio below 0.75, corresponding to the 10% random galaxy groups showing the highest clustering). For these groups we show the distance of the derived center from the X-ray peak. Only 7% of them have centers closer to the X-ray peak than the galaxies at z0.4, demonstrating that the target distribution allows the potential detection of clustering over the whole field. As a consequence, the clustering of the galaxies at z0.4 around the X-ray peak is due neither to a statistical fluctuation nor to the distribution of the target galaxies.
A simpler and more direct way to statistically verify that galaxies at z0.40 are spatially associated with the X-ray peak consists in computing their average distance from this point and comparing this with the average distance of all the target galaxies. Also, this method takes the irregular distribution of the targets into account, while only clustering around the X-ray peak is considered.
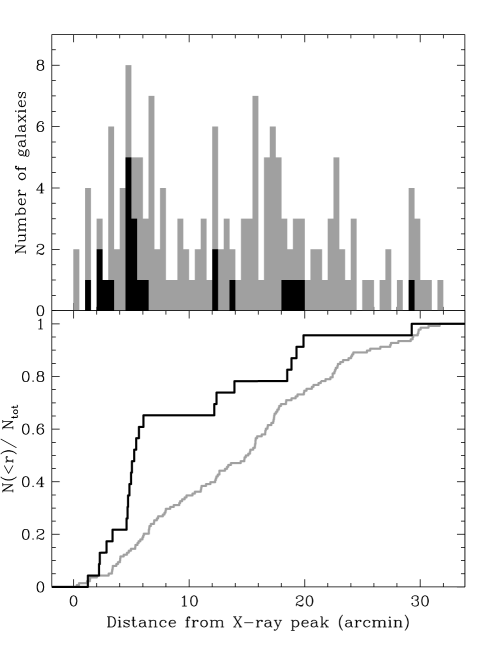
The histogram of the distances from the X-ray peak of the 23 galaxies at z0.40 and of the target galaxies is shown in upper panel of Fig. 7. To compare the two samples of galaxies, we used two statistical tests. First, we used the Kolmogorov-Smirnov test to compare the two cumulative distributions of distances from the X-ray peak, as shown in the lower panel of Fig. 7. From this test we derived that there is only a 0.03% probablity that galaxies at z0.4 have the same spatial distribution of the total sample. This demonstrates a spatial association between galaxies at z0.4 and X-ray peak with a confidence level above 99.97%.
This is also confirmed by a Montecarlo simulation. We computed the average distance from the peak of the 23 galaxies at z0.4, finding 9.9′. Then, we extracted random samples of 23 objects from the galaxies with redshift and computed the average distance from the X-ray peak of these galaxies. The distance distribution of the random samples has a Gaussian shape centered at 13.7′ and with =1.7′. As a result, only 0.2% of the random samples have an average distance from the X-ray peak equal to or below that of the 23 galaxies at z0.4. This demonstrates that this is not a random sample with a confidence level of 99.8%, in good agreement with the Kolmogorov-Smirnov test.
Summarizing, we have demonstrated the existence of a galaxy overdensity at z=0.40 and its spatial coincidence with the soft X-ray emission. The possibility of the X-ray emission being unrelated to the galaxy overdensity cannot be completely ruled out, but the results of the statistical tests make a chance association very unlikely.
Figure 7 shows that most of the galaxies with z fall within 6.5′ (about 2 Mpc at z=0.4) from the X-ray peak. It should be noted that the spatial distribution of our targets is not homogeneous and, in particular, no galaxies were observed more than 5′ to the east and more than 4′ to the south of the X-ray peak. As a consequence, the galaxy structure could be much more extended in these directions, and the observed dimensions of about 2 Mpc must be considered a lower limit to the real projected dimensions.
Zappacosta et al. (2002) have shown that the temperature of the gas emitting the X-ray peak is too low to be due to a cluster. As a consequence, the region must have only a limited overdensity, and we expect that the galaxies have characteristics similar to the field. We cannot estimate the surface density of galaxies at 0.39z0.41, since our spectroscopic sample covers only about 10% of the galaxies in the selected magnitude range. A sensitive indicator of the environment is the spectral classification of the galaxies: in clusters, the fraction of early-type galaxies is roughly 0.6-0.9 (Treu et al. 2003), while in the field it is about 0.4 (Smith et al. 2005). The galaxy classification is present for just 45% of the observed galaxies and, as a consequence, can only provide limited information. Nevertheless, the results do not contradict the expectations, as only 3 out of the 23 galaxies with 0.39z0.41 are classified as early type galaxies. Even assuming that all the 9 unclassified galaxies are early type, the fraction of such galaxies remains below 48%. Limiting this analysis to the galaxies within 6.5′ of the X-ray peak, this fraction is limited to below 8/15=53%.

5 Discussion and conclusions
Zappacosta et al. (2005b) used the observed values of the WHIM temperature to constrain its thermal history and compare it with the results of the theoretical models. Such a comparison is crucial for testing the cosmological models in one of their most important predictions. Unfortunately, the uncertainties in the observations are still very large and the comparison is not yet able to put strong constraints to the model. Moreover, the detection could be dominated by selection effects, in that only the densest and hottest regions are detected, as these provide the brightest X-ray emission.
Our determination of the spectroscopic redshift of the galaxy overdensity associated to the WHIM structure removes one of the main uncertainties in determining of the temperature. As a consequence, we can now refine the temperature determination in Zappacosta et al. (2002) that was based on a very uncertain photometric redshift. In particular, we can now study the dependence of the best-fitting temperature with the metallicity that is assumed for the IGM. This quantity is very poorly constrained by the models (e.g., Viel et al. 2005). Zappacosta et al. (2002,2005) estimated a value of 0.3 keV by assuming an abundance of 0.3 solar, similar to what is measured in the external part of the galaxy clusters (De Grandi et al. 2004). In fact, clusters of galaxies poorly represent the typical physical conditions of the WHIM environment (i.e. temperature, gas, and galaxy density). The outskirts of groups of galaxies can give a fairer approximation of the typical conditions in WHIM environments. Recently Buote et al. (2004) made a measurement of the metallicity in the distant regions (i.e. 20-40% of the virial radius) of the group of galaxy NGC 5044. They measured a metallicity of about 0.1 solar (assuming Anders & Grevesse 1989 solar abundances), significantly lower than the typical values measured in cluster outskirts. In Fig. 8 we present the results of the fitting of the X-ray SED using an APEC plasma code by allowing metallicity to vary between 0.05 and 0.3 solar. A strong degeneracy between metallicity and temperature is obtained, i.e, a decrease by a factor of six in the assumed metallicity corresponds to an increase of a factor of two in the best-fitting temperature. As a consequence, temperatures between 0.3 and 0.6 keV can reproduce the observed SED equally well.
We emphasize that several other uncertainties remain that could significantly change the temperature estimate. The main one is due to the uncertainties in the background subtraction, as described in Zappacosta et al. (2002), which could alter the soft X-ray flux up to a factor of two. Even if the existence of this X-ray excess is robust, its observed spectral shape can be significantly affected by the assumed level of the background. Despite these large uncertainties, it is evident that these values of temperature and metallicity are in good agreement with the expectations for the WHIM (Viel et al. 2005; Davé et al. 2001), while other possibilities have been already discarded by Zappacosta et al. (2002).
In conclusion, a spectroscopic observation of the galaxies projected near a peak of diffuse soft X-ray emission has managed to confirm the presence of the galaxy overdensity associated with this structure and, as a consequence, its extragalactic nature. The temperature of the X-ray emitting gas can be constrained to between 0.3 and 0.6 keV, despite the large uncertainties in the data points and the degeneracy with the metallicity of the IGM medium. The spatial distribution of the galaxies and the temperature of the gas demonstrate that the X-ray emission is due to WHIM at z=0.40 having a temperature of 0.3–0.6 keV.
Acknowledgements.
We are grateful to the TNG staff and to R. Corradi for assistance during observations, and to L. Magrini for useful discussion about data reduction.References
- (1) Anders E. & Grevesse N. 1989, Geochimica et Cosmochimica Acta, 53, 197
- (2) Bregman, J., N., & Lloyd-Davies, E. J., 2006, ApJ, 644, 167
- (3) Buote D. A., Brighenti, F.; & Mathews, W. G., 2004, ApJ, 607, 91
- (4) Cen, R., & Ostriker, J. P., 1999, ApJ, 514, 1
- (5) Cresci, G., Davies, R. I., Baker, A. J., et al., 2006, A&A, 458, 385
- (6) Croft, R. A. C., Di Matteo, T., Davé, R. Hernquist, L., Katz, N., Fardal, M. A., & Weinberg, D. H., 2001, ApJ 557, 67
- (7) Davé, R., Cen, R., Ostriker, J. P. et al., 2001, ApJ, 552, 473
- (8) De Grandi, S., Ettori, S., Longhetti, M., & Molendi, S., 2004, A&A, 419, 7
- (9) Dolag, K., Meneghetti, M., Moscardini, L., Rasia, E. & Bonaldi, A., 2006, MNRAS, 370, 656
- (10) Dietrich, J. P., Schneider, P., Clowe, D., Romano-Díaz, & Kerp, J., 2005, A&A, 440, 453
- (11) Fukugita, M., Shimasaku, K., & Ichikawa, T., 1995, PASP, 107, 945
- (12) Fukugita, M., Hogan, C. J., & Peebles, P. J. E., 1998, ApJ, 503, 518
- (13) Fukugita, M., & Peebles, P. J. E., 2004, ApJ, 616, 643
- (14) Grevesse, N. & Sauval, A. J., 1998, Space Sci. Rev., 85, 161
- (15) Hernández-Monteagudo, C., Trac, H., Verde, L., & Jimenez, R. 2006, ApJ, 652, 1
- (16) Kang, H., Ryu, D., Cen, R., & Song, D., 2005, ApJ, 620, 21
- (17) Lin, H. & Yee, H. K. C., 1999, ApJ, 518, 533
- (18) Mannucci, F., Basile, F., Poggianti, B. M., Cimatti, A., Daddi, E., Pozzetti, L., & Vanzi, L., 2001, MNRAS, 326, 745
- (19) Mathur, S., Weinberg, D. H., & Chen, X., 2003, ApJ, 582, 82
- (20) Mittaz, J., Liey,̆ R., Cen, R., & Bonamente, M., 2004, ApJ, 617, 860
- (21) Postman, M., Lauer, T. R., Oegerle, W., & Donahue, M., 2002, ApJ, 579, 93
- (22) Roncarelli, M., Moscardini, L., Tozzi, P., Borgani, S., Cheng, L. M., Diaferio, A., Dolag, K., & Murante, G., 2006, MNRAS, 368, 74
- (23) Soltan A. M., Freyberg, M. J., Hasinger, G., 2005, A&A, 436, 67
- (24) Soltan A. M., 2006, A&A, 460, 59
- (25) Smith, G.P., Treu, T., Ellis, R. S., Moran, S.M., & Dressler, A., 2005, ApJ, 620, 78
- (26) Steidel, C. C., , Adelberger, K. L., Shapley, A. E.; Pettini, M., Dickinson, M., & Giavalisco, M., 2000, ApJ, 532, 170
- (27) Treu, T., Ellis, R. S., Kneib, J. P. Dressler, A., Czoske, O., Oemler, A., & Natarajan, P., 2003, ApJ 591, 53
- (28) Ursino, E., & Galeazzi, M., 2006, ApJ, 652, 1085
- (29) Viel., M., Branchini, E., Cen, R., Ostriker, J. P., Matarrese, S., Mazzotta, P. & Tully, B., 2005, MNRAS, 360, 1110
- (30) Watson, F. G., 1995, in “Wide Field Spectroscopy and the Distant Universe” the 35th Herstmonceux Conference, Maddox and Aragón-Salamanca, eds., World Scientific, Singapore, 25.
- (31) Zappacosta, L., Mannucci, F., Maiolino, R., Gilli, R., Ferrara, A., Finoguenov, A., Nagar, N. M. & Axon, D. J., 2002, A&A, 394, 7
- (32) Zappacosta, L., Maiolino, R., Mannucci, F., Gilli, R., & Schuecker, P., 2005a, MNRAS, 357, 929
- (33) Zappacosta, L., Maiolino, R., Finoguenov, A., Mannucci, F., Gilli, R., & Ferrara, A., 2005b, A&A 434, 801