Anti-correlated hard X-ray time lags in Galactic black hole sources
Abstract
We investigate the accretion disk geometry in Galactic black hole sources by measuring the time delay between soft and hard X-ray emissions. Similar to the recent discoveries of anti-correlated hard X-ray time lags in Cygnus X-3 and GRS 1915+105 (Choudhury & Rao, 2004; Choudhury et al., 2005), we find that the hard X-rays are anti-correlated with soft X-rays with a significant lag in another source: XTE J1550-564. We also find the existence of pivoting in the model independent X-ray spectrum during these observations. We investigate time-resolved X-ray spectral parameters and find that the variation in these parameters is consistent with the idea of a truncated accretion disk. The QPO frequency, which is a measure of the size of truncated accretion disk, too changes indicating that the geometric size of the hard X-ray emitting region changes along with the spectral pivoting and soft X-ray flux. Similar kind of delay is also noticed in 4U 1630-47.
1 Introduction
Galactic black hole candidate sources provide an unique platform to study the behavior of ambient accreting material in intense gravitational fields. The spectral and timing analysis of accreting black hole sources gives information about the underlying physical phenomenon and dynamics of the accretion disk, which in turn helps in unfolding the nature of the central black hole. The emission properties of the accreting black holes are often classified and constrained in terms of different spectral states (Esin et al., 1997). Timing analysis too plays a key role in uncovering the geometry of the disk, especially the study of Quasi Periodic Oscillations (QPO). In a recent review, McClintock & Remillard (2004) used both spectral and timing information to constrain the physics and geometry of the accretion disk. Canonically speaking the different spectral states are different permutation of two spectral components i.e thermal component (soft photons), presumably originating from a optically thick disk and Comptonized component (hard photons) which is thought to be the result of inverse Compton scattering of soft photons by high energy electrons (Shapiro et al., 1976; Sunyaev & Titarchuk, 1980). The coupling of jet and the accretion disk in various spectral states of different galactic black hole systems (Fender et al., 2005, 2006) provided a new insight to the accretion disk geometry and there are attempts to explain some parts of the observed X-ray spectrum as arising from jet emission (Vadawale et al., 2001; Markoff & Nowak, 2004; Markoff et al., 2005).
The bulk of the X-ray emission, particularly in the Very High State (or the Steep Power Law state), however, is thought to be as due to Comptonization (see Done and Kubota 2006 for a comparison of Comptonization and synchrotron models). The exact mechanism and geometry of this Comptonization process, though, are still to be revealed. There are various models to account for the presence of the hard component in broad band spectrum of the galactic black hole candidates and the most favored one is hot quasi-spherical cloud inside a truncated disk (Zdziarski et al., 2002). Among different theoretical models, Advection Dominated Accretion Flow (ADAF) (Narayan & Yi, 1994) and Two Component Accretion Flow (TCAF) (Chakrabarti, 1996) predict that the disk truncation radius determines the segregated spectral states in Galactic black hole sources.
Recently two sources, Cyg X-3 and GRS 1915+105 (Choudhury & Rao, 2004; Choudhury et al., 2005) provided support for the truncated accretion disk scenario on the basis of the detection of an anti-correlation between soft ( keV) and hard X-ray photons ( keV), delayed by a few hundred seconds. These sources also showed a pivoting behavior in the model independent spectrum. Here the hard lag implies that hard photons are lagging to the soft photons on timescales of 10s and 100s. The anticorrelated hard lag is defined as an opposite and delayed change in hard flux corresponding to change in soft flux. The anti-correlated delay (Choudhury et al., 2005) in GRS was discovered in the variability class when the source was in the spectral state C (Belloni et al., 2000), which is also classified in the literature as the Steep Power Law (SPL) state (McClintock & Remillard, 2004) or the Very High State (VHS) or the Hard Intermediate State (HIMS). The wide band X-ray spectrum shows an additional spectral component (apart from the canonical disk black body and a thermal Compton spectrum), which can be modeled as an additional power-law (Rao et al., 2000) or as due to Comptonization from electrons having non-thermal power-law energy distribution (Zdziarski et al., 2001). The recent discovery of a ‘jet-line’ in the hardness-intensity diagram of black hole sources indicating the onset of superluminal jet emission during a particular region of HIMS (Fender et al., 2004) underlines the importance of understanding the detailed accretion disk geometry in such states. In this perspective, using the hard X-ray delays and constraining the parameters of a truncated accretion disk has the potential of unraveling the elusive disk-jet connection.
Recently Done & Kubota (2006) have made a detailed wide-band spectral fitting to the VHS state of the source XTE J1550-564 during the 1998 outburst and have obtained different geometric configurations of the thermal disk and the corona. They find that, compared to the High Soft State of the source, the thermal disk has either reduced its size or changed its emission properties (or both) and the geometry of the corona is constrained to be within a truncation radius.
We have searched for anti-correlated hard X-ray delays in this source for confirming the robustness of truncated accretion disk paradigm. 4U 1630-47 is another source which shows a behavior pattern similar to GRS 1915+105 and Cygnus X-3 and we have searched for delays in this source too.
XTE J is a well known microquasar with an identified optical companion star of late-type subgiant (G8 IV-K4 III). The mass of the black hole is and the binary inclination is (Orosz et al., 2002). It was discovered by the All Sky Monitor (ASM) onboard the Rossi X-ray Timing Explorer (RXTE) on 1998 September 7 just after an outburst which began on 1998 September 6 (Smith et al., 1998). A few days later (1998 September 19), a radio flare associated with a strong X-ray flare was detected, revealing a relativistic jet when the X-ray source was in the very high state (VHS) (Hannikainen et al., 2001). A steady jet was discovered during the 2000 outburst but this time the source was in the low-hard state (Corbel et al., 2001). Correlation studies between quasi periodic oscillations (QPOs) in the range of Hz and spectral parameters (multi-temperature black body disk and power-law component) indicate that the production of QPO is intimately tied to both disk and power-law components and is linked with the overall emission properties of the source (Sobczak et al, 2000). Detection of the high frequency QPOs ( and Hz) (Remillard et al., 1999, 2002) in XTE J1550-564 and GRS 1915+105 ( Hz) (Belloni et al., 2006) and the relationship of the 1 – 15 Hz QPO with the spectral parameters indicates an identical accretion disk geometry in these two sources (Markwardt et al., 1999).
Since its discovery by Uhuru in 1972, 4U , a recurrent X-ray transient (Jones et al., 1976) located in the direction of the Galactic center, has shown all the different types of spectral states and Power Density Spectrum (PDS) like other black hole binaries and hence it is considered as a strong black hole candidate source (McClintock & Remillard, 2004). The light curves of 4U 1630-47 show different types of high amplitude variability, classified in four different classes (Tomsick et al., 2005) but the diversity of these variabilities is less than that seen in the extremely variable source GRS 1915+105 (Belloni et al., 2000). On several occasions a very high disk temperature (Tomsick et al., 2005) as well as polarized radio emission were seen in 4U (Hjellming et al, 1999), indicating the presence of relativistic jet emission, similar to the superluminal radio emitting jets seen GRS 1915+105.
Here we report the discovery of anti-correlated hard X-ray delay between soft and hard energy photons for both these sources. Paramount importance is given to know the exact variation in the physical parameters and hence unfolded spectra are compared with the one from GRS 1915+105 obtained during the observation of delayed hard X-ray emission. Spectral study is also supported by a minute change in centroid frequency ( 0.1 Hz) of the fundamental and the first harmonic of the Quasi Periodic Oscillations (QPO) in XTE J.
2 Data reduction and Analysis
We have used data from observations using Proportional Counter Array (PCA) (Jahoda et al., 2006) and High-Energy X-ray Timing Experiment (HEXTE) (Rothschild et al., 1998) aboard the RXTE satellite to carry out a detailed temporal and spectral analysis. Done and Kubota (Done & Kubota, 2006) have analyzed simultaneous ASCA and RXTE data on XTE J and found evidence for an inner corona coupled energetically to the disk. We have chosen the RXTE observations used in that work to look for anti-correlated delay. There were five pointed observations on three occasions, 1998 September 12, 23 and 1999 March 17 (MJD , MJD and MJD ). The X-ray spectrum from the second data set shows strongly Comptonized VHS (Kubota & Done, 2004). We have used standard 2 data and have followed all the procedures for data filtering, background and deadtime corrections (the data was obtained from all the PCUs which were ’on’). HEXTE detectors switch between background and source positions. During our observations two sided rocking with 32 seconds rocking interval was selected. We used FTOOLS command ”hxtback” to separate background and source data. We created source and background lightcurves using a binsize equal to the rocking interval (32 s) and applied the dead time correction to both the light curves. For the timing analysis, we rebinned the lightcurve by a factor of 4 (128 s), thus ensuring that the source and background counts are averages of two rocking intervals. For the present work, we use data only from HEXTE cluster A, which has a better sensitivity than HEXTE cluster B.
To take care of the calibration uncertainties, systematic errors are added to the PCA spectrum. We have obtained the Power Density Spectrum (PDS) for both the sources from generic bin mode and single bit mode covering keV and keV energy band with 1 ms bin size. Tomsick et al. (2005) have presented a detailed analysis of RXTE data during two years of X-ray activity of 4U. We have chosen observation from MJD when 4U was in the outburst state and the data is not contaminated by nearby sources. Generally it was found that during these observations PCU 2 was ‘on’ for a maximum duration and hence we have used PCU 2 for obtaining the light curves and the spectra. The data reduction and analysis were done by using HEASOFT (V 5.3.1)111http://heasarc.gsfc.nasa.gov/lheasoft/RelNotes_531.html, which consists of mainly FTOOLS (V 5.3.1), XORONOS (V 5.21) and XSPEC (V11.3.1).
3 Hard X-ray delay
During these observations, XTE J1550-564 was in an outburst state and spectrally in the very high state or steep power law state (VHS or SPL). After obtaining the background subtracted lightcurve, we started with cross correlating the soft X-ray light curves ( keV) and hard X-ray light curves ( keV) using the crosscor program. The crosscor program performs cross correlation on two simultaneous time series by using a Fast Fourier Transform algorithm and the output is given as the cross correlation value as a function of time delay. The cross covariances are obtained by normalizing the cross correlations by dividing by the square root of the product of the number of good new bins of the pertinent lightcurves. To calculate the observed delay and their uncertainties, we have fitted inverted Gaussian function to the anti-correlated hard delay part of the cross-correlation. Out of five observations two clearly show anti-correlated hard X-ray delays of the order of a few hundred seconds (see Table 1). Similarly 4U was also in an outburst state and spectrally mostly in SPL (steep power law) state, IS (intermediate state) and spending a least amount of time in TD (thermal dominated) state. Performing similar procedure of timing analysis we found that majority of them show a sharp positive correlation with no measurable delay except for a few obsids which show some anti-correlated hard delay. For one observation (ObsIds 80117-01-01-01, which is showing minute but considerable signature of delay), we have obtained the background subtracted light curves in different energy bands ( keV, keV… keV) and found an anti-correlated hard delay ( sec) between keV and keV energy band, and this particular observed delay was further supported by HEXTE analysis. The cross-correlation values, as a function of delay, is shown in Figure 1, along with the relevant light curves. To emphasize the reality of the delay seen in 4U, analysis results from HEXTE observations are shown. The observed delays are given in Table 1, along with the 90% confidence errors (obtained by the criterion of = 2.7, for an inverted Gaussian fit to the data).
4 Spectral evolution
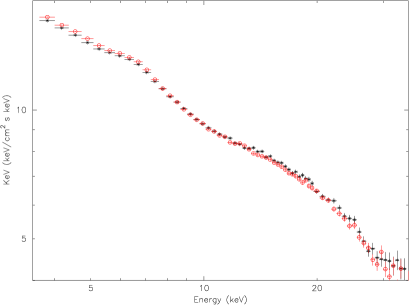
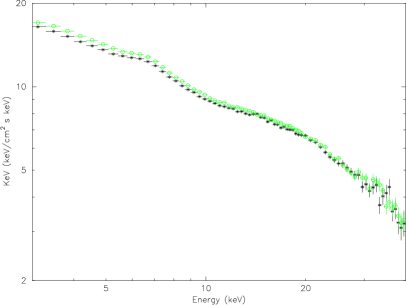
Since the anti-correlated hard X-ray delay could cause pivoting pattern in the spectrum in a single observation as observed in Cyg X-3 and GRS 1915+105 (Choudhury & Rao, 2004; Choudhury et al., 2005), we divided the first (ObsId 30191-01-09-00) and second (ObsId 30191-01-09-01) observations of XTE J in two parts and extracted the spectra covering keV energy band. The observed spectra are shown in Figure 2. Inspection of the model independent spectra for the first observation (Figure 2a), reveals a sharp pivoting around keV. In the case of second observation a marginal pivoting around 20 keV is observed. It is also noted that for the second observation the spectra merge above 20 keV, similar to that observed in GRS 1915+105 during MJD 50729 (Choudhury et al., 2005, see Figure 3). We argue that the pivoting/marginal pivoting in the spectrum is due to hard lags in the truncated accretion disk scenario. Koerding & Falcke (2004) showed that the lag patterns in Cyg X-1 can be reproduced with a simple pivoting power law.
To know the change in the spectral parameters during these observations, we have extracted the spectrum at two different parts of the observation (initial and final seconds of the light curve). We have used a multicomponent model which includes disk blackbody (Makishima et al., 1986) plus thermal Comptonization model (Zdziarski et al., 1996, thcomp) plus power-law to take care of high energy non-thermal photons (diskbb+thcomp+powlaw) and a smeared edge to mimic reflection component (Ebisawa et al., 1994), along with a narrow Gaussian line. Since the spectral resolution of PCA is not good enough to constrain all the parameters, we have closely followed the spectral model derived from the superior ASCA+RXTE simultaneous data (Done & Kubota, 2006). Further, the value of absorption column density, power-law index and Gaussian line energy were frozen (NH=, = and E=6.5 keV). The source was in strongly Comptonized very high state during these observations typically showing a disk temperature keV, and kTe keV. The unfolded spectra are shown in Figure 4 and the derived parameters are given in Table 2. We confirm that leaving the power-law index and absorption column density free, the values of other parameters are not changed (but less constrained).
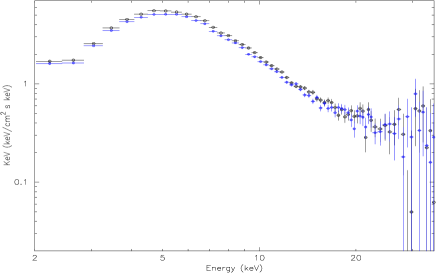
For 4U 1630-47, we have extracted the spectra in the energy band 2.0 -
50.0 keV at two different parts of the lightcurve corresponding to
the observation 80117-01-01-01. The model independent spectra show
marginal pivoting around keV (see Figure 3). We have
fitted the spectra of these two parts with a model which includes disk
blackbody plus thermal Comptonization model and found that this model
gives unacceptable fits. Hence we unfolded the spectra using ”diskbb+Power-law”, which gave reliable values as shown in Table
4. The change in disk temperature is quite low and may
not be high enough to describe the marginal pivoting pattern in the
spectrum. The spectral parameters indicates that the source is in TD
(thermal dominated state), in which the disk extends close to the last
stable orbit. We speculate that the delay may be attributed to marginal
change in the power law index.
We have also analyzed one of the observations (MJD 50480) of GRS which show a delay of the order of s. To unfold the spectrum we have used the same multicomponent model that was used for XTE J1550-564 (see Figure 5). Three parameters are frozen, NH= (Belloni et al., 2000), power law index and Gaussian line energy = 6.5 keV. It can be seen from Table 3 that the both electron temperature and thcomp normalization has changed between two parts of the observation, and cause a sharp pivoting point at around keV (Choudhury et al., 2005, see Fig 3).
We have calculated the unabsorbed disk flux (soft X-ray flux) and unabsorbed thermal Comptonization flux (hard flux) for both XTE J1550-564 and GRS 1915+105 observations (Table 7). In all the observations, the soft X-ray flux is changing reflecting the degree of variability of the accretion disk.
It can be noticed from the derived spectral parameters that the quality of data is not sufficient to discern the changes in all the parameters. To investigate the most dominant change in spectral parameters, we have investigated the minimum set of parameters that definitely show a change, as demanded by the data. For this purpose we fitted the part A (first part of the respective observation) and part B (second part of the respective observation) spectra simultaneously keeping all the parameters tied to spectral parameters obtained by fitting only the part A spectrum. This resulted in very high reduced value (eg. for ObsId 30191-01-09-00, see Table 5), suggesting a spectral change between the two parts of the observation. Then thcomp normalization (Nth) of these two parts were allowed to vary independently. The F-test values given in Table 5 suggest that fit improved drastically. Then we allowed two other parameters to vary, diskbb normalization (Ndiskbb) and kTin, one by one. The fit again improved significantly in this process. When we continued this method for all the spectral parameters, no considerable improvement in the fit was observed. Hence, F-test analysis suggest that normalization and disk parameters vary between two parts (A and B) of a single observation.
5 Quasi Periodic Oscillations
XTE J1550-564 and 4U 1630-47 show prominent QPOs in their Power Density Spectra (PDS) (Remillard et al., 1999; Tomsick et al., 2005). To unveil the hidden physical phenomenon behind the anti-correlated hard X-ray delay, we have obtained the PDS of the same individual observation at two ends (300s each; part A and B) of the corresponding lightcurve binned at 1 ms in the energy range keV(B_500us_4A_0_49_H) and keV (SB_125us_50_249_1s) and normalized the output to squared fractional rms (with the white noise subtracted). The spectral study of 4U shows that the source is in TD state which is further supported by the absence of QPO feature in the PDS whereas XTE J1550-564 shows strong signature of QPO with one harmonic when the source is in strong VHS state. To quantify the nature of QPO parameters, we fitted a powerlaw to the continuum and two Lorentzian function to the QPO profile (see Table 6). In the PDS of energy band keV, we found a harmonic which is not present in the PDS of keV.
The PDS of XTE J1550-564 for ObsId 30191-01-09-00 (Part A and B) are shown in Figure 6, separately for 2 – 20 keV (Figure 6a) and 20 – 50 keV (Figure 6b). For clarity, part B data are shifted down by a factor of 2. The best fit models are shown as continuous lines and the residuals (as a ratio of data to model) are shown at the two bottom panels of each figure, respectively for part A and B. The fitted centroid frequencies are shown as vertical lines. Similarly, PDS for the same source for ObsId 30191-01-09-01 are shown in Figure 7. Clear shifts are seen in the centroid as well as peak frequencies, particularly in the data for the second ObsId.
In both the
observations clear and consistent change in the centroid frequency of the
fundamental and the first harmonic of QPOs are recognized. The PDS of
keV energy band reveals that in one case the fundamental centroid
frequency shows no significant shift and in another case significant
amount of change is quite observable. In a single pointed observation the
centroid frequency is increasing in both the fundamental and harmonic
QPOs clearly suggesting that the inherent source size (Compton cloud)
is decreasing giving rise to geometrically and physically larger disk
(Chakrabarti & Manickam, 2000). The firm and undeniable change in
fundamental and harmonic centroid frequency demonstrates that there is
small but effective degree of variation in physical scenario of the
accretion disk and favors a truncated accretion disk.
6 Discussion
Detection of anti-correlated hard delay in Cyg X-3 and GRS 1915+105 (Choudhury & Rao, 2004; Choudhury et al., 2005) suggested dynamical evidence of truncated accretion disk. We anticipated the same physical scenario in two other sources XTE J1550-564 and 4U 1630-47. The aim of this paper is to quantify the variation in the spectral parameters responsible for the hard X-ray delay which in turn constrains the geometry of the accretion disk. Proper inspection of the model independent spectrum indicates that, even a marginal pivoting can account for the hard X-ray delay.
During our observations the sources XTE J1550-564 and GRS 1915+105 were in the VHS. Spectral analysis of these two sources suggest that the soft and hard spectral components varied significantly, along with a strong indication of a change in the inner disk temperature. We noticed a nominal change in the thcomp parameters in both these sources. These changes are indirectly connected to the hot electrons putative to the corona. In the case of GRS 1915+105, the increase in the electron temperature is very significant.
We have also calculated the unabsorbed bolometric flux for both disk (soft flux) and thermal Comptonization components (hard flux) (shown in Table 7). For both the observation of XTE J1550-564 we found that whenever soft flux changes during the pivoting of the spectra, an opposite change in hard flux occurs. Similarly, we noticed that in GRS 1915+105, the soft flux increases during the pivoting and an opposite change in the hard flux is observed. This indirectly implies that there is a change in either the geometry or physical properties of the accretion disk and the corona. The time scales of delay observed in these two sources suggest property of disk and corona changes on viscous time scales. The observed delay is the readjustment time scale of the thermal disk as well as inner Comptonizing cloud. Since one requires a truncated accretion disk to convert soft X-ray photons to hard X-ray photons via Comptonization process and hence the extent of the truncation radius decides the fate of the pivot point or change in the respective flux.
The power density spectra of the source XTE J1550-564 clearly shows a minute change in the centroid frequency of the fundamental and the harmonic QPOs. This small change in the centroid frequency of QPOs observed in XTE J indicates the physical aberration of corona on a timescale of 1000 s. There are various models (Titarchuk & Fiorito, 2004; Chakrabarti & Manickam, 2000) which explain the production of QPOs and these models seem to converge to the fact that the origin of QPOs is inherent to the compact corona region close to the black hole. In both the observation of the source XTE J1550-564, the change in the centroid frequency is strongly correlated to change in the soft and hard fluxes. In both the observations, the centroid frequency is increasing along with the increase in soft flux and decrease in the hard flux (see Table 7). In the case of GRS 1915+105, the hard flux is increasing along with a decrease in the soft flux showing corresponding change in the QPO frequency. The proportional change in the QPO centroid frequency with hard and soft fluxes strengthens the idea that during these hard lag observations there is a inward/outward movement of the Compton cloud.
The second observation of XTE J1550-564 (ObsId 30191-01-09-01) shows the most well determined delay (37513 s) and the most significant shift in the QPO frequency. Let us assume that the truncation radius, Rc, is at 10 Schwarzschild radii (RRS), consistent with the 300 km derived for the disk-corona coupling radius (Done & Kubota, 2006). The observed 5% increase in the QPO frequency, f, corresponds to a 15% decrease in the truncation radius, by assuming a Lense-Thirring precession model for the QPO generation (Done & Kubota, 2006; Stella et al, 1999) which predicts f R. This decrease of 15% in Rc is possibly due to an increase in the disk accretion rate by 20%, if Rc varies as an inverse power of mass accretion rate through the disk with 0.65 – 0.85, as suggested by McHardy et al. (2006). The increase in the disk luminosity would be about 35% (scaling directly as the accretion rate and inversely as Rc, as would be the case for a standard thin disk), which is very close to the observed variation of 33% (see Table 7). A corresponding decrease in the Compton flux will occur after a delay corresponding to the Compton cooling time scale for the plasma confined within Rc. By assuming similar properties of accretion disk as seen in GRS 1915+105 during the inner-disk evaporation, a Compton cooling time scale of several hundred seconds (Chakrabarti & Manickam, 2000) can be derived, similar to the observed delay of 375 s.
On the other extreme, 4U 1630-47 shows significant anti-correlated hard delay in thermal dominated state. We find that index of power law component increases during the pivoting and at the same time soft flux decreases. Hence, we suggest that pivoting is primarily due to decrease in the soft disk flux and hardening of the power law component. Since during the observation QPO was not observed we can not get any concrete conclusions about physical changes in the accretion disk and corona.
The five distinct properties viz. anti-correlated hard delay, change in QPO centroid frequency, model independent spectrum, systematic variation in thermal Comptonization parameters and disciplined change in the QPO frequency with fluxes, swings the pendulum towards the idea of truncated accretion disk and alleviate the possibility of non truncated models.
Acknowledgments
We thank the anonymous referee for constructive and critical comments. This research has made use of data obtained through the HEASARC Online Service, provided by the NASA/GSFC, in support of NASA High Energy Astrophysics Programs.
References
- Belloni et al. (2000) Belloni, T., Klein-Wolt, M., Mendez, M. et al. 2000, A&A, 355, 271
- Belloni et al. (2006) Belloni, T., Soleri, P., Casella, P., Mendez, M. & Migliari, S., 2006, MNRAS, 369, 305
- Chakrabarti (1996) Chakrabarti, S.K. 1996, Phys. Rep., 266, 229
- Chakrabarti & Manickam (2000) Chakrabarti, S.K. & Manickam, S.G. 2000, ApJ, 531, L41
- Choudhury & Rao (2004) Choudhury, M., & Rao, A.R. 2004, ApJ, 616, L143
- Choudhury et al. (2005) Choudhury, M., Rao, A.R., Dasgupta, S., Pendharkar, J., Sriram, K., & Agrawal, V. K., 2005, ApJ, 631, 1072
- Corbel et al. (2001) Corbel, S., et al. 2001, ApJ, 554, 43
- Done & Kubota (2006) Done, C., & Kubota, A., 2006, MNRAS, 371, 1216
- Ebisawa et al. (1994) Ebisawa, K. et al., 1994, PASJ, 46, 375
- Esin et al. (1997) Esin, A. A., McClintock, J. E., Narayan, R., 1997, ApJ, 489, 865
- Fender et al. (2004) Fender, R., Belloni, T., & Gallo, E. 2004 MNRAS, 355, 1105
- Fender et al. (2005) Fender, R., Belloni, T., & Gallo, E. 2005 Ap&SS, 300, 1
- Fender et al. (2006) Fender, R., Stirling, A. M., Spencer, R. E., Brown, I., Pooley, G. G., Muxlow, T. W. B., & Miller-Jones, J. C. A., 2006, MNRAS, 369, 603
- Hannikainen et al. (2001) Hannikainen, D., et al. 2001, Ap&SS, 276, 45
- Hjellming et al (1999) Hjellming, R. M., Rupen, M. P., Mioduszewski, A. J., Kuulkers, E., McCollough, M., Harmon, B. A., Buxton, M., Sood, R., Tzioumis, A., Rayner, D., Dieters, S., & Durouchoux, P. 1999, ApJ, 514, 383
- Jahoda et al. (2006) Jahoda, K. et al., 2006, ApJS, 163, 401
- Jones et al. (1976) Jones, C., Forman, W., Tananbaum, H. & Turner, M. I. L. 1976, ApJ, 210, L9
- Koerding & Falcke (2004) Koerding, E., & Falcke, H., 2004, A&A, 414, 795
- Kubota & Done (2004) Kubota, A., & Done, C., 2004, MNRAS, 353, 980
- Makishima et al. (1986) Makishima, K., et al., 1986, ApJ, 308, 635
- Markoff & Nowak (2004) Markoff, S., Nowak, M. A., 2004, ApJ, 609, 972
- Markoff et al. (2005) Markoff, S., Nowak, M. A., & Wilms, J., 2005, ApJ, 635, 1203
- Markwardt et al. (1999) Markwardt, C. B., Swank, J. H., & Taam, R. E. 1999, ApJ, 513, L37
- McClintock & Remillard (2004) McClintock, J.E. & Remillard, R.A. 2004, in Compact Stellar X-ray Sources, W.H.G. Lewin and M. van der Klis eds., Cambridge University Press, 157p
- McHardy et al. (2006) McHardy, I.M., Koerding, E., Knigge, C., Uttley, P., Fender, R.P. 2006, Nature, 444, 730
- Narayan & Yi (1994) Narayan, R. & Yi, I. 1994, ApJ, 428, L13
- Orosz et al. (2002) Orosz, J. et al., 2002, ApJ, 568, 845
- Rao et al. (2000) Rao, A. R., Naik, S., Vadawale, S. V., & Chakrabarti, S. K., 2000, A&A, 360, L25
- Remillard et al. (1999) Remillard, R. A., McClintock, J. E., Sobczak, G. J., Bailyn, C. D., Orosz, J. A., Morgan, E. H., & Levine, A. M., 1999, ApJ, 517, L127
- Remillard et al. (2002) Remillard, R. A., Muno, M. P., McClintock, J. E., & Orosz, J., 2002, ApJ, 580, 1030
- Rothschild et al. (1998) Rothschild, R. E. et al, 1998, ApJ, 496, 538
- Shapiro et al. (1976) Shapiro, S. L., Lightman, A. P., & Eardley, D. N., 1976, ApJ, 204, 187
- Smith et al. (1998) Smith, D. A., et al. 1998, IAU Circ. 7008
- Sobczak et al (2000) Sobczak, G. J. et al., 2000, ApJ, 531, 537
- Stella et al (1999) Stella, L., Mario, V., Morsink, S.M., 1999, ApJ, 524, L63
- Sunyaev & Titarchuk (1980) Sunyaev, R. A., & Titarchuk, L. G., 1980, A&A, 86, 121
- Titarchuk & Fiorito (2004) Titarchuk. L. & Fioroti, R. 2004, ApJ, 612, 988
- Tomsick et al. (2005) Tomsick, J., Corbel, S., Goldwurm, A., & Kaaret P., 2005, ApJ, 630, 413
- Vadawale et al. (2001) Vadawale, S. V., Rao, A. R., & Chakrabarti, S. K., 2001, A&A, 372, 793
- Zdziarski et al. (1996) Zdziarski, A. A., Johnson, W. N., & Magdziarski, P., 1996, MNRAS, 283, 193
- Zdziarski et al. (2001) Zdziarski, A.A., Grove, E., Poutanen, J., Rao, A. R., Vadawale, S. V., 2001, ApJ, 554, L45
- Zdziarski et al. (2002) Zdziarski, A.A., et al. 2002, ApJ, 578, 357
| source | soft vs hard energy range | ObsId | bin (s) | Delay (s) | correlation coefficient |
|---|---|---|---|---|---|
| 4U 1630-47 | 2-5 keV vs 25-30 keV | 80117-01-01-01 | 128 | -0.58 | |
| XTE J1550-564 | 2-5 keV vs 20-50 keV | 30191-01-09-00 | 32 | -0.41 | |
| XTE J1550-564 | 2-5 keV vs 20-50 keV | 30191-01-09-01 | 64 | -0.47 |
| Part of observation | kT | kT | N | ||
|---|---|---|---|---|---|
| (keV) | (keV) | ||||
| A | |||||
| B | |||||
| A | |||||
| B |
| Part of observation | kT | kT | N | ||
|---|---|---|---|---|---|
| (keV) | (keV) | ||||
| A | |||||
| B |
| Part of observation | N | kT | |||
|---|---|---|---|---|---|
| (1022 cm-2) | (keV) | ||||
| A | |||||
| B |
| ObsId | parameters varied | DOF | F-test probability | |
|---|---|---|---|---|
| (XTE J1550-564) | ||||
| 30191-01-09-00 | ||||
| NONE | 436 | 185 | - | |
| N | 285 | 182 | 9.13 10-17 | |
| Nth+N | 245 | 181 | 1.744 10-7 | |
| Nth+Ndiskbb+kT | 207 | 180 | 3.79 10-8 | |
| ALL | 195 | 176 | 3.18 10-2 | |
| (XTE J1550-564) | ||||
| 30191-01-09-01 | ||||
| NONE | 316 | 183 | - | |
| Nth | 220 | 182 | 5.173 10-16 | |
| Nth+Ndiskbb | 219 | 181 | 0.364 | |
| Nth+Ndiskbb+kTin | 207 | 180 | 1.470 10-3 | |
| ALL | 205 | 176 | 0.787 | |
| (GRS 1915+105) | ||||
| 20402-01-14-00 | ||||
| None | 976 | 151 | - | |
| Nth | 819 | 150 | 3.046 10-7 | |
| Nth+Ndiskbb | 216 | 149 | 5.605 10-45 | |
| Nth+Ndiskbb+kTin | 164 | 148 | 1.843 10-10 | |
| ALL | 150 | 144 | 1.159 10-2 |
| ObsId | Energy | Centroid frequency f (Hz) | FWHM (Hz) | RMS% | |||
|---|---|---|---|---|---|---|---|
| Fundamental | Harmonic | Fundamental | Harmonic | Fundamental | Harmonic | ||
| Soft (2-20keV) | |||||||
| Hard (20-50keV) | absent | absent | absent | ||||
| absent | absent | absent | |||||
| Soft (2-20keV) | |||||||
| Hard (20-50keV) | absent | absent | absent | ||||
| absent | absent | absent | |||||
| Spectral parameter | 30191-01-09-00 | 30191-01-09-01 | 20402-01-14-00 | |||
|---|---|---|---|---|---|---|
| A | B | A | B | A | B | |
| N | ||||||
| N | ||||||
| kT(keV) | ||||||
| disk flux | ||||||
| (10-9 ergs cm-2 s-1) | ||||||
| thcomp flux | 52.5 | 46.5 | 52.6 | 42.3 | 11.40 | 22.0 |
| (10-9 ergs cm-2 s-1) | ||||||
| Delay (seconds) | ||||||
| (f/f)ddf corresponds to centroid frequency of respective QPO % | 1.39 | 5.16 | -10.03 | |||
| (kTin/kTin)% | 8.75 | 6.85 | -10.23 | |||
| (N | 4.78 | 32.76 | -22.2 | |||
| (Nth/Nth)% | -11.43 | -19.6 | 92.98 | |||

 |
 |
 |
 |
 |
 |
 |
 |
 |
 |