On the neutron star-disc interaction in Be/X-ray binaries
Abstract
We have investigated the long-term X-ray variability, defined as the root-mean-square () of the ASM RXTE light curves, of a set of galactic Be/X-ray binaries and searched for correlations with system parameters, such as the spin period of the neutron star and the orbital period and eccentricity of the binary. We find that systems with larger are those harbouring fast rotating neutron stars, low eccentric and narrow orbits. These relationships can be explained as the result of the truncation of the circumstellar disc. We also present an updated version of the H equivalent width–orbital period diagram, including sources in the SMC. This diagram provides strong observational evidence of the interaction of neutron star with the circumstellar envelope of its massive companion.
keywords:
X-rays: binaries – stars: neutron – stars: binaries close –stars: emission line, Be1 Introduction
Be stars are non-supergiant fast-rotating B-type and luminosity class III-V stars which at some point of their lives have shown spectral lines in emission. In the infrared they are brighter than their non-H emitting counterparts of the same spectral type. The line emission and IR excess originate in extended circumstellar envelopes of ionised gas surrounding the equator of the B star. Be stars can live their lives in isolation or taking part in a binary system. In this case, the companion is a neutron star and the system is referred to as a Be/X-ray binary (see Coe, 2000; Negueruela, 2004, 2005, for recent reviews). Evolutionary calculations show that Be star + white dwarf or Be star + black hole should also be common type of systems. However, no clear evidence of their existence has been shown as yet (Waters et al., 1989; Raguzova, 2001; Torrejón & Orr, 2001; Zhang et al., 2004). Be/X-ray binaries (from now on BeX) are strong emitters of X-ray radiation, which is produced as the result of accretion of matter from the optical companion’s circumstellar disc onto the neutron star.
The variability time scales in BeX range from seconds to years. The fastest variability is found in the X-ray band. All but two (LS I +61303 and 4U 2206+54) of the BeX with identified optical counterparts are X-ray pulsars. Pulse periods cover the range 3.6–1412 s. On longer time scales (months to years), the variability is also apparent in the optical and IR bands and it is attributed to structural changes of the circumstellar disc. Sometimes, the Be star loses the disc (Roche et al., 1997; Haigh et al., 1999; Negueruela et al., 2001; Reig et al., 2001). When this occurs the H line shows an absorption profile and the X-ray activity ceases. The long-term X-ray variability of the transient BeX is characterised by two type of outbursting activity
-
•
Type I outbursts. These are regular and (quasi)periodic outbursts, normally peaking at or close to periastron passage of the neutron star. They are short-lived, i.e., tend to cover a relatively small fraction of the orbital period (typically 0.2-0.3 ). The X-ray flux increases by up to two orders of magnitude with respect to the pre-outburst state, reaching peak luminosities erg s-1.
-
•
Type II outbursts represent major increases of the X-ray flux, times that at quiescence. They reach the Eddington luminosity for a neutron star ( erg s-1) and become the brightest objects of the X-ray sky. They do not show any preferred orbital phase and last for a large fraction of an orbital period or even for several orbital periods. The formation of an accretion disc during Type II outbursts (Kriss et al., 1983; Motch etal, 1991; Hayasaki & Ozakaki, 2004) may occur. The discovery of quasi-periodic oscillations in some systems (Angelini et al., 1989; Finger et al., 1996) would support this scenario. The presence of an accretion disk also helps explain the large and steady spin-up rates seen during the giant outbursts, which are difficult to account for by means of direct accretion.
Most BeX are transient systems and present moderately eccentric orbits (), although persistent sources also exist. Persistent BeX (Reig & Roche, 1999) display much less X-ray variability and lower flux ( erg s-1) and contain slowly rotating neutron stars ( s). Pfahl et al. (2002) suggested the existence of a new class of BeX (which we shall referred to as low- BeX), characterised by wide orbits ( d) and low eccentricity (). The interest in these sources resides in that their low eccentricity requires that the neutron star received a much lower kick velocity at birth than previously assumed by current evolutionary models.
This work investigates the relationship between the long-term X-ray/optical variability and the orbital parameters of galactic BeX. The parameter that characterises the X-ray variability is the root-mean-square calculated from the ASM RXTE light curves. In the optical band, the maximum value ever reported of the equivalent width of the H line serves as an indication of the size of the circumstellar disc. These quantities are studied as a function of the size (as given by the orbital period) and eccentricity of the orbit and the rotation velocity of the neutron star (as given by the spin period). The ultimate goal is to provide further evidence of the interaction between the neutron star and the Be star’s envelope.
| Source | Spectral | Pspin | Porb | Averagea,c | Peaka,c | Outburst | ||
|---|---|---|---|---|---|---|---|---|
| name | type | (s) | (days) | Flux | Flux | activity | ||
| Transient BeX | ||||||||
| 4U 0115+634 | B0.2V | 3.6 | 24.3 | 0.34 | 0.49 | 2.19 | 16.36 | II |
| V 0332+53 | O8-9V | 4.4 | 34.2 | 0.30 | 0.86 | 6.17 | 62.45 | II |
| A 0535+262 | B0III | 104.0 | 111.0 | 0.47 | 0.24 | 0.46 | 2.52 | II |
| 4U 0726-260 | O8-9V | 103.2 | 34.5 | – | 0.12 | 0.07 | 0.40 | I |
| RX J0812.4-3115 | B0.5III-V | 31.9 | 81.3 | – | 0.08 | 0.11 | 0.44 | I |
| GRO J1008-57 | O9-B1V | 93.5 | 135.0 | 0.66 | 0.12 | 0.09 | 0.40 | I |
| 4U 1145-619 | B0.2III | 292.4 | 187.5 | 0.04 | 0.20 | 0.70 | I | |
| 4U 1258-61 | B2V | 272.0 | 133.0 | 0.11 | 0.07 | 0.30 | I | |
| 4U 1417-624 | B1V | 17.6 | 42.1 | 0.45 | 0.16 | 0.20 | 1.54 | I |
| GS 1845-024 | – | 94.8 | 241.0 | 0.88 | 0.18 | 0.10 | 0.36 | I |
| XTE J1942+274 | B0-1 | 15.8 | 169.2 | 0.33 | 0.31 | 0.56 | 1.73 | I |
| EXO 2030+375 | B0.5III-V | 41.8 | 46.0 | 0.41 | 1.30 | 4.31 | 28.86 | I+II |
| GRO J2058+42 | O9.5-B0IV-V | 198.0 | 55.0 | – | 0.15 | 0.10 | 0.46 | I |
| SAX J2103.5+4545 | B0V | 358.6 | 12.7 | 0.40 | 0.28 | 0.33 | 1.59 | I |
| Persistent BeX | ||||||||
| RX J0146.9+6121 | B1III-V | 1412 | 300d | – | 0.08 | 0.10 | 0.38 | – |
| X-Per | O9.5III | 837 | 250 | 0.11 | 1.28 | 0.62 | 2.74 | – |
| RX J0440.9+4431 | B0.2V | 202 | 150d | – | 0.04 | 0.04 | 0.18 | – |
| RX J1037.5-5648 | B0V-III | 862 | 250d | – | 0.05 | 0.04 | 0.12 | – |
| Low- BeX | ||||||||
| GS 0834-430 | B0-2III-V | 12.3 | 105.8 | 0.12 | 0.09 | 0.08 | 0.24 | I |
| XTE J1543-568 | B0.7V | 27.1 | 75.6 | 0.27 | 0.23 | 0.91 | I | |
| 2S 1553-542 | – | 9.3 | 30.6 | 0.09 | 0.24 | 1.48 | I | |
| KS 1947+300 | B0V | 18.7 | 40.4 | 0.03 | 0.48 | 1.02 | 6.78 | I+II |
| In ASM RXTE c/s, for the period MJD 50133-54041. Note that the Crab nebula flux is about 75 ASM c/s | ||||||||
| Standard deviation of the ASM light curve between MJD 50133-54041 | ||||||||
| Bin time equal to the orbital period | ||||||||
| Orbital period estimated from the / relationship | ||||||||

2 Observations and data reduction
Light curves obtained with the All Sky Monitor (ASM) on board the Rossi X-ray Timing Explorer (RXTE) were retrieved from the Definitive Products Database. The light curves cover more than 10 years worth of data, from February 1996 to November 2006 (JD 2,450,133–2,454,041). The ASM consists of three Scanning Shadow Cameras mounted on a rotating drive assembly. Each Camera has a field of view (FWHM) of and is equipped with position-sensitive Xenon proportional counters with a total collecting area of 90 cm2. Two of the cameras share the same look direction but are canted by from each other, while the third camera looks in a direction parallel to the ASM drive axis. The ASM scans 80% of the sky every 90 minutes in a series of dwells of about 90 s each. Any given X-ray source is observed in about 5–10 dwells every day. The ASM is sensitive to X-rays in the energy band 1.3-12.2 keV. For more information on the ASM see Levine et al. (1996).
Instrumental effects were removed from the light curves by excluding the data points that deviated more than 10 from the average of the five preceding and five successive neighbouring points. Dwells with negative flux and that deviated more than 1 from the average of the total light curve were also removed. The average was calculated locally in the case of the detection of spikes in order to prevent the removal of outbursts, while was considered globally in the case of negative flux observations to allow for statistical fluctuations.
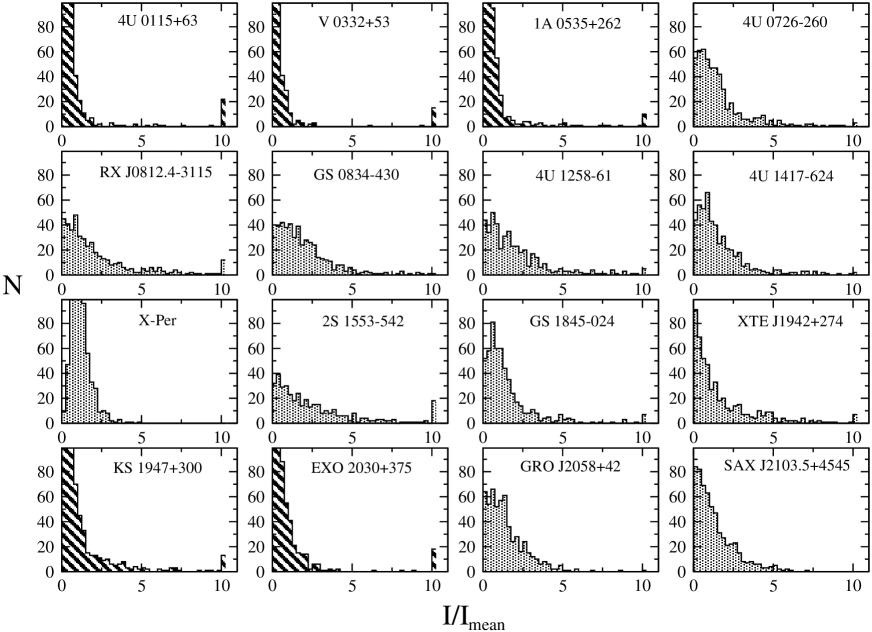
Table 1 lists the properties of the BeX analysed in this work. The spin and orbital periods, eccentricity and spectral type were taken from Raguzova & Popov (2005) and Liu et al. (2006). Figure 1 shows the light curves of some of the BeX analysed in this work, while intensity distribution functions (IDF) or histograms of the normalised flux are shown in Fig. 2. The IDFs show how often a given (normalised) intensity occurs. The abscissa represents the intensity of the source normalised to its mean value in steps of 0.25, whereas the ordinate gives the number of times (i.e. the frequency) that certain values of the normalised intensity occur. Data points with a flux more than 10 times the mean flux were allocated in the last bin. The IDF plots also give a measure of the source variability. The five BeX showing type II outbursts (striped pattern in Fig. 2) present narrow IDFs and a populated last bin, meaning that most of the time they are close to quiescence and only sporadically go into outburst. The height of the last bin indicates the strength of the outburst, as this bin contains . Sources with choppy light curves will show many populated bins in their IDF plots, hence resulting in wide IDFs or narrow IDFs with extended tails.
3 X-ray variability
We have examined the X-ray variability of the sources in the time domain and considered the root mean square () as the parameter that characterize and quantifies that variability. Our goal is to study the X-ray behaviour of galactic BeX on time scales that allow the sampling of the dynamical evolution of the circumstellar disc (), without the interference of possible intra-orbital variability (). Therefore, the light curves were rebinned into bins with a duration equal to the orbital period of the source.
The amplitude was computed from the cleaned and rebinned light curves as , where is the mean count rate and is the difference between the observed variance, , and the expected variance, ( are the experimental errors, and is the total number of points). Note that the is more sensitive to the amplitude variations than to the frequency of those variations. In this sense, the of a source like, e.g. V 0332+53 will be higher than e.g. 4U 1417-624 (see Fig. 1).
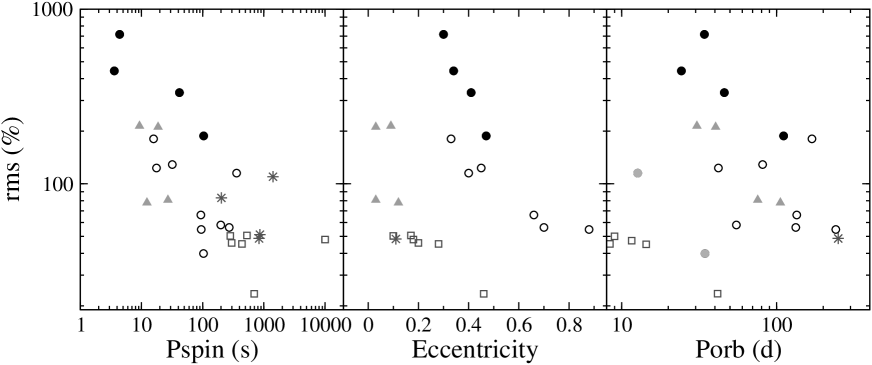
Figure 3 shows the as a function of the spin period, eccentricity and orbital period of the systems. For the sake of comparison, persistent BeX and supergiant X-ray binaries (SGX), that is, systems whose optical companion is an evolved (luminosity class I-II) star, have also been included. Different type of systems have been represented by different symbols as follows: transient BeX by circles, persistent BeX by stars and SGX by squares. Systems that have shown Type II outbursts during the period of the observations, that is, systems in which the increase in X-ray flux lasted for several orbits, have been represented by black filled circles. Grey filled triangles denote the new class of low- BeX. It is very likely that low- BeX and persistent BeX form one and only class of systems. In fact, X-Per, which is considered the prototype of the persistent BeX, also belongs to the class of low- BeX. The two grey filled circles on the right panel of Fig. 3 correspond to 4U 0726–260 and SAX J2103.5+4545, which are BeX that do not follow the well-known / relationship.
In all cases a clear anticorrelation is apparent: systems with fast rotating neutron stars and low-eccentric and narrow orbits are more variable, i.e. present higher . This plot then suggests two interesting results. First, since the BeX and the SGX occupy clearly distinct regions in Fig. 3, the X-ray variability in high-mass X-ray binaries does not only depend on the physical conditions in the vicinity of the compact object but also on the mass transfer mechanism, i.e. whether a circumstellar disc is present or not. Second, the systems containing fast neutron stars are more likely to exhibit Type II outbursts. The latter result is closely related to the inverse correlation found by Majid et al. (2004) between the maximum X-ray flux and the spin period of BeX in the Magellanic clouds and the Milky way. Majid et al. (2004) explained this correlation in simple terms as a consequence of the inverse dependence of the density of accreted matter (hence X-ray flux) on distance between the Be companion and the neutron star. Since the spin period and the orbital period are correlated through Corbet’s diagram (Corbet, 1986), the relationship between flux and spin period follows.
Figure 3 also shows that, on average, i) the more eccentric the orbit the lower the variability and ii) type II activity mainly occurs in low-eccentric systems. The newly identified class of BeX, with nearly circular orbits (KS1947+300, XTE J1543–568, 2S 1553–542 and GS 0834-430), represented by triangles in Fig 3, follow the general trend in the and plots but clearly distinguish themselves from the classical BeX in the diagram. The anticorrelation of the with the orbital period provides further evidence for the truncation of the disk in systems with short orbital periods, i.e. those having narrow orbits.
Systems showing large amplitude variations, that is, those exhibiting type II outbursts, allow the study of the averaged orbital variability as a function of X-ray flux. The ASM light curves were cut into segments of duration equal to the orbital period. For each segment, the average count rate and standard deviation were obtained. As can be seen in Fig. 4, the variability is consistent with statistical fluctuations at low count rates ( ASM c s-1), whereas at higher intensity the X-ray variability scales with flux. The fact that there is no accumulation of points in the bottom-right part of the diagram, indicates that stable, long-lasting high-intensity states do not exist in BeX. High states in BeX occur occasionally and are associated with short-lived and sudden increases of the X-ray flux.
4 The Porb–EW(H) diagram
Figure 5 shows an updated version of the Porb–EW(H) diagram, first presented by Reig et al. (1997). The original Porb–EW(H) diagram contained 11 BeX, of which only 9 had well established orbital periods. Since then, several new BeX have been discovered and their orbital periods obtained. Particularly, the discovery of new BeX in the Magellanic Clouds has been remarkable (Stevens et al., 1999; Edge & Coe, 2003; Majid et al., 2004; Coe et al., 2005; Laycock et al., 2005; Liu et al., 2005; Schmidtke & Cowly, 2006). Figure 5 contains 28 systems, 16 are Milky Way objects (represented by circles) and 12 are located in the SMC (squares). Open symbols represent systems whose orbital period is not yet known, but which has been estimated using an updated version of the / relationship (Corbet, 1986). Systems without a firm optical counterpart, such as AX J0049.4–7323 (SXP756 in the terminology of Coe et al. (2005)), XTE J0052-723 (SXP4.78), RX J0051.8-7231 (SXP8.80) or 1WGA J0052.8-7226 (SXP46.6) or with dubious periods (RX J0105.1-7211) have not been included in Fig. 5.
Note that the value of the H equivalent width of Fig. 5 is the maximum ever reported. Some systems, especially in the SMC, have been discovered recently, hence the monitoring of the H is necessarily short. For those systems, the value of the EW(H) may not represent a high state of the circumstellar disc. The EW(H) of such systems should be considered as lower limits (arrows pointing upward in Fig. 5 have this meaning). This is the case of the galactic BeX GRO J2058+42 and most likely of the SMC sources RX J0051.9-7311 and RX J0101.3-7211.
5 Discussion
We have analysed the ASM RXTE light curves of galactic BeX to investigate their long-term variability, with the aim of providing further evidence for the interaction between the Be star’s circumstellar disc and the neutron star. Evidence for dynamical interaction between the neutron star and the circumstellar envelope of the Be star was first reported by Reig et al. (1997), who found a direct relationship between the maximum value of the equivalent width of the H line and the orbital period of the system. They also found that, on average, isolated Be stars present larger values of EW(H) than Be stars in BeX. These two observational facts were interpreted as an indication that isolated Be stars may develop extended circumstellar discs whereas the disc of Be stars in BeX is truncated by the neutron star.
Further observational support for a different disc structure in BeX and isolated Be stars, presumably as a result of truncation, were subsequently found. Negueruela et al. (1998) attributed the correlated X-ray (Type II outbursts) and V/R optical variability to the presence of the neutron star. Based on the works by Okazaki (1991, 1997), they suggests that the very short V/R quasi-periods seen in BeX compared to those observed in isolated Be stars could be explained if the former had denser circumstellar discs. This is precisely the result found by Zamanov et al. (2001) after a comparative study between the circumstellar discs in BeX and isolated Be stars. Zamanov et al. (2001) found that the discs of Be stars in BeX tend to be smaller and twice as dense as those in isolated Be stars. Likewise, the quantised infrared excess flux states displayed by 1A 0535+262 have been interpreted as supporting the resonant truncation paradigm (Haigh et al., 2004). Transitions between flux states are associated with changes in the truncation radius. Recently, Reig et al. (2005) has suggested a relationship between the characteristic time scales for the disc formation/dissipation phases and the orbital period. That is, circumstellar discs in systems with wide orbits last longer.
An updated version of the correlation is presented in Fig. 5, where SMC sources have been included. The Porb–EW(H) diagram is based on the fact that the H line is the prime indicator of the circumstellar disc state. Although an instant measurement of the EW(H) may not be an effective measurement of the size of the disc, the maximum equivalent width, when monitored during a long length of time (longer than the typical time scales for changes in the circumstellar disc, namely, from few months to a few years) becomes a significant indicator of the size of the disc. Based on interferometric observations, Quirrenbach et al. (1997) and Tycner et al. (2005) have shown that there is a clear linear correlation between the net H emission and the physical extent of the emitting region. Also, the observed correlations between the spectral parameters of the H line (FWHM, EW, peak separation in double-peak profiles) and the rotational velocity that have been observed in many Be stars are interpreted as evidence for rotationally dominated circumstellar disc (Dachs et al., 1986). In particular, interpreting the peak separation () of the H split profiles as the outer radius () of the emission line forming region (Huang, 1972)
| (1) |
the radius of the emitting region can be estimated (Hummel & Vrancken, 1995; Jaschek & Jaschek, 2004). is the projected rotational velocity of the B star ( is the equatorial rotational velocity and the inclination toward the observer). As the EW(H) increases, the peak separation decreases, hence increasing the radius of the H emitting region (Dachs et al., 1992; Hanuschik et al., 1988). Single peak profiles tend to correspond to larger discs. Further evidence of a direct relationship between the EW(H) and the size of the circumstellar disc is the correlation between the EW(H) and the infrared colours reported by various authors (Dachs et al., 1988; Coe et al., 2005).

Assuming then, that EW(H) provides a good measure of the size of the circumstellar disc, Fig. 5 indicates that systems with long orbital periods have larger discs, while narrow orbit systems contain smaller discs. The existence of the above relationship is attributed to the presence of the compact star which prevents its optical counterpart from developing a large circumstellar disk in system with small orbital periods. In other words, the presence of the neutron star leads to the truncation of the circumstellar disc.
The viscous decretion disc model (Okazaki & Negueruela, 2001) provides the theoretical basis to the idea of disc truncation. Be star’s discs are supported by viscosity. Angular momentum is transferred from the optical companion to the inner edge of the circumstellar disc, increasing its angular velocity to Keplerian. The radial velocity component is subsonic even at the distance where the neutron star lies. Truncation occurs by the tidal interaction when the resonant torque exerted by the neutron star exceeds the viscous torque. This occurs only at certain radii — where the ratio between the angular frequency of disc rotation and the angular frequency of the mean binary motion is a rational number. The efficiency of truncation depends strongly on the gap between the truncation radius and the inner Lagrangian point and the viscosity parameter . If is the time scale for a particle in the disc to cover this gap then truncation will be efficient when . Typical values of the viscosity parameter are . Truncation is expected to be more efficient in low and moderate eccentric systems () with narrow orbits ( d) than in highly eccentric systems because the former have wider gaps. The prediction of the viscous decretion disc model is then that type I outbursts are expected to occur more often in high-eccentric systems, whereas type II outburst would dominate in low-eccentric systems, in agreement with the results shown in Fig. 3.
Zhang et al. (2004) extended the viscous decretion disc model to compact companions of arbitrary mass. Their results not only confirmed the predictions of Okazaki & Negueruela (2001) that low viscosity and small eccentricity would lead to effective Be disc truncation, but also show that the most effective truncation would occur in narrower systems, hence giving further support to the validity of the correlation.
Coe et al. (2005) carried out a major study of the optical and infrared characteristics of BeX in the SMC. They found that the optical photometric variability is greatest when the circumstellar disc size is least and also in systems containing fast rotating neutron stars. Our work extends these results to the X-ray domain.
While the works by Okazaki & Negueruela (2001) and Zhang et al. (2004) and the correlation clearly identify truncation with low eccentric and narrow orbit systems, the plots of the X-ray as a function of the system parameters (Fig. 3) and those of the EW(H) and as a function of the optical photometric (Figs 6 and 7 in Coe et al., 2005) identify truncation with variability. That is, systems in which truncation is favoured are the most variable ones in both, the X-ray and optical bands.
Evolutionary scenarios for the formation of BeX traditionally assumed that their observed large orbital eccentricities () are the result of substantial kick velocities ( km s-1) imparted on to the neutron star at birth (see e.g. van den Heuvel et al., 2000). The existence of BeX with quasi circular orbits requires that the neutron star in these systems received a kick velocity km s-1 (Pfahl et al., 2002; Podsiadlowski et al., 2004). The large number of low- BeX — they represent more than a third of BeX with known orbits — led Pfahl et al. (2002) to suggest that these systems conform a new class of BeX. The high level of X-ray activity of some members of this group, such as KS 1947+300, which shows both type I and II outbursts and GS 0834–430, which shows strong type I activity poses a problem to the viscous decretion disc model. This model predicts that the lower the eccentricity, the more difficult the accretion onto the neutron star as truncation is more effective.
Although the viscous decretion disc model provides a natural explanation for periodic X-ray outbursts in BeX, there is still a number of unresolved issues such as the identification of the physical mechanism producing the type II outbursts, the origin of the Be star’s equatorial disc, whether an accretion disc around the neutron star is formed and the X-ray variability in low- systems.

6 Conclusion
We have investigated the long-term behaviour of Be/X-ray binaries in the X-ray and optical bands and found further evidence for the truncation of the Be star’s circumstellar disc. The viscous decretion disc model predicts that truncation of the Be star’s disc is favoured in systems with short orbital periods and low eccentricities. We have shown that these systems are also the most variable in terms of flux amplitude changes (those displaying type II outbursts). In contrast, systems with long orbital periods and high eccentricity show lower amplitude flux variations (type I outbursts). Our results agree and extend to the X-ray domain those reported by Coe et al. (2005) in the optical band.
Acknowledgments
The X-ray light curves were provided by the ASM/RXTE teams at MIT and at the RXTE SOF and GOF at NASA’s GSFC. This research has made use of NASA’s Astrophysics Data System Bibliographic Services and SIMBAD databases.
References
- Angelini et al. (1989) Angelini, L., Stella, L., Parmar, A. N. 1989, ApJ, 346, 906
- Coe (2000) Coe, M. J. 2000, in The Be phenomenon in Early-type Stars, ASP Conference Series, vol. 3, p. 656, Ed. Smith, M.A., Henrichs, H.F., Fabregat, J.
- Coe et al. (2005) Coe, M. J., Edge, W. R. T., Galache, J. L., & McBride, V. A. 2005a, MNRAS, 356, 502
- Corbet (1986) Corbet, R.H.D. 1986, MNRAS, 220, 1047
- Dachs et al. (1986) Dachs, J., Hanuschik, R., Kaiser, D., Rohe, D. 1986, A&A, 159, 276
- Dachs et al. (1988) Dachs, J., Engels, D., & Kiehling, R., 1988, A&A, 194, 167
- Dachs et al. (1992) Dachs, J., Hummel, W., Ranuschik, R.W. 1992, A&ASS, 95, 437
- Edge & Coe (2003) Edge, W.R.T. & Coe, M.J. 2003, MNRAS, 338, 428
- Finger et al. (1996) Finger, M. H., Wilson, R. B., Harmon, B. A. 1996, ApJ, 459, 288
- Haigh et al. (1999) Haigh, N. J., Coe, M. J., Steele, I. A., & Fabregat, J. 1999, MNRAS, 310, L21
- Haigh et al. (2004) Haigh, N. J., Coe, M. J., Fabregat, J. 2004, MNRAS, 350, 1457
- Hanuschik et al. (1988) Hanuschik, R.W., Kozok, J.R., Kaiser, D. 1988, A&A, 189, 147
- Hayasaki & Ozakaki (2004) Hayasaki, K. & Ozakaki, A.T. 2004, MNRAS, 350, 971
- Huang (1972) Huang, S.S., 1972, ApJ, 171, 549
- Hummel & Vrancken (1995) Hummel, W. & Vrancken, M. 1995, A&A, 302,751
- Jaschek & Jaschek (2004) Jaschek, C. & Jaschek, M. 2004, VizieR On-line Data Catalog: VI/57. Originally published in: 1993, A&AS, 97, 807
- Kriss et al. (1983) Kriss, G. A., Cioffi, D. F., Canizares, C. R. 1983, ApJ, 272, 439
- Laycock et al. (2005) Laycock, S., Corbet, R. H. D., Coe, M. J., Marshall, F. E., Markwardt, C., Lochner, J. 2005, ApJS, 161, 96
- Levine et al. (1996) Levine, A. M., Bradt, H. Cui, W. Jernigan, J. G., Morgan, E. H., Remillard, R., Shirey, R. E., Smith, D. A, 1996, ApJ, 469, L33
- Liu et al. (2005) Liu, Q. Z., van Paradijs, J., van den Heuvel, E. P. J. 2005, A&A, 442, 1135
- Liu et al. (2006) Liu, Q. Z., van Paradijs, J., van den Heuvel, E. P. J. 2006, A&A, 455, 1165
- Majid et al. (2004) Majid, W.A., Lamb, R.C., & Macomb, D.J., 2004, ApJ, 609, 133
- Motch etal (1991) Motch, C., Stella, L., Janot-Pacheco, E., & Mouchet, M. 1991, ApJ, 369, 490
- Negueruela et al. (1998) Negueruela, I., Reig, P., Coe, M.C., & Fabregat, J. 1998, A&A, 336, 251
- Negueruela et al. (2001) Negueruela, I., Okazaki, A. T., Fabregat, J., Coe, M. J., Munari, U., Tomov, T. 2001, A&A, 369, 117
- Negueruela (2004) Negueruela, I. 2004, Proceedings of Massive Stars in Interacting Binaries, ASP Conference Series, eds. N. St-Louis & A. Moffat, astro-ph/0411335
- Negueruela (2005) Negueruela, I. 2005, in The Many Scales of the Universe, JENAM 2004 Astrophysics Reviews, Kluwer Academic Publishers, eds. J. C. del Toro Iniesta et al., astro-ph/0411759
- Okazaki (1991) Okazaki, A. T. 1991, PASJ, 43, 75
- Okazaki (1997) Okazaki, A. T. 1997, A&A, 318, 548
- Okazaki & Negueruela (2001) Okazaki, A.T., & Negueruela, I. 2001, A&A, 377, 161
- Pfahl et al. (2002) Pfahl, E., Rappaport, S., Podsiadlowski, P., Spruit, H. 2002, ApJ, 574, 364
- Podsiadlowski et al. (2004) Podsiadlowski, Ph., Langer, N., Poelarends, A. J. T., Rappaport, S., Heger, A., Pfahl, E. 2004, ApJ, 612, 1044
- Quirrenbach et al. (1997) Quirrenbach, A., Bjorkman, K. S., Bjorkman, J. E. 1997, ApJ, 479, 477
- Raguzova (2001) Raguzova, N.V. 2001, A&A, 367, 848
- Raguzova & Popov (2005) Raguzova, N.V. & Popov, S.B., 2005, A&AT, 24, 151
- Reig et al. (1997) Reig, P., Fabregat, J., Coe 1997, A&A, 322, 193
- Reig & Roche (1999) Reig, P. & Roche, P. 1999, MNRAS, 306, 100
- Reig et al. (2001) Reig, P., Negueruela, I., Buckley, D. A. H., Coe, M. J., Fabregat, J., Haigh, N. J. 2001, A&A, 367, 266
- Reig et al. (2005) Reig, P.Negueruela, I., Fabregat, J., Chato, R., Coe, M.J. 2005, A&A, 440, 1079
- Roche et al. (1997) Roche, P., Larionov, V., Tarasov, A. E. et al. 1997, A&A, 322, 139
- Schmidtke & Cowly (2006) Schmidtke, P.C. & Cowly, A.P. 2006, ApJ, 132, 919
- Stevens et al. (1999) Stevens, J.B., Coe, M.J., Buckley, D.A.H. 1999, MNRAS, 309, 421
- Torrejón & Orr (2001) Torrejón J.M. & Orr A. 2001, A&A, 377, 148
- Tycner et al. (2005) Tycner, C., Lester, J.B., Hajian, A.R., et al. 2005, ApJ, 624, 359
- van den Heuvel et al. (2000) van den Heuvel, E. P. J., Portegies Zwart, S. F., Bhattacharya, D., Kaper, L. 2000, A&A, 364, 563
- Waters et al. (1989) Waters, L. B. F. M., Pols, O. R., Hogeveen, S. J., Cote, J., van den Heuvel, E. P. J. 1989, A&A, 220, L1
- Zamanov et al. (2001) Zamanov, R. K., Reig, P., Mart , J., Coe, M. J., Fabregat, J., Tomov, N. A., Valchev, T. 2001, A&A, 367, 884
- Zhang et al. (2004) Zhang, F., Li, X.D., & Wang, Z.R. 2004, ApJ, 603, 663