Spectropolarimetry Surveys of Obscured AGNs
Abstract
The results of spectropolarimetry surveys of obscured AGNs are reviewed, paying special attention to their implications for the existence of two populations of type 2 Seyfert galaxies — hidden Seyfert 1s and “true” Seyfert 2s. In this context, the results from our Keck spectropolarimetry survey are presented. Similar to previous work, we have detected hidden broad-line regions (HBLRs) in about half of our sample. However, owing to different selection methods, we find that differences in the properties of HBLR and non-HBLR objects are much less pronounced than prior reports have indicated. Spectropolarimetry studies continue to benefit AGN research, as illustrated by the discovery of double-peaked H emission in the polarized-flux spectrum of NGC 2110.
Astronomy Department, Wesleyan University, Middletown, CT 06459 USA
1. Introduction
Spectropolarimetry allows us to measure the polarization of light as a function of wavelength. Coupled with theory and other observational constraints, this information can reveal whether the origin of the detected polarization is intrinsic (as in the case of synchrotron emission) or extrinsic, i.e., imparted via transmission through or scattering by a medium. When scattering is the dominant mechanism, spectropolarimetric observations can provide insight into the structure and geometry of the emitting region that would be unobtainable by other means. It is this aspect of the technique that has had such a profound impact on AGN research.
In keeping with the “torus” theme this group of papers, I’ll limit this review to spectropolarimetry surveys of obscured AGNs, which locally are classified as type 2 Seyfert galaxies on the basis of their narrow emission-line optical spectra. Contrary to the stated aims of this meeting, my focus is more on the astronomical issues associated with spectropolarimetry surveys, rather than on the physics of AGNs. However, this is worthwhile, since a number of recent investigations into the physical nature of AGNs have been motivated by spectropolarimetry results.
2. Pioneering Work at Lick Observatory
By now, the basic spectropolarimetric results obtained for Seyfert 2 galaxies are familiar to most. Beginning with NGC 1068 (Miller & Antonucci 1983; Antonucci & Miller 1985; Miller, Goodrich, & Matthews 1991), it has been demonstrated that some Seyfert 2s display broad permitted emission lines in their polarized-light spectra. In these cases, the data suggest that the objects are in fact type 1 Seyfert nuclei whose continuum source and broad-line region are hidden from direct view by dense material. Emission from the nucleus emerges along another direction and is scattered into our line-of-sight by free electrons or dust. Because the scattered light is polarized, spectropolarimetry can provide us with a periscopic view of the innermost regions of an obscured active nucleus. With support from some additional Lick Observatory discoveries of hidden Seyfert 1s (Miller & Goodrich 1990; Tran, Miller, & Kay 1992), this picture provided an elegant way to unify the two major spectroscopic classes of AGNs.
Spectropolarimetry measurements impose constraints on the geometry of the obscuring medium in AGNs. To account for the high intrinsic polarizations of some Seyfert 2s (tens of percent; Tran 1995), the nuclear radiation field must be restricted in both the plane of scattering (scattering angles must be close to ) and in the plane of the sky (position angles of the scattering planes, as viewed by us, must be similar to obtain net polarization). Thus, the obscuration is such that it surrounds the nucleus and has some cylindrical symmetry — a torus, more or less. Support for the torus model was derived early on from (1) the fact that the polarization position angle tends to be orthogonal to the axis of the nuclear radio source in type 2 AGNs (Antonucci 1984), and (2) the discovery of optical ionization cones in the circumnuclear regions of some Seyfert 2 galaxies (e.g., Pogge 1989), which demonstrate directly that the nuclear radiation field is anisotropic. Spectropolarimetry also provides an indication of where the torus is located. When the data are good enough, we observe that the narrow emission lines are unpolarized, which implies that most of the scattering occurs interior to the narrow-line region. Thus, the obscuration must be located within a few parsecs of the black hole.
For her Ph.D. thesis, L. Kay (1990, 1994) performed what was the first substantial spectropolarimetry survey of Seyfert 2 galaxies. Observations of 50 objects were made in the blue to explore their continuum polarizations at wavelengths where dilution from host-galaxy starlight is reduced. Her study demonstrated that “raw” continuum polarizations are uniformly low, and that the fraction of the continuum associated with unpolarized bulge starlight — even within the small apertures used — tends to be very high. Host-galaxy dilution remains an important factor for spectropolarimetry surveys performed at H.
3. Spectropolarimetry Surveys at H
The first extensive search for polarized broad H emission in narrow-line AGNs was carried out by Young et al. (1996). Using the AAT 3.9-m telescope, they surveyed a sample of 24 galaxies consisting of well-known Seyfert 2s and IRAS galaxies with “warm” 25 m/60 m infrared colors. Although the Young et al. sample was not complete or unbiased, their results would foreshadow those of spectropolarimetry surveys to come: a number of the objects exhibit polarized broad lines, but the majority do not.
Combining data from the AAT 3.9-m and detections of hidden broad-line regions (HBLRs) from the literature, Heisler, Lumsden, & Bailey (1997) surveyed a small but statistically complete sample of 16 objects assembled on the basis of their far-infrared fluxes and luminosities. The discovery of a new HBLR increased the number of objects in the sample with polarized broad lines to 7, or 44%. Using similar but somewhat looser selection criteria, Lumsden et al. (2001) examined an expanded IRAS galaxy sample of 24 narrow-line AGNs. Again, 4-m class telescopes were employed. Only one new detection was reported, indicating that 33% (8 objects) in the larger sample have evidence for polarized broad lines.
Seeking to improve upon the statistical quality of previous surveys, Tran (2001, 2003) studied 49 Seyfert 2 galaxies from the CfA and 12 m AGN samples. Five new HBLRs were reported among the objects, which were observed with the Lick 3-m and Palomar 5-m telescopes. The total number of objects in the Tran survey with hidden broad-line regions (22, or 45% of the sample) allowed for detailed comparisons between object that do and do not have evidence for polarized broad emission lines.
The survey of Seyfert 2 galaxies carried out by me and my colleagues is based mainly on data obtained with the Keck 10-m telescopes (Moran et al. 2000, 2001, 2007). In addition, the sample we have used is significantly different than those employed by other investigators; it consists of 38 nearby objects from the distance-limited sample of Ulvestad & Wilson (1989, hereafter UW89). The 9 new HBLR objects we have discovered among the UW89 galaxies brings to 17 the total number detected to date, which translates to 45% of the sample. Thus, the statistical power of our survey is on par with that of the Tran study.
Though not strictly a Seyfert 2 survey, I want to point out the results of A. Barth’s Ph.D. thesis, in which he explored the polarization properties of 14 low-luminosity AGNs. The objects, drawn from the spectroscopic survey of Ho, Filippenko, & Sargent (1995), included a few Seyfert 2s and Seyfert 1s, and several LINERs. Remarkably, the data revealed that three of the LINERs (located in elliptical galaxies) have polarized broad emission lines (Barth, Filippenko, & Moran 1999), implying that they possess nuclear obscuration with a geometry similar to that present in Seyfert galaxies.
4. Polarization and the Nature of Seyfert 2 Galaxies
Spectropolarimetry surveys have indicated that at least half of all Seyfert 2 galaxies have broad-line regions that are obscured from direct view by dense nuclear material. Are the non-HBLR objects hidden Seyfert 1s for which the detection of polarization is especially challenging (caused by something physically uninteresting, e.g., an unfavorable scattering geometry), or do they differ from hidden Seyfert 1s in some fundamental way? This is an important question — it concerns a significant fraction of all Seyfert galaxies, and as such, it has implications for our overall understanding of the AGN phenomenon and other associated issues, e.g., the origin of the cosmic X-ray background.
One of the first attempts to compare the properties of Seyfert 2s that do and do not have evidence for polarized broad lines was presented in my first paper (Moran et al. 1992). We reported that the nuclear radio luminosities of the nine hidden Seyfert 1s known at that time are all high compared to the general Seyfert population. This suggested that perhaps there are two types of Seyfert 2s — hidden Seyfert 1s and “true” Seyfert 2s. Current investigations center around luminosity differences as well, and as with our early attempt, it’s the interpretation of those differences that presents the main challenge.
4.1. Comparing Properties: HBLRs vs. Non-HBLRs
A number of authors have compared the properties of HBLR and non-HBLR Seyfert 2s. These include those who have conducted spectropolarimetry studies, as well as those who have performed larger meta-analyses based on collections of results from the literature (e.g., see papers by Q. Gu and collaborators). The literature samples afford greater statistical power, although systematic effects or biases in the original samples will be reinforced (if not amplified) under this approach.
The radio luminosities of HBLR and non-HBLR Seyfert 2s apparently do differ, though not to the extent that we originally noted. I should point out that some of the comparisons have been made using total (or nearly so) radio flux densities obtained from the NVSS. The radio luminosities of Seyfert nuclei are often comparable to those of their host galaxies, so using the total emission can hinder the comparison when the nucleus does not dominate. In terms of total radio emission, Lumsden et al. (2001) found no evidence for HBLR Seyfert 2s to be more powerful radio sources than non-HBLRs, while Gu & Huang (2002) and Tran (2003) report that HBLRs tend to be significantly stronger sources. Thean et al. (2001) found that core radio luminosities are higher on average among HBLRs; only a marginal difference was observed in the Lumsden et al. (2001) study.
The luminosity of the [O III] 5007 line represents an isotropic indicator of the nuclear luminosity in an AGN, provided that the narrow-line regions of objects are similar (e.g., in terms of density and covering fraction), that the spectroscopic data have been acquired under photometric conditions, and that other factors (e.g., slit losses and internal reddening corrections) are not major sources of additional uncertainty. All of the above authors have found that HBLRs tend to be more luminous [O III] emitters than non-HBLRs, though it should be noted that there is significant overlap between the two populations.
Similarly, all previous studies have found that HBLRs tend to have warmer far-infrared colors (i.e., higher ratios) than non-HBLRs. The effect was first discussed by Heisler et al. (1997), who reported that the distribution in this parameter is bimodal for HBLRs and non-HBLRs. Lumsden et al. (2001) confirmed the result with their expanded sample, and strong differences in the FIR colors of HBLRs and non-HBLRs are present in the CfA/12 m sample (Tran 2003) and in the literature as a whole (Gu & Huang 2002). As the FIR emission of AGNs tends to be warm and that of their host galaxies tends to be cool, we can conclude that HBLRs contribute a greater fraction of the total flux in the large IRAS beam than non-HBLRs do, which suggests that the HBLRs are intrinsically more luminous.
In summary, spectropolarimetry surveys performed to date have found there to be significant differences between HBLRs and non-HBLRs in properties that relate to the luminosity of the nucleus. Do these differences point to two types of Seyfert 2s? Given essentially the same evidence, various authors have come down on different sides of the debate. Tran (2001, 2003) has argued that the higher luminosities of the HBLRs in his sample, coupled with the similarity between HBLRs and Seyfert 1s in comparisons of orientation-independent parameters, suggest there are two populations of Seyfert 2 nuclei. Others (Kay 1994; Lumsden et al. 2001; Lumsden & Alexander 2001; Gu & Huang 2002) have countered that, all things being equal, polarized broad emission lines should be easier to detect among nuclei of higher luminosity. In such cases there is greater contrast between the scattered nuclear component and the unpolarized bulge starlight in the spectrograph aperture, which should make it easier to detect a weak polarization signal. Lumsden et al. (2001) demonstrated the plausibility of this argument by showing that the equivalent width of the [O III] line — which represents the contrast between the nuclear line emission and the diluting host-galaxy flux — is higher in HBLRs than in non-HBLRs.
4.2. UW89 Results
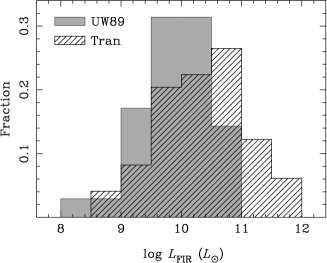
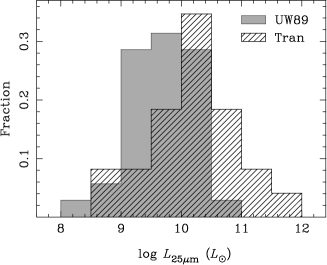
Our spectropolarimetry observations of the UW89 Seyfert 2s are valuable for two reasons. First, they are sensitive, owing to the large aperture of Keck and the excellent image quality often obtained on Mauna Kea, which permits the use of a narrow slit (and the exclusion of much of the unpolarized bulge starlight). Second, our sample is distance-limited, and it differs significantly from the samples used in previous studies. The IRAS-selected sample of Lumsden et al. (2001) and the CfA/12 m sample of Tran (2003) are both flux-limited. Thus, despite the fact that they are complete and clearly defined, they must to some degree suffer from Malmquist effects, i.e., an over-representation of rare, luminous objects, and an under-representation of the weaker objects that dominate the population. A distance-limited sample should more accurately represent the true distribution of luminosities in a given population. As Figure 1 illustrates, the far-infrared and 25 m luminosities of the CfA/12 m objects are indeed biased to higher values relative to the UW89 sample. In terms of , which provides a good measure of the strength of the nucleus (Lumsden & Alexander 2001), two-thirds of the CfA/12 m objects are brighter than ; two-thirds of the UW89 galaxies are less luminous than this.
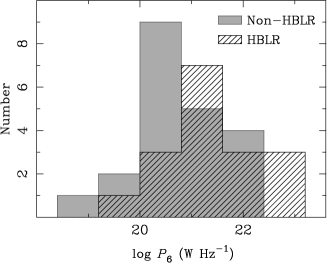
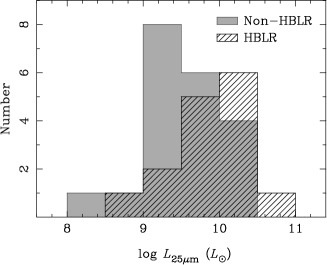
A comparison of the nuclear radio and mid-IR luminosities of the HBLRs and non-HBLRs in the UW89 sample is displayed in Figure 2. The HBLRs tend to be more luminous sources, but the differences are not nearly as dramatic as previous reports have indicated. And unlike the CfA/12 m objects, some of the UW89 HBLRs are found in genuine low-luminosity objects. For example, only 2/22 CfA/12 m HBLRs are less luminous than , whereas over half of the UW89 HBLRs have .
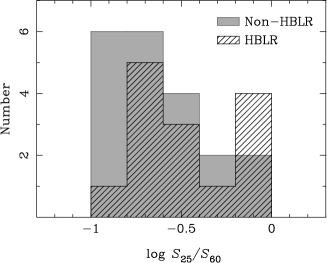
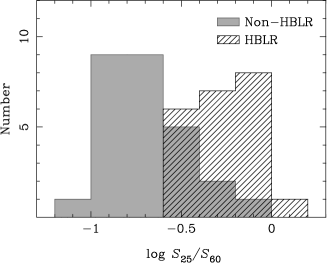
We have obtained similar results for the IR colors of the UW89 Seyfert 2s. As shown in Figure 3, the HBLRs tend to be a little warmer, but their ratios cover the same range of values as the non-HBLRs, and the differences in the distributions do not appear to be that significant. In contrast, there is a much greater division of the IR colors of HBLRs and non-HBLRs in the CfA/12 m sample.
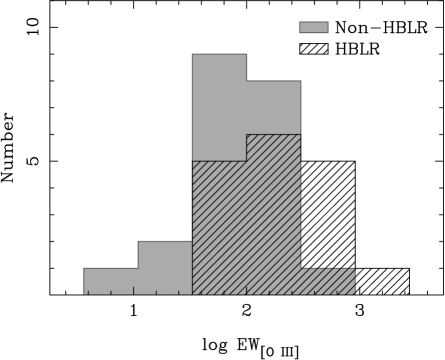
In Figure 4, we plot the distribution of [O III] equivalent widths (EWs) for the UW89 sample. The measurements were made directly from our spectropolarimetry data, so they reflect the contrast between the nucleus and host galaxy in our observations. While the objects with the highest EWs are HBLRs and those with lowest EWs are not, there is a great deal of overlap between the EW distributions — far more than that present in the Lumsden et al. (2001) study.
Finally, we consider the X-ray properties of the UW89 Seyfert 2s, which have been discussed by Moran et al. (2001) and Cardamone, Moran, & Kay (2007). Although the UW89 sample consists of the nearest Seyfert 2s, their observed luminosities are modest. As a result, many of the objects were only weakly detected in long ASCA observations. Coupled with the likelihood that a number of them are Compton-thick, we are not in a position to compare the absorption column densities or the intrinsic X-ray luminosities of the HBLRs and non-HBLRs in the sample. However, we have constructed composite 1–10 keV X-ray spectra for the two groups of objects (see Fig. 5). Overall, the composite spectra have the same basic shape, indicating that the objects in both groups are heavily absorbed sources. Collectively, the non-HBLRs are less bright than the HBLRs, and, as evidenced by the large equivalent width of the Fe line, they are probably more absorbed on average.

5. What Does It All Mean?
One of the important lessons we have learned from our survey is that bigger is better. Before turning to Keck, we observed much of the UW89 sample with the Lick 3-m for a few hours per galaxy. Several objects — NGC 591, NGC 2273, NGC 5347, and NGC 5929 — showed nothing in the 3-m data. But in just 20 minutes apiece with Keck, we were able to detect polarized broad lines in them. The moral is: Take care when interpreting spectropolarimetry non-detections.
On one level, the results of the UW89 survey are consistent with those of previous studies — just under half of the objects are HBLRs, and these tend to be more luminous than the non-HBLRs. However, we have detected HBLRs in some intrinsically weak objects whose luminosities fall within ranges formerly occupied only by non-HBLRs. In addition, the differences between the two groups are not that pronounced in our survey. In particular, the well-known dichotomy in the IR colors of HBLRs and non-HBLRs is considerably weaker in the UW89 sample. Taken together, these results cast doubt on the existence of a significant population of “true” Seyfert 2s.
Overall, our findings support the idea that the luminosity differences we observe arise (in part) because a weak polarization signal is easier to detect in objects with brighter nuclei. But the significant overlap we see in the properties of HBLRs and non-HBLRs suggests that luminosity is not the only factor relevant to the detection of polarized broad lines. If it were, we would expect a greater separation between HBLRs and non-HBLRs in the [O III] equivalent width “contrast” parameter. It seems likely that another parameter is involved — perhaps something that affects the amount of scattered flux we receive from a particular object. If so, it is probably unrelated to luminosity, given the lack of strong differences we have found among the HBLRs and non-HBLRs in the UW89 sample.
6. Future Prospects
Spectropolarimetry still has a lot to offer AGN research. Our Keck study has demonstrated that the distinction between HBLR and non-HBLR Seyfert 2s becomes blurred when sensitive data are obtained for a sample that is free of serious luminosity bias. The emphasis of future work should be on improving and enlarging the samples employed. Completeness at lower luminosities is essential, which argues for samples of the nearest objects. And future surveys should be more sensitive — most of our Keck observations were made in “survey mode” at just 20 minutes per object, which leaves plenty of room for increased sensitivity.
In addition to more robust survey results, spectropolarimetry is capable of revealing some surprises among individual objects. In the last dataset for our project, we observed the well-known Seyfert 2 galaxy NGC 2110. For some reason, this object had been passed over in other surveys at H. As Figure 6 illustrates, we have detected a spectacular double-peaked broad H line in the polarized-flux spectrum of this object (Moran et al. 2007). The line profile is similar to those of other double-peaked emitters (Eracleous & Halpern 2003). The remarkable thing is that the line profile has not been smeared out in the scattering process. The H emission originates in a disk, so most of the scattering must be done by a medium that sees that disk over a pretty narrow range of inclination angles. Future spectropolarimetry surveys may uncover similar gems.

Acknowledgments.
I would like to thank the conference organizers for the opportunity to discuss the results that have been so important to our current understanding of physical nature of AGNs. I am also grateful to my collaborators — Aaron Barth, Laura Kay, Alex Filippenko, and Mike Eracleous — for their extensive contributions to this work.
References
- (1) Antonucci, R.R.J. 1984, ApJ, 278, 499
- (2) Antonucci, R.R.J., & Miller, J.S. 1985, ApJ, 297, 621
- (3) Barth, A.J., Filippenko, A.V., & Moran, E.C. 1999, ApJ, 525, 673
- (4) Cardamone, C.N., Moran, E.C., & Kay, L.E. 2007, AJ, in press
- (5) Eracleous, M.C., & Halpern, J.P. 2003, ApJ, 599, 886
- (6) Gu, Q., & Huang, J. 2002, ApJ, 579, 205
- (7) Heisler, C.A., Lumsden, S.L., & Bailey, J.A. 1997, Nature, 385, 700
- (8) Ho, L.C., Filippenko, A.V., & Sargent, W.L.W. 1995, ApJS, 98, 477
- (9) Kay, L.E. 1990, Ph.D. thesis, Univ. of California, Santa Cruz
- (10) Kay, L.E. 1994, ApJ, 430, 196
- (11) Lumsden, S.L., & Alexander, D.M. 2001, MNRAS, 328, L32
- (12) Lumsden, S.L., Heisler, C.A., Bailey, J.A., Hough, J.H., & Young, S. 2001, MNRAS, 327, 459
- (13) Miller, J.S., & Antonucci, R.R.J. 1983, ApJ, 271, L7
- (14) Miller, J.S., & Goodrich, R.W. 1990, ApJ, 355, 456
- (15) Miller, J.S., & Goodrich, R.W., & Matthews, W.G. 1991, ApJ, 378, 47
- (16) Moran, E.C., Barth, A.J., Kay, L.E., & Filippenko, A.V. 2000, ApJ, 540, L73
- (17) Moran, E.C., et al. 2007, ApJ, in preparation
- (18) Moran, E.C., Halpern, J.P., Bothun, G.D., & Becker, R.H. 1992, AJ, 104, 990
- (19) Moran, E.C., Kay, L.E., Davis, M., Filippenko, A.V., & Barth, A.J. 2001, ApJ, 556, L75
- (20) Pogge, R.W. 1989, ApJ, 345, 730
- (21) Thean, A., Pedlar, A., Kukula, M.J., Baum, S.A., & O’Dea, C.P. 2001, MNRAS, 325, 737
- (22) Tran, H.D. 1995, 440, 597
- (23) Tran, H.D. 2001, ApJ, 554, L19
- (24) Tran, H.D. 2003, ApJ, 583, 632
- (25) Tran, H.D., Miller, J.S., & Kay, L.E. 1992, ApJ, 397, 452
- (26) Ulvestad, J.S., & Wilson, A.S. 1989, ApJ, 343, 659
- (27) Young, S., et al. 1996, MNRAS, 281, 1206