Physical properties of z 4 LBGs: differences between galaxies with and without Ly emission
Abstract
Aims. We have analysed the physical properties of z 4 Lyman Break Galaxies observed in the GOODS-S survey, in order to investigate the possible differences between galaxies where the Ly is present in emission, and those where the line is absent or in absorption.
Methods. The objects have been selected from their optical color and then spectroscopically confirmed by Vanzella et al. (2005). From the public spectra we assessed the nature of the Ly emission and divided the sample into galaxies with Ly in emission and objects without Ly line (i.e. either absent or in absorption). We have then used the complete photometry, from U band to mid infrared from the GOODS-MUSIC database, to study the observational properties of the galaxies, such as UV spectral slopes and optical to mid-infrared colors, and the possible differences between the two samples.
Finally through standard spectral fitting tecniques we have determined the physical properties of the galaxies, such as total stellar mass, stellar ages and so on, and again we have studied the possible differences between the two samples.
Results. Our results indicate that LBG with Ly in emission are on average a much younger and less massive population than the LBGs without Ly emission. Both populations are forming stars very actively and are relatively dust free, although those with line emission seem to be even less dusty on average. We briefly discuss these results in the context of recent models for the evolution of Lyman break galaxies and Ly emitters.
Key Words.:
Galaxies:distances and redshift - Galaxies: evolution - Galaxies: high redshift - Galaxies: fundamental para meters -1 Introduction
In the past years large samples of galaxies
have been found up to the highest redshifts (Iye et al. 2006, Kashikawa et al. 2006, Bouwens et al. 2004) using techniques that
rely on various color-selection criteria.
Among the various methods, one of the most efficient is the Lyman break dropout technique (Steidel & Hamilton 1993) which is sensitive to the presence of the 912 Å break and
is effective in finding star
forming galaxies. This method requires a blue spectrum, implying low to moderate dust absorption. It was first
designed to select galaxies (Steidel et al. 1996, Madau et al. 1996) with a typical magnitude limit R25.5,
and then extended to higher redshift (Steidel et al. 1999; Ouchi et al. 2004; Giavalisco et al. 2004; Dickinson et al. 2004).
An alternative technique to find such distant objects is to search
for Ly emission, through very deep, narrow band imaging at selected redshift windows, as first shown by Cowie & Hu (1998).
Ly emitters (LAEs) are generally selected to have high restframe Ly equivalent width, typically , with no constraint on the continuum.
Therefore, this method tends to select much fainter galaxies, compared to the general LBGs population. Many Ly emitters have now been found
(e.g. Iye et al. 2006, Ouchi et al. 2004, Fujita et al.2003), and several
distant large scale structures or protoclusters have been discovered
(e.g. Ouchi et al. 2005, Venemans et al. 2007).
Each of the two methods suffers from different selection bias: the two resulting galaxies population are partially overlapping,
and it is not clear what is the relation between them.
Various scenarios have been proposed to explain the properties of Ly emitters. Based on rest-frame optical photometry of LBGs, Shapley et al. (2001) concluded that LBGs with Ly in emission are ”old” (ages larger than few yr), while ”young” (ages less than 100 Myrs) LBGs have Ly in absorption. This could be explained if the young galaxies contain
dust which absorbs the Ly photons, while the older galaxies are more quiescent with less dust and superwinds which allow the Ly photons to escape.
In alternative, other groups have suggested that strong Ly emitters are instead
young star forming galaxies, as derived from the blue colors and high equivalent widths of the Ly emitters (e.g. Le Fevre et al. 1996, Malhotra Rhoads 2002; Rhoads Malhotra 2001; Tapken et al. 2004; Keel et al. 2002).
Finally some authors have suggested that galaxies could have more than one
Ly bright emission phase (e.g. Thommes & Meisenheimer 2005). An initial - primaeval - phase in which dust is virtually non-existent, and a later secondary phase in which strong galactic winds as observed in some Lyman break galaxies facilitate the escape of Ly- photons after dust has already been formed.
Clearly, it would be important to understand the real relation between galaxies with Ly emission and the general LBG population,
so that properties of the overall high redshift galaxy population, such as the total stellar mass density, can be better constrained.
To asses this issue we have analised a sample of LBGs
selected as B-dropouts from the GOODS-South sample,
and with VLT spectroscopic confirmation (Vanzella et a. 2005, Vanzella et al. 2006).
Given the good quality of the spectra it was possible to asses
whether the galaxies have
Ly in emission
or the line is absent and/or in absorption.
We have then analised how the observed properties and the derived
physical properties such as total stellar mass and age depend
on the nature of the Ly emission.
All magnitudes are in the AB system (except where otherwise stated)
and we adopt the
-CDM concordance cosmological model (, and
).
2 Sample and observational properties
From the GOODS-S public data survey we have selected all galaxies with spectroscopic redshift in the range . These galaxies were initially selected as B-band (or V band for those at ) dropouts by Giavalisco et al. (2004) (see this paper for the color selection criteria adopted) and with a z-band constrain .
Spectroscopic observations were carried out with FORS2 in the frame of the GOODS project (Vanzella et al. 2005, Vanzella et al. 2006).
The lower redshift cut is simply given by the actual
availability of FORS2 spectra, given that the Ly line falls at 5300 Å, which is at the limit of efficiency for the observation-setup used by Vanzella et al. (2006) (FORS2 plus the 300I grism)111At lower redshift spectroscopic observations have been carried out with VIMOS but data are still not available to the public.; the highest redshift cut was chosen
since at redshift higher than 4.8 ,
the spectroscopic confirmations are almost exclusively
based on the presence of the Ly line in emission,
while the objects with possible Ly in absorpion (or absent)
become progressively more difficul to identify. In fact the most distant
object identified with Ly in absorption is at z4.788.
From the public GOODS data we have retrieved the spectra,
of quality A and B. The spectra with quality flag C were only included
if our independently measured photometric redshift (from 14 bands photometry,
Grazian et al. 2006) was in agreement with the spectroscopic redshift, within the errors.
In the GOODS survey spectra are classified as emitters or absorbers, depending on the nature of the Ly line.
After removing AGNs, in the above redshift range there are 47 galaxies, of which 19 have the line in emission,
and 28 have Ly in absorption or absent.
The implied ratio of line emitters/total is quite similar
to the proportion of Ly emitters
that was found at redshift 3 in a large sample of LBGs by Steidel et al. (2000).
We will call the first sample (LBG with Line emission) and the second sample (LBGs with No line).
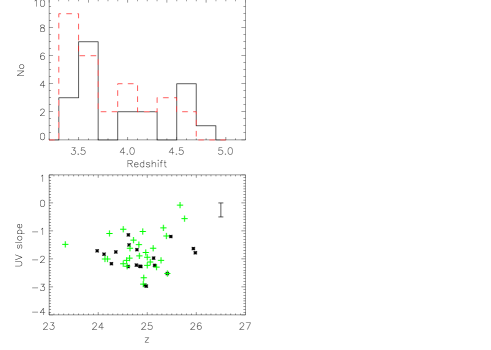
In Figure 1 (upper panel) we show the redshift
distributions of the two samples, which are similar.
From our GOODS-MUSIC database we have then gathered the complete
14 bands multicolor information,
extending from the U band to the Spitzer m band
(for details of the catalog see Grazian et al. 2006).
We have then studied the observational properties: in particular we have derived the restframe luminosity at 1400 Å, the UV continuum slope and the z-[3.6] color which enconpasses the 4000 Å break. The average observational properties of the two samples, as well as the physical properties that will be derived in the next section, are reported in Table 1, together with the uncertainties, derived using the standard deviation of the mean. In the last column of the Table we report, for each parameter, the probability value P given by the Kolmogorov-Smirnov test (KS-test) which tries to determine if the two datasets differ significantly. The KS-test has the advantage of making no assumption about the distribution of data.
The UV continuum slope was derived from the color,
which spans a restframe wavelength range from
to (at the mean redshift of the sample , and considering the central wavelengths of the ACS filters).
Although the restframe wavelength baseline is not large (and perhaps a color would be preferred), we have used the color for two reasons: for a very few galaxies we do not have J band information available
(see Grazian et al. 2006 for details); second, the UV slope derived in such way
is more easily comparable to other UV slope values in the literature.
Like other authors, we assume a standard power law spectrum with slope
(, so that a spectrum that is flat in has ). The 1216 Å break only starts to enter the i filter at z4.7 so
we neglect the impact of neutral hydrogen absorption for all galaxies.
The measured slopes are plotted in Figure 1 (lower panel) and range between
-1 and -2.5 (with few exeptions). The uncertainties on the determined
values
range from 0.2 for the brightest objects to 0.8 for the fainter ones: in the figure we have indicated a median error on the individual values of 0.5 in the upper right corner.
The average value is for the overall sample,
and and considering the and separately.
The UV slopes we find are consistent with the prediction of models for unobscured continuosly star forming galaxies (e.g. Leitherer et al. 1999). They are also consistent with what found by other authors at a similar redshift: for example Overzier et al. (2006), for redshift z4.1 LBGs and LAEs, find , Venemans et al. (2005) find for Ly emitters at z3.1. The values are also similar to the average
of V606 dropouts in GOODS found by Bouwens et al. (2006).
On the other hand our values are a bit steeper than what found by Papovich et al. (2001) for LBGs at z3 ().
Finally Shapley et al. (2003), found less steep values and claim a
considerable difference between the and at z3, with the former having a steeper slope, with a positive dependence of slope on the
Ly equivalent width.
As can be seen in Figure 1, the values of the UV slopes for and are largely overlapping and a K-S does not reject the hypothesis that the two samples could be
drawn from the same underlaying distribution (the probability P is at see Table 1).
However the median values are indeed somewhat different, and the trend is the same as what found by Shapley et al. (2003) given that the are
bluer on average than the .
The difference between our two samples ()
is actually similar to that found by Shapley et al. (2003), who have a between their most extreme groups i.e. the
strong emitters and the strong absorbers (see Table 3 of the mentioned paper), but the significance of their is higher, given that they have a much larger sample with 800 objects in total, and therefore the uncertainties on the average values are much lower than in our case.
In conclusion, although we cannot claim such a strong dependence of on the
Ly properties, we do indeed find a mild indication that are bluer than .
To support this result, a similar difference is also found for
LBG galaxies by Vanzella et al. (2006),
who performed spectroscopy of B dropouts from the GOODS sample, and then stacking the spectra of galaxies with Ly in emission and in absorption separately
found that the former have a systematically bluer
UV continuum than the latter.
We find no evidence for a slope-magnitude relation as found by other authors
(e.g. Overzier et al. 2006 ) but the errors on the slope are quite large and the wavelength baseline for the slopes is rather small.
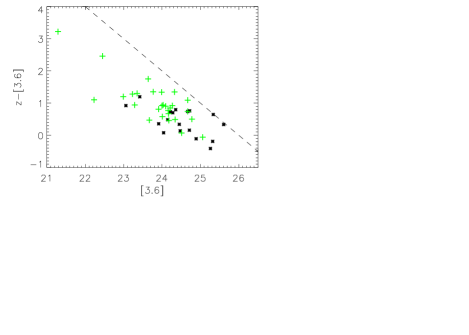
In Figure 2
we show the color plotted versus the total magnitude:
this color encompass the 4000Å/Balmer breaks, and is sensitive both to dust and stellar ages. The magnitude
corresponds to a rest-frame optical magnitude.
The strong correlation between the optical flux and color is
due to the magnitude cut at that was used for the sample (see dotted line).
It is clear from the figure that the are on average both brighter
(by magnitudes) at restframe optical wavelengths and redder (by more than half
a magnitude) than the .
Given that all objects are relatively dust free
(as inferred from the UV spectral slopes and
consistently with the Lyman Break selection criteria),
these differences indicate that the have in general a more evolved
stellar population and they are more massive.
We will derive the physical properties in the next section.
3 Physical properties
3.1 Method
Using the multiwavelength GOODS-MUSIC data and the spectroscopic redshifts, we have then determined the physical properties of these galaxies, through a spectral fitting technique. The spectral fitting technique adopted here is the same that has been developed in previous papers (Fontana et al. 2003, Fontana et al. 2006), and similar to those adopted by other groups in the literature (e.g. Dickinson et al. 2003, Drory et al. 2004). Briefly, it is based on the comparison between the observed multicolor distribution of each object and a set of templates, computed with standard spectral synthesis models (Bruzual & Charlot 2003 in our case), and chosen to broadly encompass the variety of star–formation histories, metallicities and extinction of real galaxies. To compare with previous works, we have used the Salpeter IMF, ranging over a set of metallicities (from to ) and dust extinction (, with a Calzetti or a Small Magellanic Cloud extinction curve). Details are given in Table 1 of Fontana et al. (2004). For each model of this grid, we have computed the expected magnitudes in our filter set, and found the best–fitting template with a standard minimization. The stellar mass and other best–fit parameters of the galaxy, like SFR estimated from the UV luminosity and corrected for dust obscuration (with a typical correction factor of ), age, (the star formation e-folding timescale), metallicity and dust extinction, are fitted simultaneously to the actual SED of the observed galaxy. The derivation of these parameters is explained in detail in the above paper and in Fontana et al. (2006), where also the uncertainties are discussed. In particular we note here that the stellar mass generally turns out to be the least sensitive to variations in input model assumptions, and the extension of the SEDs to the IRAC mid-IR data, tends to reduce considerably the formal uncertainties on the derived stellar masses. On the other hand, the physical parameter with highest associated uncertainty is the metallicity, given that the models are strongly degenerate when fitting broad band SEDs; a further limitation is that only 4 values were allowed in the modelling, i.e. 0.2,0.02, 1 and 2.5 (respectively subsolar, solar and supersolar metallicity), but in our samples none of the galaxies turned out to have a metallicity of 2.5.
3.2 Results
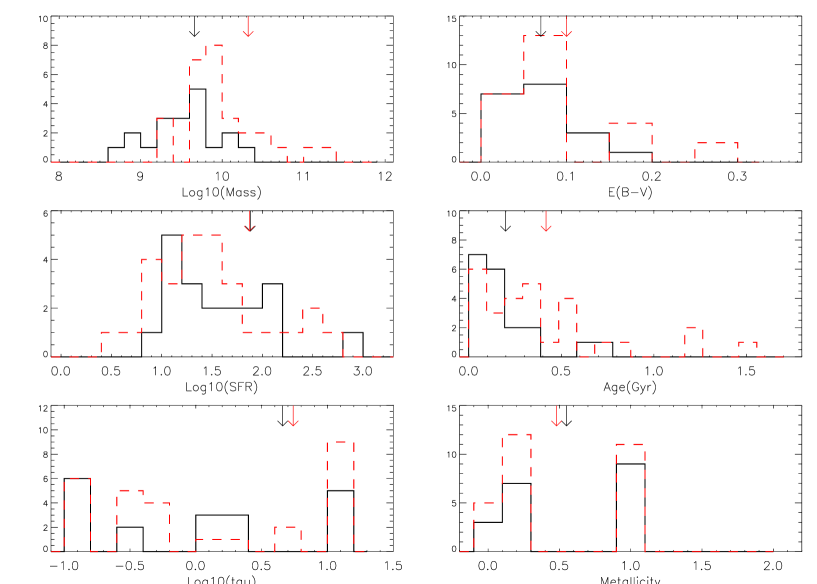
In Figure 3 we plot the distribution of the four basic physical parameters for the two samples, namely the total stellar mass, the star formation rate, the derived stellar age and the E(B-V). In each figure we also indicate with an arrow the average values calculated for each sample.
Both the total stellar masses and the median ages are considerably
lower for the compared to the .
The average mass is for the and
for the others, i.e. a factor of almost five higher.
The K-S test gives a very low value, implying that the two
populations are different from each other
with probability. We can therefore conclude that the
are a factor of almost 5 less massive than the .
The median ages are also quite different, with an average of Myr
for the , an age distribution that is very peaked
towards small ages and is basically confined to values below 300 Myr.
The on the other hand have an average age of Myr
(a factor 2 higher)
and there are several galaxies with ages exceeding 1 Gyr, which is a considerable fraction of the cosmic time at redshift .
Again performing a K-S test, the two populations are
different with a probability .
We can conclude that the are significantly younger galaxies compared to the \̇\
The star formation rates do not differ much for the two samples,
with median values that are almost equal, and respectively and very similar distributions.
The exctinction values are slightly higher for the with , while the have .
In both cases the K-S test does not reject
the hypothesis that the 2 groups are drawn from the same population of galaxies, although the average E(B-V) is higher for the .
Therefore both and are galaxies with relatively little dust content, and significant star formation rates.
In particular the average E(B-V) is quite lower than the average values found by Shapley et al (2003) at redshift 3 and Ouchi et al. (2004) at redshift 4 but we find the same tendency for to have somewhat higher dust content compared to which is also supported by the difference in the UV spectral slopes discussed in the previous section.
The final two physical parameters that come as output
from the modelling are the metallicity, and i.e.
the star formation e-folding timescale.
Each of them suffers from larger uncertainties as compared to e.g. the
total stellar mass, as already discussed before.
The mean values and the total distribution for
these two parameters are very similar both for and ,
with the K-S test indicating that they are drawn from the same population.
A more interesting and better constrained
quantity to determine is the parameter
that is an indication of the evolutionary state of the galaxies.
It can be shown that passively evolving galaxies can be selected
according to the physical criterion (Grazian et al. 2006).
All galaxies in our sample, both and have
as expected: however the difference in age discussed before
is reflected also on the difference in , which is relatively
larger for with a mean value
of while for the mean value is 0.33.
Furthermore all but one have
while amongst there are 7 objects with values between 1 and 4.
From this data we conclude that the seem to be a population of younger and less massive galaxies. Given that all galaxies have relatively low dust content, there are some indication that might be relatively less dusty than in general, based on the results presented here and by other authors (Vanzella et al. 2006, Shapley et al. 2003 and Overzier et al. 2006). The star formation rates are high in all cases and are independent on the nature of the Ly emission.
4 Discussion and Conclusions
The results obtained here seem to point towards a scenario where
are young and relatively
small galaxies compared to the general LBGs population, are basically unobscured and are forming stars at very high rates.
on the other hand, are more massive, with masses as high as 10, and span a larger range of ages from few tens of Myrs to more than 1 Gyr. They are forming stars at comparable rates and are also relatively unobscured galaxies, although they appear slightly redder than .
This is therefore partially at variance with the only comparable large study, carried out at redshift 3 by Shapley et al. (2003), who found a tendency for to have in general higher ages, lower values of E(B-V) and higher star formation rates. A very similar work by Iwata et al. (2005) on z LBGs from the Hubble Deep Field-South, also examined the relationship between spectroscopic features and parameters of the best-fit stellar population models in a sample of spectroscopically confirmed galaxies. They did not find any clear correlation between the Ly emission, Ly equivalent widths and the results of SED fitting. However the absence of any clear trend may be attributed to the very small number of sample galaxies in their study (13 in total).
Some other observational studies seem to support our results:
for example Overzier et al. (2006) find similar trends for a small
sample of LBGs and LAEe in a z4.1 protocluster, with indications that
LAEs are young, dust free objects with blue UV optical colors and
possibly less massive that UV selected LBGs with comparable star formation rates.
At higher redshift, Lai et al. (2006) constrained the ages of Ly emitters
at redshift 5 and found typical ages 50-100 Myr, i.e. comparable to our .
Finally at redshift 3, Gawiser et al. (2006) analised a sample of narrow band selected Ly emitters at z 3 and concluded that they appear to have much less dust and lower stellar masses, compared to the generic LBG population at the same redshift. They were not able to constrain ages, which had a large range of allowed values.
However given that they started from a narrow band sample, their objects are in general much fainter than the general LBGs population at the same redshift
and clearly they are not selected to have the same broadband optical colors as the LBGs at the same redshift.
In our case the optical colors and absolute restframe UV luminosity
of the and are equal.
Our results give support to models that consider the Ly emitters as precursors of spheroid galaxies, observed during the initial starburst phase, which is confined to a short period after its onset, due to the rapid formation of dust. Interestingly one such model (Thommes & Meisenheimer 2005) attempts to constrain the duration of this initial phase from observational data, finding Myr. A very similar results was recently found by Mori & Umemura (2006) from simulation with a N body/hydrodynamics code: they follow the early stages of galaxy formation and find a first phase characterised by strong Ly emission, which after 3 years quickly declines to fluxes below the observable level. The ages found in these models, are very similar to the range of allowed ages for our as shown in Figure 3; on the other hand many of the have ages exceeding 300 Myr. Clearly there are also very few with larger ages and most of all, there are several which are very young, with ages of a few tens of Myrs. The first few outliers could be easily accounted for given that the modelled physical parameter are obviously subject to uncertainties. However the very young i.e. primeval objects without Ly emission are hard to fit within the simple scenario proposed above. Probably more complex models in which the time scales for dust formation in primeval galaxies is variable and depends on other factors have to be invoked. In this context, several scenarios have been proposed, for example where the differential attenuation of the Ly and continuum photons depends on the clumpyness of the medium (e.g. Hansen & Oh 2006), or where the timescales for the Ly emission varies for galaxies residing in halos of different sizes, in the sense that in the most massive halos the Ly luminosity declines abruptly after a much shorter time ( ys) than in less massive halos (Mao et al. 2007). However a full discussion of the models is beyond the scope of this paper.
Finally it also remains unclear whether the are actually dustier than the , which would be a natural consequence of this model: we do indeed find that are slightly bluer than (with the slope determined directly from the observed colors) and consequently have on average lower E(B-V) parameter, as derived from the spectral fitting. However the differences are not very large. An important independent check would be to assess the dust content e.g. from far IR observations, rather than through the E(B-V) which is subject to larger uncertainties and is strongly degenerate with the fitted age.
| Property | P(K-S) | ||
|---|---|---|---|
| 19 | 28 | ||
| z | 24.89 | 24.85 | 0.99 |
| 24.6 | 23.8 | 0.02 | |
| -2.0 | -1.7 | 0.32 | |
| L(1400) (cgs) | 1.1 | 1.0 | 0.65 |
| SFR () | 76 | 74 | 0.90 |
| Age (Myrs) | 200 | 410 | 0.02 |
| E(B-V) | 0.07 | 0.10 | 0.58 |
| Mass () | 0.002 | ||
| Metallicitya | 0.55 | 0.48 | 1.0 |
| 4.5 | 5.5 | 0.96 | |
| Age/ | 0.33 | 0.99 | 0.06 |
Average observational and physical properties for the samples
of and separately: is the UV slope derived from the i-z color, L(1400) is the total luminosity at 1400Åresframe; SFR is the total instantaneous star formation rate; Mass in the total stellar mass assembled in the galaxies; is the star formation e-folding timescale.
a We remind that this parameter is the most uncertain from the SED fit output, and that only four values of metallicity were considered in the fitting
procedure, see text for more details.
References
- Bouwens et al. (2004) Bouwens, R. J., et al. 2004, ApJ, 606, L25
- Bruzual & Charlot (2003) Bruzual, G., & Charlot, S. 2003, MNRAS, 344, 1000
- Cowie & Hu (1998) Cowie, L. L., & Hu, E. M. 1998, AJ, 115, 1319
- Dickinson et al. (2003) Dickinson, M., Papovich, C., Ferguson, H.C., Budavari, T. 2003, ApJ, 587, 25
- Dickinson et al. (2004) Dickinson, M., et al. 2004, ApJ, 600, L99
- Drory et al. (2004) Drory, N., Bender, R., Feulner, G., et al. 2004, ApJ, 608, 742
- Fontana et al. (2006) Fontana, A., Salimbeni, S., Grazian, A., et al. 2006 A&A in press
- Fontana et al. (2004) Fontana, A., et al. 2004, A&A, 424, 23
- Fontana et al. (2003) Fontana, A., et al. 2003, ApJ, 594, L9
- Fujita et al. (2003) Fujita, S. S., et al. 2003, AJ, 125, 13
- Gawiser et al. (2006) Gawiser, E., et al. 2006, ApJ, 642, L13
- Giavalisco et al. (2004) Giavalisco, M., et al. 2004, ApJ, 600, L103
- Grazian et al. (2007) Grazian, A., et al. . 2007 A&A accepted astroph/0701233
- (14) Grazian, A., Fontana, A., De Santis, C., Nonino, M., Salimbeni, S., Giallongo, E., Cristiani, S., Gallozzi, S. and Vanzella, E. 2006a A&A 449, 951.
- Hansen & Oh (2006) Hansen, M., & Oh, S. P. 2006, MNRAS, 367, 979
- Iye et al. (2006) Iye, M., et al. 2006, Nature, 443, 186
- Iwata et al. (2005) Iwata, I., Inoue, A. K., & Burgarella, D. 2005, A&A, 440, 881
- Kashikawa et al. (2006) Kashikawa, N., et al. 2006, ApJ, 648, 7
- Keel et al. (2002) Keel, W. C., Wu, W., Waddington, I., Windhorst, R. A., & Pascarelle, S. M. 2002, AJ, 123, 3041
- Lai et al. (2006) Lai,K. et al. 2006, Accepted for publication in ApJ astro-ph/0610572
- Le Fevre et al. (1996) Le Fevre, O., Deltorn, J. M., Crampton, D., & Dickinson, M. 1996, ApJ, 471, L11
- Leitherer et al. (1999) Leitherer, C., et al. 1999, ApJS, 123, 3
- Madau et al. (1996) Madau, P., Ferguson, H. C., Dickinson, M. E., Giavalisco, M., Steidel, C. C., & Fruchter, A. 1996, MNRAS, 283, 1388
- Malhotra & Rhoads (2002) Malhotra, S., & Rhoads, J. E. 2002, ApJ, 565, L71
- Mao et al. (2006) Mao, J., Lapi, A., Granato, G. L., de Zotti, G., & Danese, L. 2006, ArXiv Astrophysics e-prints, arXiv:astro-ph/0611799
- Mori & Umemura (2006) Mori, M., & Umemura, M. 2006, Nature, 440, 644
- Ouchi et al. (2005) Ouchi, M., et al. 2005, ApJ, 620, L1
- Ouchi et al. (2004) Ouchi, M., et al. 2004, ApJ, 611, 660
- Overzier et al. (2006) Overzier, R. et al. 2006, ApJ submitted, astro-ph/0601223
- Papovich et al. (2001) Papovich, C., Dickinson, M., & Ferguson, H. C. 2001, ApJ, 559, 620
- Rhoads & Malhotra (2001) Rhoads, J. E., & Malhotra, S. 2001, ApJ, 563, L5
- Shapley et al. (2003) Shapley, A. E., Steidel, C. C., Pettini, M., & Adelberger, K. L. 2003, ApJ, 588, 65
- Shapley et al. (2001) Shapley, A. E., Steidel, C. C., Adelberger, K. L., Dickinson, M., Giavalisco, M., & Pettini, M. 2001, ApJ, 562, 95
- Steidel & Hamilton (1993) Steidel, C. C., & Hamilton, D. 1993, AJ, 105, 2017
- Steidel et al. (1996) Steidel, C. C., Giavalisco, M., Pettini, M., Dickinson, M., & Adelberger, K. L. 1996, ApJ, 462, L17
- Steidel et al. (2000) Steidel, C. C., Adelberger, K. L., Shapley, A. E., Pettini, M., Dickinson, M., & Giavalisco, M. 2000, ApJ, 532, 170
- Tapken et al. (2004) Tapken, C., Appenzeller, I., Mehlert, D., Noll, S., & Richling, S. 2004, A&A, 416, L1
- (38) Thommes, E., & Meisenheimer, K. 2005, A&A, 430, 877
- Vanzella et al. (2006) Vanzella, E., et al. 2006, Proceedings for the conference ”At the Edge of the Universe: Latest results from the deepest astronomical surveys”, astroph/0612182
- Vanzella et al. (2006) Vanzella, E., et al. 2006, A&A, 454, 423
- Vanzella et al. (2005) Vanzella, E., et al. 2005, A&A, 434, 53
- Venemans et al. (2007) Venemans, B. P., et al. 2007, A&A, 461, 823
- Venemans et al. (2005) Venemans, B. P., et al. 2005, A&A, 431, 793