The strong transformation of spiral galaxies infalling into massive clusters at 0.2
Abstract
We describe two peculiar galaxies falling into the massive galaxy clusters Abell 1689 (z0.18) and 2667 (z0.23) respectively. Hubble Space Telescope images show extraordinary trails composed of bright blue knots (-16.5-11.5 mag) and stellar streams associated with each of these systems. Combining optical, near and mid-infrared and radio observations we prove that while both galaxies show similar extended trails of star-forming knots, their recent star formation histories are different. One () is experiencing a strong burst of star formation, appearing as a rare example of a luminous infrared cluster galaxy. In comparison, the other () has recently ceased its star formation activity. Our model suggests that the morphologies and star formation in these galaxies have been influenced by the combined action of tidal interaction (likely with the cluster potential) and of ram pressure with the intracluster medium. These results can be used to gain more insights to the origin of S0s, dwarf and ultra-compact dwarf (UCD) cluster galaxies.
keywords:
galaxies:clusters:individual:(A1689,A2667)–galaxies:high-redshift–galaxies:evolution– galaxies:interactions–galaxies:peculiar1 Introduction
Clusters are natural laboratories to study the effects of environment on the
evolution of galaxies (Dressler 1980).
A plethora of evidence shows that the properties of
late-type galaxies depend strongly on environment: besides the well known morphology-density
relation (Dressler 1980; Whitmore et al. 1993), in local clusters (0.03)
spiral galaxies are deficient in neutral hydrogen
(Giovanelli & Haynes 1985; Cayatte et al. 1990; Bravo-Alfaro et al. 2000) and have lower star formation activity than
galaxies of similar type and size in low density environments (Lewis et al. 2002; Gómez et al. 2003; Gavazzi et al. 2006).
Various physical mechanisms have been proposed to explain the different evolution of
late type spirals in clusters and in
the field. In general, they invoke either dynamical interactions of cluster galaxies with the
hot intracluster medium (ICM, Gunn & Gott 1972; Larson et al. 1980), or gravitational interactions
with nearby companions (Merritt 1983), with the potential of the cluster (Byrd & Valtonen 1990; Valluri 1993),
or with a combination of these two (Moore et al. 1996).
Interactions with the ICM are likely to be the dominant process at the
present epoch and can account for the truncation of the gas disks in members of several
local clusters (see Boselli & Gavazzi 2006 and references therein).
However, ram-pressure cannot produce the strong morphology-density relation (Dressler 1980; Whitmore et al. 1993),
nor can it thicken the disk of a spiral galaxy and transform it into an S0
(i.e. Hinz et al. 2003; Christlein & Zabludoff 2004; Boselli et al. 2006).
This apparent contradiction could be solved if the structures form hierarchically;
that is, if galaxy clusters form not by accreting individual galaxies randomly from the field,
but rather by the infall of less massive groups along filaments.
These infalling groups have velocity dispersions that are much smaller than that of the cluster
as a whole, permitting the slow, strong interactions normally
associated with field galaxies (Fujita 2004; Mihos 2004; Dressler 2004; Cortese et al. 2006b).
Therefore a plausible evolutionary history would take into account that environmental conditions
and the physical properties of galaxies are changed significantly during cosmic time, changing the
influence of various physical mechanisms on the evolution of galaxies (Boselli & Gavazzi 2006).
However, this hypothesis is far from confirmed, since we lack detailed
understanding of the range of environmental effects that act as a function of
the age of the Universe (Dressler 2004).
Although star-forming galaxies in clusters at intermediate redshift appear more
disturbed (Oemler et al. 1997; Couch et al. 1998)
and have higher star formation activity (Butcher & Oemler 1978, 1984; Fadda et al. 2000) than local disk
galaxies, it is still an open question which mechanisms are at play and how they influence
the evolutionary history of cluster galaxies (Balogh et al. 1999; Dressler et al. 1999; Treu et al. 2003).
To solve this riddle, we need to observe galaxies that physical circumstances
and chance have revealed in rare moments of transformation.
These peculiar systems can be used to probe different environmental effects
and to constrain models of the evolutionary history of galaxies.
Much of our knowledge on the evolution of nearby galaxies in both groups (Duc et al. 2000; Iglesias-Páramo & Vílchez 2001; Sulentic et al. 2001) and clusters
(Boselli et al. 2005; Cortese et al. 2006b; Gavazzi et al. 2001; Kenney et al. 1995; Vollmer et al. 2001, 2004) has in fact come from studying of
such systems. Unfortunately this information
is difficult to extend to high redshift
because both clusters and galaxies have evolved significantly: clusters were less
relaxed (Jeltema et al. 2005) and galaxies had higher gas content. Therefore,
the effects of the same environmental mechanisms could depend strongly on
the age of the Universe.
In this paper, we present a multiwavelength analysis of two peculiar galaxies
(hereafter referred as 235144-260358 and 131124-012040) falling into the centers
of the massive clusters Abell 2667 (0.23) and Abell 1689 (0.18).
Both these systems are associated with extended
trails of bright blue knots and diffuse wisps and filaments of young stars,
features observed so far only in one other galaxy at similar redshift (Owen et al. 2006).
These two objects have been serendipitously detected by looking at the
WFPC2 and ACS images of massive clusters at z0.2. The sample of clusters
consist of the 10 clusters discussed in Smith et al. (2005) plus A2667, A2390 and
A1689. We therefore found 2 galaxies with extended trails within 13 studied
clusters all located at 0.1750.25, suggesting that we are observing a very short
snapshot of a critical stage in the evolution of these cluster galaxies.
Because these two systems have
significantly different optical luminosities ( and 0.1)
but are at similar distances from the cores of clusters of similar mass,
they represent an interesting case for a comparison of the effects of similar
environments on different-sized galaxies.
Throughout this paper we assume a cosmology
with = 0.3, = 0.7 and =
70 km/s Mpc-1, implying a distance modulus of 39.74 (40.33) mag and a linear
scale of 3.16 (3.71) kpc/arcsec for A1689 (A2667).
2 The Data
2.1 Optical Photometry
The optical photometric data for this paper are extracted from
deep images of Abell 2667 and Abell 1689.
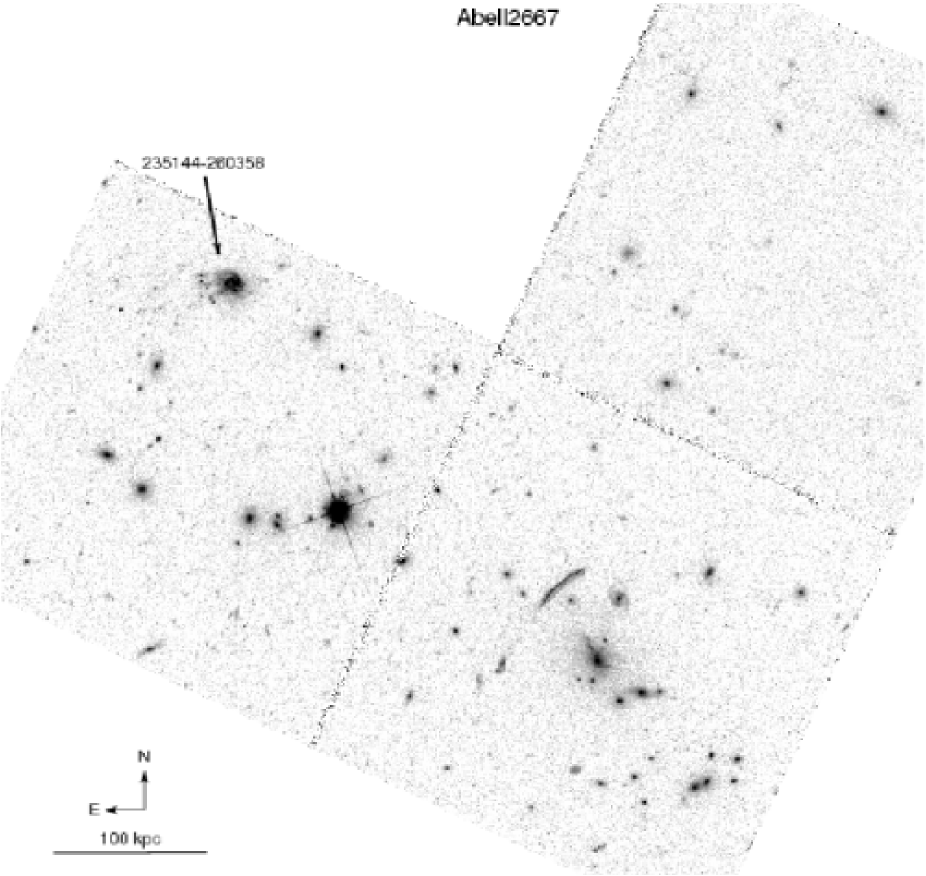
Abell 2667 was observed on 2001 October, using the Wide Field Planetary
Camera (WFPC2) for total exposures of 1200 seconds through the F450W filter,
and 4000 seconds in F606W and F814W (see Fig. 1 and Fig.3) (Covone et al. 2006a).
The 3 detection limit for point sources is 26.00, 26.00 and 25.00 mag in
the F450W, F606W, and F814W bands, respectively.
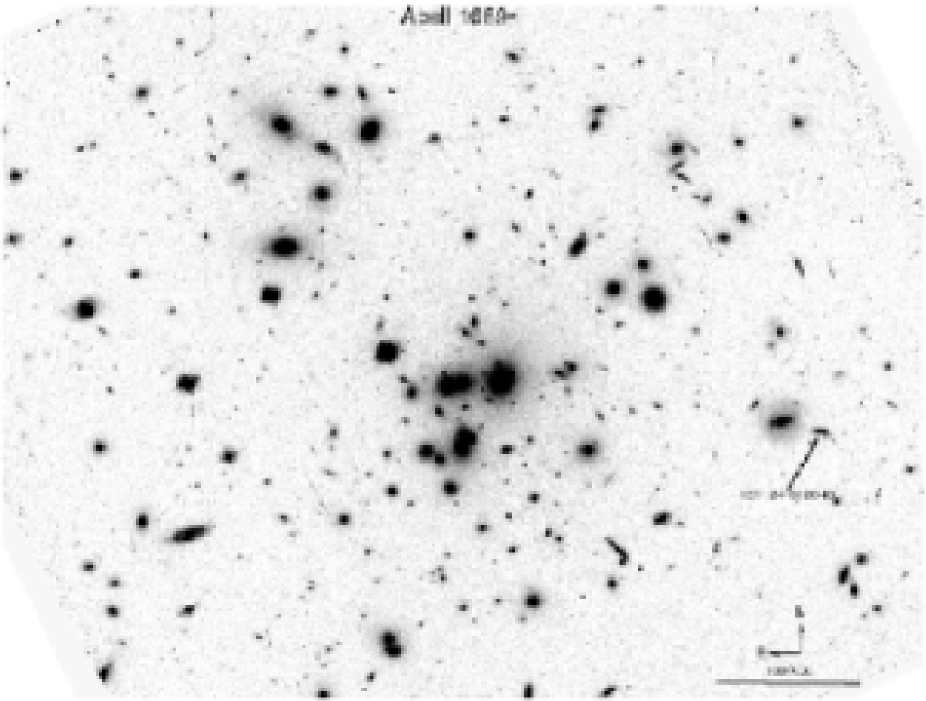
Deep observations of Abell 1689 were obtained from the ACS Guaranteed Time
observations in 2002 June (see Fig. 2 and Fig.3).
A total of 20 orbits (13.2 h) were taken in the three passbands F475W, F625W and
F850LP (Broadhurst et al. 2005).
The 3 detection limit for point sources is 29.70, 29.20 and 28.30 mag in the filters
F475W, F625W, F850LP respectively.
We used SExtractor (Bertin & Arnouts 1996) to detect and analyze the sources.
For source detection, we used an image averaging the three band-passes; magnitudes
were then determined from aperture photometry on the separate
images for each filter. All magnitudes are in the VEGAMAG systems.
No correction for Galactic extinction was performed (0.07 mag).
Surface brightness profiles for these galaxies were computed using
the task ellipse within IRAF.
The ellipticity and position angle were determined using the I band images
following the procedure of Gavazzi et al. (2000).
The disturbed morphologies of 235144-260358 in A2667 could possibly affect the shape of the surface brightness
profiles at large radii (in particular at shorter wavelengths), but not in the central regions where both the objects
still present a reasonably symmetrical shape. This is not the case of the edge-on spiral 131124-012040 which does
not show strong asymmetries within the optical radius.
2.2 Near Infrared Photometry
Near-infrared H band observations for Abell 2667 and Abell 1689 were obtained with ISAAC on the Very Large Telescope (VLT) in the spring of 2003 (ESO Programs 071.A-0428, PI. Kneib and 067.A-0095 PI. Knudsen), under photometric sky conditions with a mean seeing of 0.41 arcsec and 0.58 arcsec respectively. The total exposure time of 6529s for each cluster corresponds to a 5 detection limit for point sources of 24.6 mag. All these observations have been reduced as described in Richard et al. (2006).
2.3 Mid Infrared Photometry
Spitzer imaging observations of Abell 2667 and Abell 1689 were obtained as part
of the GTO Lensing Cluster Survey (program 83, PI G. Rieke).
MIPS (Rieke et al. 2004) 24 images were obtained in photometry mode, with a total
exposure time of 2700s. The data were processed and
mosaicked following the procedures described in Egami et al. (2006).
Point source extraction and photometry were performed using DAOPHOT (Stetson 1987) as described
in Papovich et al. (2004). A PSF was constructed from the best-measured 30 point sources in the field; the Tiny Tim model of the 24m
PSF (Krist 1995) was used to compute the aperture
correction. 131124-012040 in Abell 1689 is not detected in MIPS images. We derived a 3 limit using
a photometry aperture radius of 6 arcsec, a sky annulus between 6 and 13 arcsec and an aperture correction of 1.698
IRAC (Fazio et al. 2004) four-bands (3.6, 4.5, 5.8 and 8.0) imaging was also obtained, with a total exposure time of
2400s per band for each cluster. Basic calibrated data were combined using
a custom IDL mosaicking routine.
For A2667 photometry was performed within apertures of radius 8.3 arcsec
and no aperture corrections were applied because they are small with this large an extraction aperture.
On the contrary in A1689 photometry was performed within a smaller aperture to
avoid light contamination from nearby sources. We adopted a radius 2.4 arcsec, sky annulus between
2.4 and 7.2 arcsec and aperture corrections of 1.213, 1.234, 1.379 and 1.584 at 3.6, 4.5, 5.8 and 8.0
respectively.
2.4 Radio continuum observations
We obtained a 20 cm radio continuum measurement of 1.4 mJy for the
galaxy in A2667 from the 1.4 GHz NVSS continuum survey. As this survey offers rather poor spatial resolution (45
arcsec), we also constructed a 20 cm map using higher
resolution data from the NRAO VLA data-archive.
Two different observations are available on A 2667 at this frequency:
1) it was observed in October 2001 for 3590 seconds in
correlator mode 4, with a bandwidth of 25 MHz, and using
the CD-configuration (due to the low declination); and 2.)
a 3620 second observation was obtained in September 2002
with the same correlator mode and bandwidth, but in the BC
configuration. We applied
standard VLA calibration and imaging procedures with AIPS.
We then combined the two data sets in the UV-plane using DBCON.
Images were generated with the task IMAGR and a weighting
option robust=0, producing a map
intermediate between natural and uniform weighting.
After CLEANing, the resulting continuum map has
a beam size of 16.7 13.1 arcsec and an average rms noise of
0.12 mJy/beam.
This map is shown in Fig.6, superposed on the HST
image.
The cluster A 1689 was observed with the VLA for a total of 17405
seconds in the A-configuration in November 2000 and March 2002.
Combining the data sets using natural weighting (to improve
the sensitivity) we produced a
map with a beam size of 2.1 1.6 arcsec, and an
average rms of 0.15mJy/beam.
No emission is detected at the position of the infalling galaxy.
Taking a conservative detection threshold
of 6 we estimate an upper limit of 0.90 mJy for the 20 cm
radio continuum flux.
2.5 Optical spectroscopy
We obtained optical spectroscopy for 131124-012040 in Abell 1689 as part of a wide
field () spectroscopic survey of the whole cluster (Czoske 2004, Czoske
et al. 2007, in preparation) using VIMOS on the VLT (Program 71.A-3065, P.I. Czoske).
The LR-Blue grism was used, which provided a resolution
of over a wavelength range from 3750 Å to 6750 Å.
The dispersion was 5.35 Å per pixel.
We obtained three exposures of 840 seconds, for a total of
42 minutes.
The data were reduced using VIPGI (Scodeggio et al. 2005) on site at
IASF in Milano. The reduction involved bias subtraction, identification of
the spectrum on the two-dimensional spectral image, interactive wavelength
calibration from observations of arc spectra and optimal extraction using
the method of Horne (1986). The spectrum has been flux-calibrated
from observations of a spectrophotometric standard star, Feige 110.
In addition we observed A2667 and A1689 in June 2006 with the LRIS instrument (Oke et al. 1995) on Keck I.
A 5600 Å dichroic separated the red channel of the instrument, equipped with a 400 l mm-1
grating blazed at 8500 Å, from the blue channel, equipped with a 600 l mm-1 grism blazed at 4000 Å.
This setting covers the wavelength range Å with a dispersion of 0.6/1.8 Å and
a resolution of 4.3/6.3 Å in the blue/red channel, respectively.
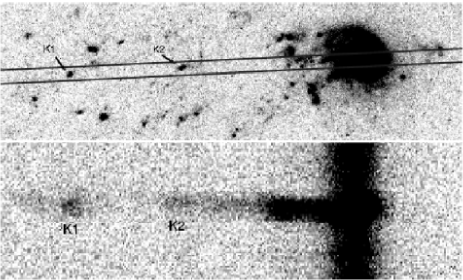
On June 29, a 175″-long and 1″-wide slit was aligned on the center
of 235144-260358 in A2667 including two of its knots (K1 and K2, see Fig.8), using a position angle of 92.7 East of North.
Two exposures of 900 s were obtained under ″seeing.
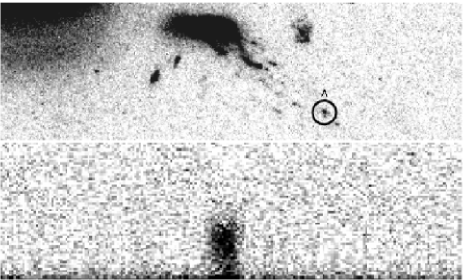
On June 30, a 30-slits mask was used on A1689 in order to target multiple-imaged candidates at the cluster center.
One blue knot associated with the disrupted galaxy was included in a 9″-long and 1″-wide slit from this mask (see Fig.8).
Four exposures of 1800 sec each have been obtained with an average seeing of 1.0″.
All these spectroscopic data were reduced using standard IRAF procedures for flat-fielding, wavelength and
flux calibrations, sky subtraction and extraction of the spectra.
Under visual inspection of the spectra we carried out the measurement of the emission and absorption
lines using the task SPLOT in IRAF.
For the spectrum of 235144-260358 in Abell 2667 we de-blended the underlying absorption from the
H emission lines as discussed in Gavazzi et al. (2004). We evaluated the Balmer decrement from the
ratio H/H (assuming =10 000 K and =100 , Osterbrock 1989) and derived the corrected
line fluxes, relative to H, using the de-reddening law of Lequeux et al. (1979).
The observed H/H ratio for 235144-260358 is 3.65 implying a gas attenuation 0.56 mag and
a stellar continuum attenuation 0.31 mag (assuming the Galactic extinction curve, Pei 1992).
2.6 X-ray Imaging
We downloaded the 9.2 ks Chandra ACIS observation of A2667 from the public archive and reduced it following the standard ”threads” from CIAO data analysis software (Version 3.3)111http://cxc.harvard.edu/ciao/index.html. We searched the exposure–corrected images for sources, using the task wavdetect with angular wavlet scales from Brandt et al. (2001) and a significance threshold of . No source is detected at the position of 235144-260358. We measure an upper limit to the 2–8 keV flux of .
3 Results
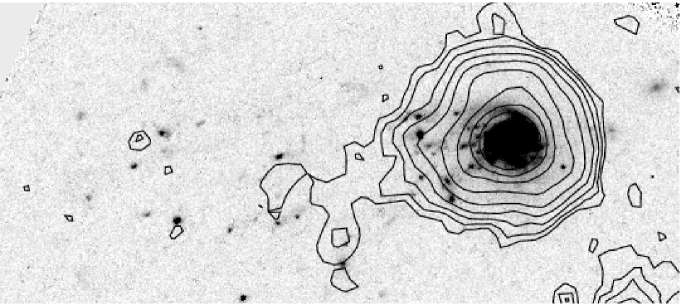
3.1 Abell 2667
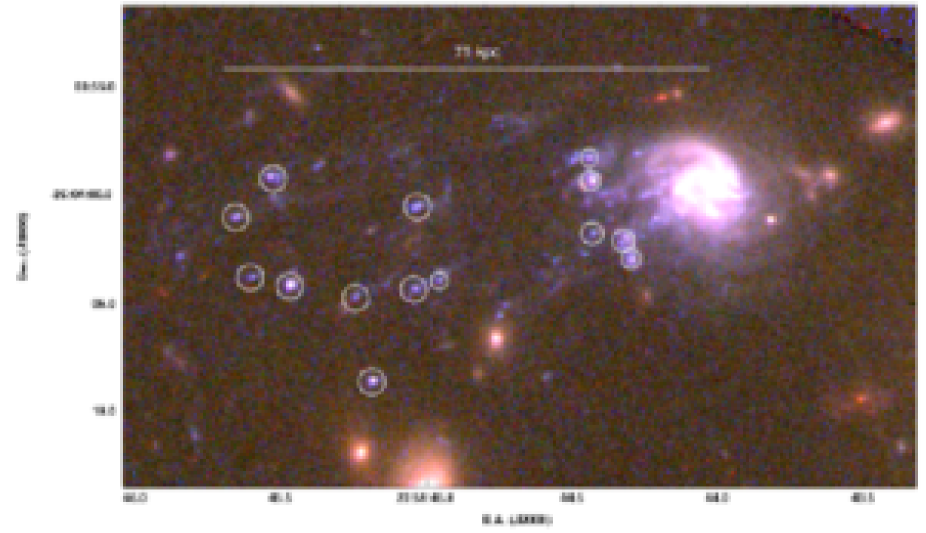
Fig. 3 (upper panel) shows an RGB image of 235144-260358 in Abell 2667,
and its global properties are summarized in Table 1.
Its optical redshift is , lying in the low velocity tail of the
velocity distribution of Abell 2667 (i.e. 830 lower than the mean cluster velocity; Covone et al. 2006a).
This face-on galaxy lies at a projected distance of 0.34 Mpc from
the cluster center (assumed to coincide with the position of the central CD galaxy of A2667, see
Fig. 1). This system is one of the brightest galaxies
in the cluster (Covone et al. 2006a), with both optical and
near infrared (-21.50, -24.50) absolute
magnitudes close to L∗ and a gas metallicity222The gas metallicity has been computed from the average
of five different empirical determinations based on:
(Zaritsky et al. 1994; McGaugh 1991),
(Kewley & Dopita 2002), (van Zee et al. 1998) and
(Dutil & Roy 1999) of 9.00.1 (i.e. 1.4 solar metallicity).
From the HST images, 235144-260358 appears to be a late-type galaxy (see Fig.3), as
confirmed by its structural parameters (see Table 1).
However this object is definitely not normal: it shows a disturbed morphology,
with clear indications of stripping within its optical disk and a prominent one-armed
spiral component as is typically observed in gravitationally perturbed
systems (Vollmer 2003).
Moreover, there is a significant nuclear enhancement in the optical surface brightness profiles ( 2 mag within
the central kpc: see Fig.4), suggesting that
it is experiencing a nuclear burst of star formation.
This spike is particularly evident in the F450W band, where the central regions cannot be fitted with a simple deVaucouleurs profile.
Spitzer observations of A2667 expand on the unusual properties of 235144-260358, since
it is detected by both IRAC (3.6-8, see also Fig.5) and MIPS (24 ).
At 0.23, the 8 m emission is dominated by a combination of
the PAH bump (m) and very small grains
continuum (Desert et al. 1990), while the old stellar population dominates at shorter wavelengths.
The observed 8/5.6 flux ratio 6.3
(corresponding to the rest frame flux ratio 6.3/4.5 ) is consistent with
the value observed in star forming galaxies (Dale et al. 2005), suggesting that the infrared emission
is due to recent star formation activity.
We used the X-ray data for a second test of whether the infrared emission
is due to a burst of star formation or to an active nucleus (AGN).
Comparing the X-ray upper limit to the 24 flux density (see Table 1)
with the help of figure 1 of Alonso-Herrero et al. (2004) confirms
that this source is not AGN–dominated: its
2–10 keV/24 flux ratio is at least 4 times too
low to lie within the range of typical AGN 333Neither
of these tests can exclude the presence of a
Compton thick AGN (Shi et al. 2005), but it is likely that the mid-infrared
output of such objects is dominated by star formation.. Finally a significant
contribution from an AGN is ruled out by the emission line ratios
obtained from the optical spectrum: -0.45,
consistent with the values typically observed in star forming galaxies (Kewley et al. 2001).
We therefore used the 8 and 24m data to derive the total infrared luminosity, ,
using the IR spectral energy distribution (SED)
from the Dale & Helou (2002) and Chary & Elbaz (2001) library following the procedure described in Marcillac et al. (2006).
This method relies on the correlations between L(IR) vs. the luminosity at 7 and vs.
shown in Chary & Elbaz (2001). The SED templates were only used to interpolate at 8 and 24 .
The resulting total infrared luminosity of 235144-260358 3(0.25) ,
implies a current star formation rate 53(4.3) (using the relation of Kennicutt 1998),
consistent with a 57 obtained from VLA continuum observations and the relation of
Condon (1992). This galaxy is a rare example of a luminous infrared galaxy (LIRG) in a dense cluster.
All the properties of 235144-260358 point out
the peculiarity of its recent evolutionary history.
However, the extended trails of bright blue knots, tracing its trajectory as
it falls into the cluster core, make it truly extraordinary.
A dozen such knots extend from the galaxy
optical disk to a projected distance of 80 kpc.
Extended blue low surface
brightness wisps and filaments lie along the same
trail, supporting the hypothesis that all of these structures result
from stripping (see Fig.3).
The knots have absolute F450W magnitudes in the range -16.80-14.80 mag,
typical of dwarf galaxies (Sandage et al. 1985) and super star clusters (Larsen & Richtler 1999), and are barely resolved in the HST image
implying an effective radius 0.45 kpc.
The radio contours shown in Fig.6 appear elongated in the
direction of the trail. A similar morphology seems also
to be present in the Spitzer 8 map shown in Fig.5,
which has the appearance of a head on the galaxy, with a tail tracing
the current star formation associated with the blue knots.
Moreover [OII] emission, not associated with any of the blue knots, extends from the galaxy for
a total length of at least 50 kpc (see Fig. 8), suggesting the presence of diffuse ionized gas along the trails as already
observed in nearby ram pressure stripped galaxies (Gavazzi et al. 2001; Yoshida et al. 2004; Cortese et al. 2006b).
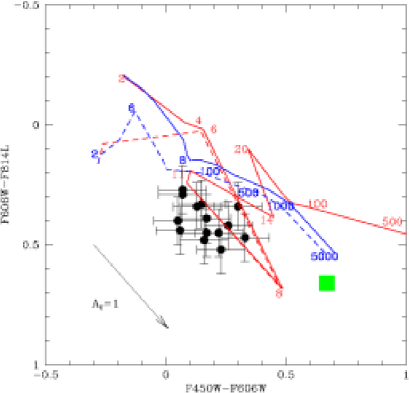
To constrain the ages of the blue knots, we compute the time evolution of
the and colors, using Starburst99 (Leitherer et al. 1999).
We assume a Salpeter IMF,
solar metallicity444We also tested a Kroupa IMF and stellar metallicities in the range 0.0040.02,
but the evolutionary paths do not significantly vary from the ones shown in Fig.9 and two different star formation histories: an instantaneous burst and continuous star formation.
For each star formation history we also compute a model including the contribution
of strong emission lines.
We redshifted the synthetic Starburst99 spectra to the cluster distance
and used the synthetic photometry package SYNPHOT in IRAF to compute the
model colors in the WFPC2 passbands.
In Fig. 9, we plot a color-color diagram for the bright knots
(black circles) to compare with the theoretical evolutionary tracks (solid and
dashed lines). We present only the colors for the brightest knots: i.e. detected in all three HST bands
(see Fig.3).
The arrow shows the effect of attenuation by dust on the observed colors, assuming a Galactic attenuation
curve (Schlegel et al. 1998).
The models with emission lines (dashed lines) appear to fit the observed colors better than those
without (solid lines).
Most of the blue knots lie slightly below the modeled tracks for
both an instantaneous burst and continuous star formation but are reasonably consistent
with an age of the episode in the range Myr in the first case and Myr in the second.
These values are probably upper limits since it is very likely that the star forming knots contain dust,
as observed in extragalactic HII regions (Gerhard et al. 2002; Cortese et al. 2004) and star
forming dwarf galaxies (Boselli et al. 2003; Cortese et al. 2006a).
Our spectra detect in emission in both the knots (K1 and K2) included on the slit (see Fig. 8) confirming
that these systems are still forming stars.
For K1 we also detected
[OIII] and H in emission ().
The H flux is corresponding to a
0.02 (not corrected for extinction).
No continuum is detected above a flux limit , implying a H
equivalent width .
The lower limit on corresponds to an age of the knots 5 Myr for an instantaneous burst (Leitherer et al. 1999).
This value is significantly shorter than the one obtained from the optical colors (see Fig. 9) implying a significant
larger amount of dust in the knots (0.5-1 mag) than the one observed in their parent galaxy (0.31 mag).
In comparison, for a continuous star formation history the value of corresponds to an age
1000 Myr, consistent with the estimate obtained from the optical colors, making this scenario much more likely.
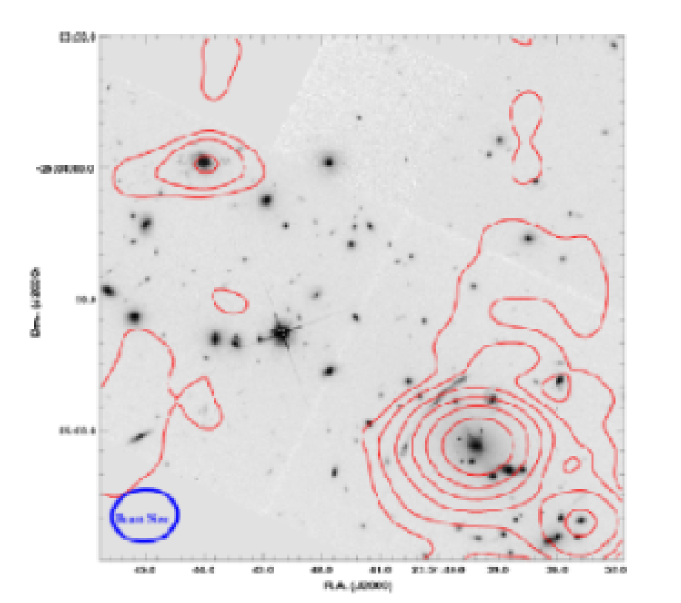
3.2 Abell 1689
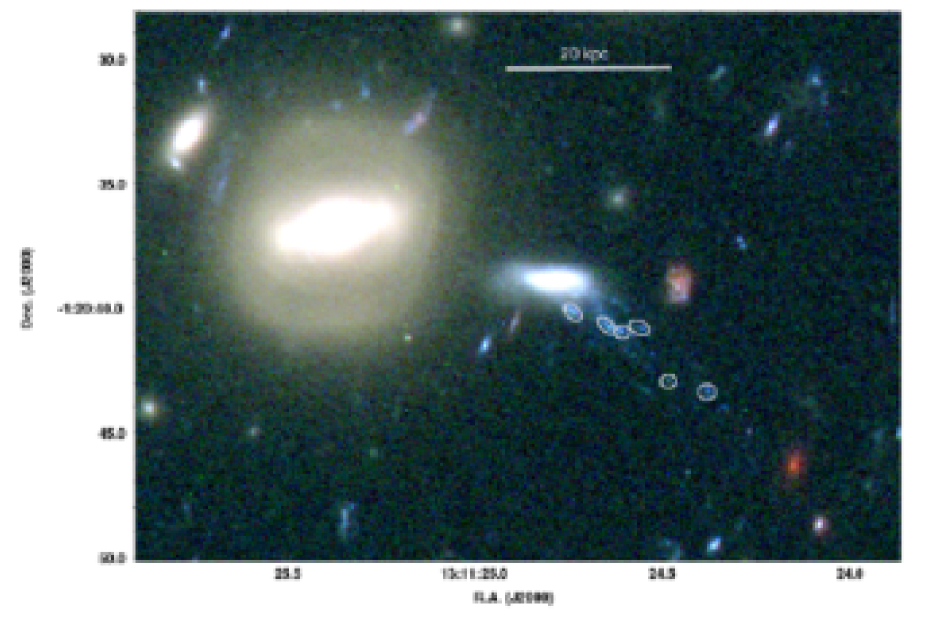
The disrupted galaxy in Abell 1689 is illustrated in Fig. 3 (lower panel) and
its main properties are listed in Table 1.
This galaxy lies at a projected distance 0.24 Mpc from the
cluster center (see Fig. 2) and is 2.5 mag fainter than the perturbed galaxy in Abell 2667
(i.e. with a luminosity of 0.1 L∗, Wilson et al. 1997).
Its redshift is 0.1866 confirming that it belongs to A1689.
Contrary to 235144-260358, the surface brightness profile of this galaxy
follows a typical exponential profile (see Fig.4). However, the slopes of
its color profiles are anomalous: in both and there is
an inversion of the color gradients, with bluer colors toward the center.
The galaxy outskirts have a color mag, 0.6 mag redder than the galaxy center and
consistent with the typical color of red sequence galaxies in the local Universe (Bernardi et al. 2003).
Similar features have been observed in spiral galaxies in the Virgo cluster and suggest recent (300 Myr) gas stripping
by ram pressure (Boselli et al. 2006).
131124-012040 is neither detected at 24 m by Spitzer nor in VLA continuum images (see Table 1).
This is consistent with the optical spectrum of this galaxy (see Fig.7),
which shows strong Balmer lines in absorption
(6 , 1.21) and very little residual
star formation ( 1.8 ).
This overall behavior suggests that the galaxy center has
recently (100 Myr, i.e. Poggianti & Barbaro 1997; Shioya et al. 2002; Kauffmann et al. 2003) stopped forming stars.
These spectral features are consistent with both a simple truncated and a post-starburst
SFH (Shioya et al. 2002; Pracy et al. 2005; Crowl & Kenney 2006), however the inverted color gradients and the absence of a
central enhancement in the surface brightness profile favor a ram pressure scenario (Bekki et al. 2005; Boselli et al. 2006).
A 30 kpc long trail, formed of at least six blue knots and
a number of wisps and filaments, is associated with this
system. The bright knots have absolute F475W magnitudes in the range -13.5-11.5 mag,
lying between dwarf galaxies and
stellar clusters ( 3 mag fainter than the knots observed in Abell 2667555ACS observation of A1689 are 3 mag deeper than WFPC2 imaging of A2667. We cannot therefore exclude that knots as faint as the one in A1689 are present also in A2667.).
The knots nearest to the galaxy are clearly resolved in the HST images and have
a typical size 0.8-0.9 kpc. In comparison, the most distant knots are not
resolved implying a physical size 0.35 kpc.
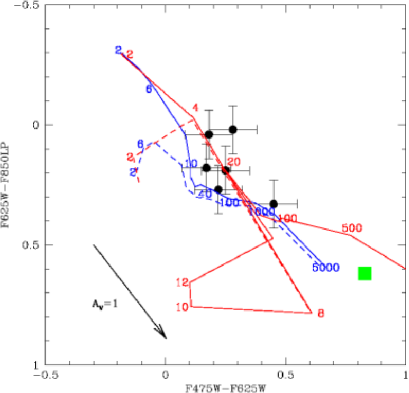
To determine the ages of the blue knots we computed the time evolution of
the and colors, as described in the previous section.
The results of our analysis are presented in Fig. 9.
Most of the knots lie within the modeled tracks for
an instantaneous burst with an age in the range 5100 Myr, and are slightly above the model for
continuous star formation with an age in the range 101000 Myr.
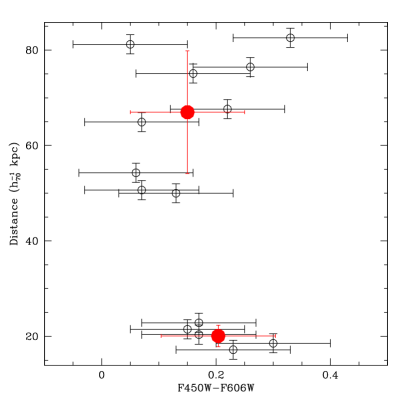
As for 235144-260358 no correlation is observed between the optical colors of the knots and their
distance from the infalling galaxy (see Fig.10).
The optical spectrum obtained for the most distant knot (Knot A in Fig.8), reveals the presence of strong
[OII] in emission (),
while no continuum is detected at a limit ,
implying an Å and showing that star formation
is still taking place in this system.
Also H emission is detected, but it lies on a bright sky line and is affected by fringing
making it impossible to use the H equivalent width to obtain an independent estimate of the age of the burst.
It is interesting to note that the time scale necessary to invert the color gradients (300 Myr) appears to be slightly
longer than the age of the trails (100 Myr), suggesting that the two features could be signatures of different physical mechanisms.
4 Environmental effects on the evolution of the infalling galaxies
The peculiar properties of the two galaxies falling into A2667 and A1689 suggest
that both galaxies are undergoing strong transformations due to
their interaction with the harsh cluster environment.
However while these objects are at similar distances from the cluster centers and
show similar extended trails of star-forming
knots, their recent star formation histories are
different. 235144-260358 is experiencing a strong burst of star formation, appearing as a rare
example of a luminous infrared cluster galaxy.
In comparison, 131124-012040 has recently ( 100 Myr) ceased
its star formation activity.
To probe this difference, we investigate the
effects of different environmental mechanisms on the properties and star formation history of these two galaxies.
The high velocity dispersion of the two clusters (1000; Covone et al. 2006a; Łokas et al. 2006) makes very unlikely
a low velocity interaction or a merger with another cluster galaxy.
This would not be the case if the two galaxies belong to smaller, kinematically distinct, dynamical units (e.g. infalling groups).
However no observational evidences support this possibility.
Therefore we will only consider high velocity galaxy-galaxy and galaxy-cluster gravitational interactions
and ram pressure stripping by the hot intracluster medium (ICM) as possible mechanisms
to explain the peculiarities of these two galaxies.
In order to reduce the number of free parameters in our model we assume that the two galaxies are falling on linear orbits into the cluster core. This very simple scenario, supported by the fact that infalling galaxies have usually highly eccentric radial orbits (Boselli & Gavazzi 2006), allow us to express the cluster-centric distance (r) as a function of the galaxy infalling velocity:
| (1) |
where is the (measured) velocity component along the line of sight and is the cluster-centric distance projected along the line of sight. Similarly, assuming that the trails of blue knots trace the galaxy’s trajectory (Moore et al. 1999), their physical length is:
| (2) |
where is their projected length and their age is:
| (3) |
This value of is based on the assumption
that the trails are at rest with respect to the cluster, and must be considered as a lower limit for the real
age of these features.
Both clusters have a 1D velocity dispersion
(Covone et al. 2006a; Łokas et al. 2006), implying a 3D
infalling velocity .
In the following we therefore assume a 3D
infalling velocity in the range between 10001730 (i.e. and ) that can be considered as upper and lower limit of the real value.
The values so derived for the cluster-centric distance, the length and the age of the trails for the upper and lower
limit of are summarized in Table 2.
4.1 Gravitational interactions
We can approximate the strengths of high velocity galaxy-galaxy and galaxy-cluster interactions by using the impulse approximation (Henriksen & Byrd 1996). The transverse and radial tidal accelerations experienced by the infalling galaxy are:
| (4) |
| (5) |
where is the mass of the perturber within , is the radius of the perturbed galaxy (assumed to be 5 effective radii (Gavazzi et al. 2000)) and is its distance from the perturber. The radial tidal field tends to accelerate the edge of a galaxy. If it is more intense than the internal galaxy acceleration, given by
| (6) |
where is the dynamical galaxy mass, it is able to strip material from the infalling galaxy. Following Gavazzi et al. (1996), we use the H-band rest frame luminosity of the two galaxies to estimate their dynamical masses within the optical radius and derive their disk rotational velocities obtaining and for 235144-260358 and 131124-012040 respectively. In the case of non-interpenetrating galaxy-galaxy interactions, the impact parameter is at least equal or greater than the galactic radius (i.e. ) implying that material is stripped from an infalling galaxy only if
| (7) |
(i.e. and for 235144-260358 and 131124-012040 respectively).
The possible perturber should not lie at a larger distance than the typical size of trails.
In Abell 2667, the brightest objects within a projected distance of 100 kpc from 235144-260358 have an H band magnitude
-24.5 mag (i.e. ), fairly consistent with the lower limit required
for effective stripping. Unfortunately their recessional velocities are unknown, making impossible a more detailed analysis of their
possible interaction with 235144-260358.
In Abell1689, the giant face-on barred spiral projected at 20 kpc NE from 131124-012040 (see Fig. 2) is the only object (within 100 kpc)
satisfying Equation 7.
However the trail of blue knots is pointing in the opposite direction than the one expected in the case of interaction between the two objects (i.e. towards the perturber) and the galaxy has a redshift of 0.1924 i.e. 1680 km/s higher than the recessional velocity of 131124-012040, making unlikely an interaction between the two objects.
To quantify the effect of tidal forces from the cluster potential well on an infalling galaxy,
we assume a NFW profile (Navarro et al. 1997) for the cluster mass distribution:
| (8) |
where
| (9) |
and and are the scale radius and concentration parameter of the mass distribution. The values
adopted for the two clusters are summarized in Table 3.
As shown in Fig.11, for both our galaxies the radial acceleration from the cluster potential is higher than the
internal acceleration for a cluster-centric distance smaller than 0.45 Mpc.
Therefore, depending on their real infalling velocity, the two objects are at the edge or are just entered the region
where material can be efficiently stripped by gravitational interactions.
This simple calculation gives a lower limit for the real efficiency of mass loss,
since higher rates will occur in the presence of substructures and infalling groups, as is likely in these
two clusters (Covone et al. 2006b; Łokas et al. 2006). Moreover, tidal heating (Taylor & Babul 2001) produced by the varying
cluster gravitational field will significantly accelerate mass loss (Gnedin 2003a, b),
although it is not considered in our model.
In contrast to the radial acceleration, which tends to strip material from an infalling galaxy,
the transverse field compresses the
interstellar medium to produce gas infall toward the center and may trigger a burst of star formation.
Gas clouds experience a velocity perturbation due to the transversal tidal acceleration
and collide with other gas clouds.
The increase in the cloud velocity can be estimated as:
| (10) |
where is the age of the interaction.
The velocity increase and cloud collision produce a density enhancement in the centre of the galaxy, which is
proportional to the Mach number () squared.
Consequently the critical mass for the cloud collapse
(which is proportional to ) decreases by a factor and, in the case of a strong perturbation, could become
smaller than the typical mass of a galactic disk HI cloud (300 , Spitzer 1978; Jog & Solomon 1992),
favoring new episodes of star formation (Henriksen & Byrd 1996).
Fig. 12 shows the ratio between the typical mass of HI clouds and the critical mass for cloud
collapse in the case of high velocity interactions, assuming and
for 235144-260358 and 131124-012040 respectively as discussed above.
It appears that in both cases high velocity galaxy-galaxy interactions
are not enough strong to trigger a burst of star formation as observed in 235144-260358.
This is not the case of galaxy-cluster interactions.
Fig. 13 shows again the ratio between the typical mass of HI clouds and the critical mass for cloud
collapse as a function of the cluster-centric distance in case of interaction with the cluster potential.
In this case two galaxies are in two different regimes, whatever are the initial conditions in our model.
While in 235144-260358 the critical mass is already below 300 and the
compressed gas is able to collapse and produce new stars, in 131124-012040 this is still not the case.
This result is consistent with our observations and
indicates that tidal forces from A2667
may have triggered the strong starburst in 235144-260358.
In summary our model suggests that gravitational interactions with the cluster potential alone are able
to strip material from the two infalling galaxies and to trigger a burst of star formation in 235144-260358.
Even if we cannot completely exclude a role of high velocity galaxy-galaxy interactions on the evolution
of these systems, it appears clear that they cannot account for all the properties of the two infalling galaxies.
4.2 Ram pressure stripping
Although the tidal interaction hypothesis is consistent with the presence of a strong starburst only in 235144-260358, it is not able to explain why 131124-012040 shows clear signs of a recent truncation of its star formation. Both A1689 and A2667 are X-ray bright clusters suggesting that the effects of the hot intracluster medium could be significant. Therefore, to estimate the effects of ram pressure stripping on the infalling galaxies, we adopt the classical Gunn & Gott (1972) criterion:
| (11) |
where is the density of the cluster medium, and are the galaxy stellar and gas density, and is the 3D infalling velocity of the galaxy (here assumed to be in the range 1000 1730 as discussed in the previous sections). We use a model density profile for the ICM:
| (12) |
(the values adopted for the different clusters are listed in Table 3). We assume that the stellar and gas distributions of our galaxies are exponential, as confirmed by their structural parameters. The gas and stellar density profiles are (Domainko et al. 2006)
| (13) |
where is the scale length of the exponential profile (i.e. 0.59 ). Assuming a gas scale length (Cayatte et al. 1994), a ratio 1, typically observed in late type galaxies (Boselli et al. 2001), and a ratio 1 (Gavazzi et al. 1996; McGaugh et al. 2000) the typical stripping radius is given by the following relation:
| (14) |
and the mass of gas stripped by ram pressure is:
| (15) |
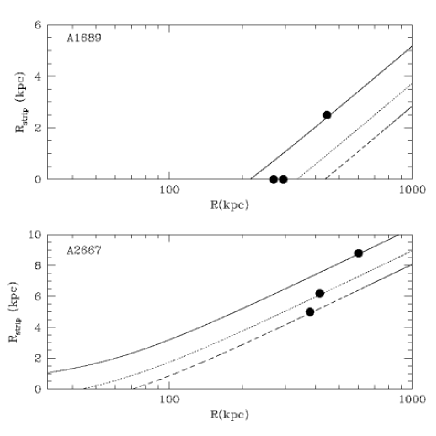
In Fig. 14 (left) we show the variation of the stripping radius as a function
of the distance from the cluster center, for three different values of the 3D infalling velocities
assumed in our model (1000, 1410 and 1730).
While at its current location 131124-012040 has almost been totally stripped by ram
pressure (), in 235144-260358 ram pressure
has only affected the outer galaxy regions ().
The same result can be analyzed in terms of HI deficiency666The
HI deficiency is defined as the difference, in logarithmic units, between the
observed HI mass and the value expected from an isolated galaxy
with the same morphological type T and optical linear diameter D:
HI DEF = (Haynes & Giovanelli 1984) (see Fig. 14 right).
131124-012040 has already lost 80 % of its original gas content and if observed in
a local cluster it would be classified
as a highly HI-deficient object.
Conversely, ram pressure has only stripped a tiny fraction of the gas from 235144-260358, whose HI
deficiency (0.25) would approximately
lie at the edge between normal and deficient galaxies (HI-deficiency 0.2).
We remark that the HI-deficiency shown in Fig.14 is not determined from observations, but is
obtained from our analytical model.
Comparing Fig.14 to Fig.11 it appears clear that ram pressure in 131124-012040 has become efficient
before gravitational interactions were able to strip material from the galaxy. This is qualitatively consistent
with the different time-scales of the interaction determined from the inversion of the color gradients ( 300 Myr, likely produced by ram pressure
stripping) and from the blue star-forming trails ( 100 Myr, clear signature of gravitational interactions).
4.3 The origin of the blue star forming knots
The mutual effects of gravitational interactions and ram pressure have already been
observed in several cluster galaxies, however the tails of blue star forming knots here discovered represent an
extremely rare feature, to our knowledge previously observed only one other
starburst galaxy in the Abell cluster 2125 (0.247, Owen et al. 2006).
The morphology and luminosity of the knots suggest that we are dealing with dwarf galaxies
and/or stellar super-clusters (Fellhauer & Kroupa 2002).
This could explain the observed difference between luminosity of the knots (2.5 mag) in
the two galaxies since the luminosity of the brightest star clusters is usually correlated with the SFR of the parent galaxy (Weidner et al. 2004).
The properties of the knots (i.e. colors and emission lines) suggest that they
are undergoing an extended period of star formation as discussed in Section 3.
From the model described in the previous sections the dynamical age of the trails results
50 Myr and 20 Myr for 235144-260358 and
131124-012040 respectively, fairly consistent777However the value of obtained in the previous section must be considered as
a lower limit since it assumes that the stripped material is at rest with regard to the cluster.
with the age inferred from their optical colors
(see Fig. 9).
It is impossible to determine whether the knots
where already forming stars when they have been stripped or
if their activity was triggered by an external mechanism once in the ICM.
We can exclude that these systems have been formed in the ICM by the accretion of
unbounded material stripped by the parent galaxies: the combined effects of the cluster tidal field and
ram pressure tend to inhibit the formation of bound systems from the collapse of stripped material (Mihos 2004).
This scenario is consistent with the numerical simulations.
Elmegreen et al. (1993) showed that gravitational interactions can lead to the formation and ejection of peripheral self
gravitationally bound clouds with masses , which begin their
life in a major burst of star formation.
Moreover Bekki & Couch (2003) have recently demonstrated that ram pressure can trigger
the collapse of stripped clouds leading to a burst of star formation, suggesting that even the formation and evolution
of the blue star forming knots is probably driven by the mutual effects of gravitational interactions and ram pressure.
Only deeper spectroscopic observations will shed light on the star formation history of these rare objects.
5 Discussion & Conclusion
The analysis in this paper allows us to propose a scenario
for the evolution of the two disturbed galaxies in Abell 2667 and Abell 1689.
These objects are currently falling into massive, gas-rich galaxy clusters with similar mass
and gas density profiles (see Table 3).
Under the combined action of tidal forces (more likely from the cluster potential) and of ram pressure
by the ICM, their morphologies and star formation are strongly perturbed.
Self gravitational bound systems are ejected
from the main galaxies and stars and ionized gas are stripped from the stellar disks
producing the observed tails of blue knots and stellar wisps
tracing the infalling trajectory of these systems into the cluster core.
Only the tidal field of Abell 2667 is able to drive a gas infall into the center of 235144-260358 triggering a nuclear burst
of star formation and making this galaxy a rare example of luminous infrared cluster galaxy.
Simultaneously ram pressure stripping by the hot intracluster medium strips the neutral hydrogen from
the galaxy outskirts but it is not able to affect the central regions where the starburst is taking place.
Conversely in 131124-012040 gravitational forces are not strong enough to trigger
the collapse of gas clouds while ram pressure is already extremely efficient.
At the present galaxy location ram pressure has stripped at least the 80% of the original neutral hydrogen content,
quenching the star formation activity in this object, as confirmed by the strong Balmer line
in absorption observed in the optical spectrum (Shioya et al. 2002) and by the inversion of the optical color gradients
along all the galaxy extent (Boselli & Gavazzi 2006; Boselli et al. 2006).
A larger statistical sample is necessary to determine whether we are witnessing
a common snapshot in the evolution of cluster galaxies or an extremely rare phenomenon.
In fact, as discussed in the Introduction, only these 2 galaxies out of 13 different clusters imaged
at 0.1750.25 show extended trails of blue knots.
Within the WFPC2 field of view (0.25 at ) there are typically 50
cluster members but only the 20% of them are spiral galaxies (Balogh et al. 2002),
implying a frequency of 1.5% (2 over 130) among cluster spirals at 0.2.
This value is fairly consistent with the expected frequency roughly obtained dividing the typical
time scale of the interaction (200 Myr) to the age of the cluster (11 Gyr).
If we are witnessing a common step of cluster galaxy evolution what can we learn by studying these two rare objects?
Abell 2667 and Abell 1689 have comparable mass and gas profiles and the two galaxies are approximately
at the same projected cluster-centric distance, suggesting that the absolute intensity of the cluster tidal field and of ram pressure
by the cluster ICM is approximately the same in the two environments.
Therefore we can speculate that the different recent evolutionary history of the infalling systems could be in part
related to their different properties (i.e. their different luminosities: and 0.1L∗).
In this case, our result suggests that giant spiral galaxies infalling into the core of massive clusters are
mainly perturbed by the gravitational interaction with the cluster.
Stars respond by forming arms and bars, while the gas flows directly toward the central region within 100 Myr.
The sinking of the gas towards the center triggers a burst of star formation and is able to alter the galaxy
morphology (Iono et al. 2004). Ram pressure stripping produces a truncation of the disk but only in the outskirts of the
galaxy being not efficient within the optical effective radius.
When all the remaining fuel has been consumed by the star formation this galaxy will not longer
appear as a disky gas rich systems but more likely as a bulge dominated quiescent spiral.
This is not the case for less massive galaxies. Ram pressure is much more efficient on low mass systems and it is able to
strip a considerable fraction of the neutral hydrogen from the inner part of these galaxies, preventing the gas from
sinking toward the center driven by tidal interaction and quenching the star formation history.
Within 1 Gyr this object will not appear as a blue spiral any more but
will probably look like an early type (e.g. red) disky spiral (Shioya et al. 2002).
The different evolutionary scenarios for the evolution of low and high mass infalling galaxies emerging from our analysis
apparently fit with recent observations and models, suggesting that the bulk of the cluster population of giant bulge
dominated early type spiral galaxies can only be formed during some kind of gravitational
interaction (Dressler 2004; Mihos 2004), while lower mass systems can be transformed by simple gas
removal from healthy spirals (Poggianti et al. 2004).
The properties of the blue knots stripped from the infalling galaxies deserve particular attention.
These systems have a luminosity (-16.5-11.5) and
a physical size ( kpc) typical of dwarf galaxies and consistent with the ultra compact dwarf
galaxies (UCD, Hilker et al. 1999; Phillipps et al. 2001), recently discovered in Abell 1689 (Mieske et al. 2004, 2005).
There are two competing formation scenarios to explain the origin of UCDs.
Bekki et al. (2003) propose that they are the remnants of stripped dwarf galaxies.
In this scenario a nucleated dwarf looses its envelope and a great part of its dark matter content due to tidal interaction
with another object. On the contrary Fellhauer & Kroupa (2002) propose that UCDa could origin from the amalgamation
of rich aggregates of young massive star clusters that can form during gravitational interactions between gas-rich galaxies.
It appears clear that the knots discovered here strongly support the second scenario, suggesting that at least part
of the population of ultra-compact dwarfs originate from young massive star clusters: we are probably
for the first time witnessing the dawn of the UCDs.
This scenario is also consistent with the recent discovery of a massive extra galactic
star cluster (, Myr) lying at a projected distance of 17 kpc from
the merger remnant NGC3310 and likely formed during the merging event (Knapp et al. 2006).
Finally the diffuse stellar streams and ionized gas observed along the trails
suggest that the mechanisms acting here
will significantly influence the properties of the intracluster light and contribute
to the enrichment of the ICM.
The results here obtained might be representative only of the clusters at 0.2 where the infalling rate
is higher and galaxies have an higher gas content than the one observed in local clusters of galaxies.
Acknowledgments
We thank the referee, D. Christlein, for his useful comments which helped us to improve and strengthen the paper. LC is supported by the U.K. Particle Physics and Astronomy Research Council. Part of the data presented herein were obtained at the W.M. Keck Observatory, which is operated as a scientific partnership among the California Institute of Technology, the University of California and the National Aeronautics and Space Administration. The Observatory was made possible by the generous financial support of the W.M. Keck Foundation.This work was partially supported by NASA contract 1255094, administered by JPL/Caltech. JR acknowledges support from Caltech
References
- Alonso-Herrero et al. (2004) Alonso-Herrero, A., Pérez-González, P. G., Rigby, J., et al. 2004, ApJS, 154, 155
- Balogh et al. (2002) Balogh, M., Bower, R. G., Smail, I., et al. 2002, MNRAS, 337, 256
- Balogh et al. (1999) Balogh, M. L., Morris, S. L., Yee, H. K. C., Carlberg, R. G., & Ellingson, E. 1999, ApJ, 527, 54
- Bekki & Couch (2003) Bekki, K. & Couch, W. J. 2003, ApJL, 596, L13
- Bekki et al. (2003) Bekki, K., Couch, W. J., Drinkwater, M. J., & Shioya, Y. 2003, MNRAS, 344, 399
- Bekki et al. (2005) Bekki, K., Couch, W. J., Shioya, Y., & Vazdekis, A. 2005, MNRAS, 359, 949
- Bernardi et al. (2003) Bernardi, M., Sheth, R. K., Annis, J., et al. 2003, AJ, 125, 1817
- Bertin & Arnouts (1996) Bertin, E. & Arnouts, S. 1996, A&AS, 117, 393
- Boselli et al. (2005) Boselli, A., Boissier, S., Cortese, L., et al. 2005, ApJL, 623, L13
- Boselli et al. (2006) Boselli, A., Boissier, S., Cortese, L., et al. 2006, ApJ, 651, 811
- Boselli & Gavazzi (2006) Boselli, A. & Gavazzi, G. 2006, PASP, 118, 517
- Boselli et al. (2001) Boselli, A., Gavazzi, G., Donas, J., & Scodeggio, M. 2001, AJ, 121, 753
- Boselli et al. (2003) Boselli, A., Gavazzi, G., & Sanvito, G. 2003, A&A, 402, 37
- Brandt et al. (2001) Brandt, W. N., Alexander, D. M., Hornschemeier, A. E., et al. 2001, AJ, 122, 2810
- Bravo-Alfaro et al. (2000) Bravo-Alfaro, H., Cayatte, V., van Gorkom, J. H., & Balkowski, C. 2000, AJ, 119, 580
- Broadhurst et al. (2005) Broadhurst, T., Benítez, N., Coe, D., et al. 2005, ApJ, 621, 53
- Butcher & Oemler (1978) Butcher, H. & Oemler, A. 1978, ApJ, 226, 559
- Butcher & Oemler (1984) Butcher, H. & Oemler, A. 1984, ApJ, 285, 426
- Byrd & Valtonen (1990) Byrd, G. & Valtonen, M. 1990, ApJ, 350, 89
- Cayatte et al. (1994) Cayatte, V., Kotanyi, C., Balkowski, C., & van Gorkom, J. H. 1994, AJ, 107, 1003
- Cayatte et al. (1990) Cayatte, V., van Gorkom, J. H., Balkowski, C., & Kotanyi, C. 1990, AJ, 100, 604
- Chary & Elbaz (2001) Chary, R. & Elbaz, D. 2001, ApJ, 556, 562
- Christlein & Zabludoff (2004) Christlein, D. & Zabludoff, A. I. 2004, ApJ, 616, 192
- Condon (1992) Condon, J. J. 1992, ARA&A, 30, 575
- Cortese et al. (2006a) Cortese, L., Boselli, A., Buat, V., et al. 2006a, ApJ, 637, 242
- Cortese et al. (2006b) Cortese, L., Gavazzi, G., Boselli, A., et al. 2006b, A&A, 453, 847
- Cortese et al. (2004) Cortese, L., Gavazzi, G., Boselli, A., & Iglesias-Paramo, J. 2004, A&A, 416, 119
- Couch et al. (1998) Couch, W. J., Barger, A. J., Smail, I., Ellis, R. S., & Sharples, R. M. 1998, ApJ, 497, 188
- Covone et al. (2006a) Covone, G., Kneib, J.-P., Soucail, G., et al. 2006a, A&A, 456, 409
- Covone et al. (2006b) Covone, G., Adami, C., Durret, F., et al. 2006b, A&A, 460, 381
- Crowl & Kenney (2006) Crowl, H. H. & Kenney, J. D. P. 2006, ApJL, 649, L75
- Czoske (2004) Czoske, O. 2004, in Outskirts of Galaxy Clusters: Intense Life in the Suburbs, ed. A. Diaferio, IAU Colloquium No. 195, Turin, 12–16 March 2004, astro-ph/0403650
- Dale et al. (2005) Dale, D. A., Bendo, G. J., Engelbracht, C. W., et al. 2005, ApJ, 633, 857
- Dale & Helou (2002) Dale, D. A. & Helou, G. 2002, ApJ, 576, 159
- Desert et al. (1990) Desert, F.-X., Boulanger, F., & Puget, J. L. 1990, A&A, 237, 215
- Domainko et al. (2006) Domainko, W., Mair, M., Kapferer, W., et al. 2006, A&A, 452, 795
- Dressler (1980) Dressler, A. 1980, ApJ, 236, 351
- Dressler (2004) Dressler, A. 2004, in Clusters of Galaxies: Probes of Cosmological Structure and Galaxy Evolution, 207
- Dressler et al. (1999) Dressler, A., Smail, I., Poggianti, B. M., et al. 1999, ApJS, 122, 51
- Duc et al. (2000) Duc, P.-A., Brinks, E., Springel, V., et al. 2000, AJ, 120, 1238
- Dutil & Roy (1999) Dutil, Y. & Roy, J. 1999, ApJ, 516, 62
- Egami et al. (2006) Egami, E., Misselt, K. A., Rieke, G. H., et al. 2006, ApJ, 647, 922
- Elmegreen et al. (1993) Elmegreen, B. G., Kaufman, M., & Thomasson, M. 1993, ApJ, 412, 90
- Fadda et al. (2000) Fadda, D., Elbaz, D., Duc, P.-A., et al. 2000, A&A, 361, 827
- Fazio et al. (2004) Fazio, G. G., Hora, J. L., Allen, L. E., et al. 2004, ApJS, 154, 10
- Fellhauer & Kroupa (2002) Fellhauer, M. & Kroupa, P. 2002, MNRAS, 330, 642
- Fujita (2004) Fujita, Y. 2004, PASJ, 56, 29
- Gavazzi et al. (2006) Gavazzi, G., Boselli, A., Cortese, L., et al. 2006, A&A, 446, 839
- Gavazzi et al. (2001) Gavazzi, G., Boselli, A., Mayer, L., et al. 2001, ApJL, 563, L23
- Gavazzi et al. (2000) Gavazzi, G., Franzetti, P., Scodeggio, M., Boselli, A., & Pierini, D. 2000, A&A, 361, 863
- Gavazzi et al. (1996) Gavazzi, G., Pierini, D., & Boselli, A. 1996, A&A, 312, 397
- Gavazzi et al. (2004) Gavazzi, G., Zaccardo, A., Sanvito, G., Boselli, A., & Bonfanti, C. 2004, A&A, 417, 499
- Gerhard et al. (2002) Gerhard, O., Arnaboldi, M., Freeman, K. C., & Okamura, S. 2002, ApJL, 580, L121
- Giovanelli & Haynes (1985) Giovanelli, R. & Haynes, M. P. 1985, ApJ, 292, 404
- Gnedin (2003a) Gnedin, O. Y. 2003a, ApJ, 589, 752
- Gnedin (2003b) Gnedin, O. Y. 2003b, ApJ, 582, 141
- Gómez et al. (2003) Gómez, P. L., Nichol, R. C., Miller, C. J., et al. 2003, ApJ, 584, 210
- Gunn & Gott (1972) Gunn, J. E. & Gott, J. R. I. 1972, ApJ, 176, 1
- Haynes & Giovanelli (1984) Haynes, M. P. & Giovanelli, R. 1984, AJ, 89, 758
- Henriksen & Byrd (1996) Henriksen, M. & Byrd, G. 1996, ApJ, 459, 82
- Hilker et al. (1999) Hilker, M., Infante, L., & Richtler, T. 1999, A&AS, 138, 55
- Hinz et al. (2003) Hinz, J. L., Rieke, G. H., & Caldwell, N. 2003, AJ, 126, 2622
- Horne (1986) Horne, K. 1986, PASP, 98, 609
- Iglesias-Páramo & Vílchez (2001) Iglesias-Páramo, J. & Vílchez, J. M. 2001, ApJ, 550, 204
- Iono et al. (2004) Iono, D., Yun, M. S., & Mihos, J. C. 2004, ApJ, 616, 199
- Jeltema et al. (2005) Jeltema, T. E., Canizares, C. R., Bautz, M. W., & Buote, D. A. 2005, ApJ, 624, 606
- Jog & Solomon (1992) Jog, C. J. & Solomon, P. M. 1992, ApJ, 387, 152
- Kauffmann et al. (2003) Kauffmann, G., Heckman, T. M., White, S. D. M., et al. 2003, MNRAS, 341, 33
- Kenney et al. (1995) Kenney, J. D. P., Rubin, V. C., Planesas, P., & Young, J. S. 1995, ApJ, 438, 135
- Kennicutt (1998) Kennicutt, R. C. 1998, ARA&A, 36, 189
- Kewley & Dopita (2002) Kewley, L. J. & Dopita, M. A. 2002, ApJS, 142, 35
- Kewley et al. (2001) Kewley, L. J., Dopita, M. A., Sutherland, R. S., Heisler, C. A., & Trevena, J. 2001, ApJ, 556, 121
- Knapp et al. (2006) Knapp, G. R., Tremonti, C. A., Rockosi, C. M., et al. 2006, AJ, 131, 859
- Krist (1995) Krist, J. 1995, in ASP Conf. Ser. 77: Astronomical Data Analysis Software and Systems IV, ed. R. A. Shaw, H. E. Payne, & J. J. E. Hayes, 349–+
- Larsen & Richtler (1999) Larsen, S. S. & Richtler, T. 1999, A&A, 345, 59
- Larson et al. (1980) Larson, R. B., Tinsley, B. M., & Caldwell, C. N. 1980, ApJ, 237, 692
- Leitherer et al. (1999) Leitherer, C., Schaerer, D., Goldader, J. D., et al. 1999, ApJS, 123, 3
- Lequeux et al. (1979) Lequeux, J., Peimbert, M., Rayo, J. F., Serrano, A., & Torres-Peimbert, S. 1979, A&A, 80, 155
- Lewis et al. (2002) Lewis, I., Balogh, M., De Propris, R., et al. 2002, MNRAS, 334, 673
- Łokas et al. (2006) Łokas, E. L., Prada, F., Wojtak, R., Moles, M., & Gottlöber, S. 2006, MNRAS, 366, L26
- Marcillac et al. (2006) Marcillac, D., Elbaz, D., Chary, R. R., et al. 2006, A&A, 451, 57
- McGaugh (1991) McGaugh, S. S. 1991, ApJ, 380, 140
- McGaugh et al. (2000) McGaugh, S. S., Schombert, J. M., Bothun, G. D., & de Blok, W. J. G. 2000, ApJL, 533, L99
- Merritt (1983) Merritt, D. 1983, ApJ, 264, 24
- Mieske et al. (2004) Mieske, S., Infante, L., Benitez, N., et al. 2004, AJ, 128, 1529
- Mieske et al. (2005) Mieske, S., Infante, L., Hilker, M., et al. 2005, A&A, 430, L25
- Mihos (2004) Mihos, J. C. 2004, in Clusters of Galaxies: Probes of Cosmological Structure and Galaxy Evolution, 278
- Moore et al. (1999) Moore, B., Ghigna, S., Governato, F., et al. 1999, ApJL, 524, L19
- Moore et al. (1996) Moore, B., Katz, N., Lake, G., Dressler, A., & Oemler, A. 1996, Nature, 379, 613
- Navarro et al. (1997) Navarro, J. F., Frenk, C. S., & White, S. D. M. 1997, ApJ, 490, 493
- Oemler et al. (1997) Oemler, A. J., Dressler, A., & Butcher, H. R. 1997, ApJ, 474, 561
- Oke et al. (1995) Oke, J. B., Cohen, J. G., Carr, M., et al. 1995, PASP, 107, 375
- Osterbrock (1989) Osterbrock, D. E. 1989, Astrophysics of gaseous nebulae and active galactic nuclei (Research supported by the University of California, John Simon Guggenheim Memorial Foundation, University of Minnesota, et al. Mill Valley, CA, University Science Books, 1989, 422 p.)
- Ota & Mitsuda (2004) Ota, N. & Mitsuda, K. 2004, A&A, 428, 757
- Owen et al. (2006) Owen, F. N., Keel, W. C., Wang, Q. D., Ledlow, M. J., & Morrison, G. E. 2006, AJ, 131, 1974
- Papovich et al. (2004) Papovich, C., Dole, H., Egami, E., et al. 2004, ApJS, 154, 70
- Pei (1992) Pei, Y. C. 1992, ApJ, 395, 130
- Phillipps et al. (2001) Phillipps, S., Drinkwater, M. J., Gregg, M. D., & Jones, J. B. 2001, ApJ, 560, 201
- Poggianti & Barbaro (1997) Poggianti, B. M. & Barbaro, G. 1997, A&A, 325, 1025
- Poggianti et al. (2004) Poggianti, B. M., Bridges, T. J., Komiyama, Y., et al. 2004, ApJ, 601, 197
- Pracy et al. (2005) Pracy, M. B., Couch, W. J., Blake, C., et al. 2005, MNRAS, 359, 1421
- Richard et al. (2006) Richard, J., Pelló, R., Schaerer, D., Le Borgne, J.-F., & Kneib, J.-P. 2006, A&A, 456, 861
- Rieke et al. (2004) Rieke, G. H., Young, E. T., Engelbracht, C. W., et al. 2004, ApJS, 154, 25
- Sandage et al. (1985) Sandage, A., Binggeli, B., & Tammann, G. A. 1985, AJ, 90, 1759
- Schlegel et al. (1998) Schlegel, D. J., Finkbeiner, D. P., & Davis, M. 1998, ApJ, 500, 525
- Scodeggio et al. (2005) Scodeggio, M., Franzetti, P., Garilli, B., et al. 2005, PASP, 117, 1284
- Shi et al. (2005) Shi, Y., Rieke, G., Hines, D., et al. 2005, AAS, 207, 140.11
- Shioya et al. (2002) Shioya, Y., Bekki, K., Couch, W. J., & De Propris, R. 2002, ApJ, 565, 223
- Smith et al. (2005) Smith, G. P., Kneib, J.-P., Smail, I., et al. 2005, MNRAS, 359, 417
- Spitzer (1978) Spitzer, L. 1978, Physical processes in the interstellar medium (New York Wiley-Interscience, 1978. 333 p.)
- Stetson (1987) Stetson, P. B. 1987, PASP, 99, 191
- Sulentic et al. (2001) Sulentic, J. W., Rosado, M., Dultzin-Hacyan, D., et al. 2001, AJ, 122, 2993
- Taylor & Babul (2001) Taylor, J. E. & Babul, A. 2001, ApJ, 559, 716
- Treu et al. (2003) Treu, T., Ellis, R. S., Kneib, J.-P., et al. 2003, ApJ, 591, 53
- Valluri (1993) Valluri, M. 1993, ApJ, 408, 57
- van Zee et al. (1998) van Zee, L., Salzer, J. J., Haynes, M. P., O’Donoghue, A. A., & Balonek, T. J. 1998, AJ, 116, 2805
- Vollmer (2003) Vollmer, B. 2003, A&A, 398, 525
- Vollmer et al. (2004) Vollmer, B., Balkowski, C., Cayatte, V., van Driel, W., & Huchtmeier, W. 2004, A&A, 419, 35
- Vollmer et al. (2001) Vollmer, B., Cayatte, V., Balkowski, C., & Duschl, W. J. 2001, ApJ, 561, 708
- Weidner et al. (2004) Weidner, C., Kroupa, P., & Larsen, S. S. 2004, MNRAS, 350, 1503
- Whitmore et al. (1993) Whitmore, B. C., Gilmore, D. M., & Jones, C. 1993, ApJ, 407, 489
- Wilson et al. (1997) Wilson, G., Smail, I., Ellis, R. S., & Couch, W. J. 1997, MNRAS, 284, 915
- Yoshida et al. (2004) Yoshida, M., Ohyama, Y., Iye, M., et al. 2004, AJ, 127, 90
- Zaritsky et al. (1994) Zaritsky, D., Kennicutt, R. C., & Huchra, J. P. 1994, ApJ, 420, 87
| A1689 | A2667 | ||
|---|---|---|---|
| (J.2000) | 13:11:24.86 | (J.2000) | 23:51:44.03 |
| (J.2000) | -01:20:39.9 | (J.2000 | -26:03:59.6 |
| 0.1870 | 0.2265 | ||
| (mag) | -19.09 | (mag) | -21.54 |
| (mag) | -19.95 | (mag) | -22.20 |
| (mag) | -20.49 | (mag) | -22.87 |
| (mag) | -21.82 | (mag) | -24.47 |
| (mJy) | 0.026 | (mJy) | 0.41 |
| (mJy) | 0.019 | (mJy) | 0.43 |
| (mJy) | 0.005 | (mJy) | 0.29 |
| (mJy) | 0.008 | (mJy) | 1.81 |
| (mJy) | 0.03 | (mJy) | 4.20 |
| (mJy) | 0.90 | (mJy) | 1.40 |
| (F850LP) ( kpc) | 3.1 | (F814W) ( kpc) | 5.5 |
| (F850LP) (mag ) | 20.07 | (F814W) (mag ) | 19.99 |
| (F850LP) | 3.13 | (F814W) | 3.02 |
| Cluster | 1730 | 1000 | |||||
|---|---|---|---|---|---|---|---|
| D | D | ||||||
| kpc | kpc | Myr | kpc | kpc | Myr | ||
| A1689 | 280 | 35 | 20 | 450 | 60 | 60 | |
| A2667 | 390 | 90 | 54 | 610 | 140 | 150 | |