Photometric Decomposition of Barred Galaxies
Abstract
We present a non-parametric method for decomposition of the light of disk galaxies into disk, bulge and bar components. We have developed and tested the method on a sample of 68 disk galaxies for which we have acquired I-band photometry. The separation of disk and bar light relies on the single assumption that the bar is a straight feature with a different ellipticity and position angle from that of the projected disk. We here present the basic method, but recognise that it can be significantly refined. We identify bars in only 47% of the more nearly face-on galaxies in our sample. The fraction of light in the bar has a broad range from 1.3% to 40% of the total galaxy light. If low-luminosity galaxies have more dominant halos, and if halos contribute to bar stability, the luminosity functions of barred and unbarred galaxies should differ markedly; while our sample is small, we find only a slight difference of low significance.
1 Introduction
Hubble (1926) divided disk galaxies into barred and unbarred families, denoted SB and S respectively. A similar visual classification scheme was described by de Vaucouleurs (1959), who extended it to include an intermediate (SAB) family to allow for weak bars, although he noted that the distribution of bar strengths seemed to be continuous. Sandage & Tamman (1981) designate intermediate types S/SB. Subjective classifications into two or three bins might be a useful first step, but a more quantitative estimator of the prominence of the bar would clearly be superior.
Visual classification rests on the fact that the eye readily distinguishes at least three separate light components of a barred galaxy: the disk, bulge, and bar. Ideally, we would like a reliable procedure to separate the bar light from that of the disk and bulge in high-quality digital images of a large sample of galaxies. Such information would be useful to challenge models of the origin of bars in galaxies. More generally, the distributions of bar light fractions, shapes, and sizes in galaxies ought to be predicted by theories of galaxy formation and evolution.
We will assume that the separation of the light into disk, bar, and bulge components is well founded. One worries whether the separate components are dynamically distinct; e.g. it is far from clear that every star pursues an orbit that is always confined to the one component. Nevertheless, it seems reasonable to hope that the amount of light in all three components does not change by much on an orbital time scale and that evolution is slow.
We wish to measure a number of photometric properties of bars: the luminosity of the bar relative to that of the disk or of the entire galaxy, the length of the bar, the major axis light profile of the bar, the axis ratio or ellipticity of the bar, the shape of the bar, etc. Bars range from bright inner ovals (not very different from lenses) to skinny, more “boxy” features (Athanassoula et al. 1990), and from so-called “flat” bars, with a major-axis light profile that declines slowly, to “exponential” bars, that have a steeply declining light profile (Elmegreen & Elmegreen 1985). Such a multi-dimensional parameter space requires something more sophisticated than a single number to quantify the properties of a bar.
Many attempts to characterize bars in galaxies have been reported; early work was summarized by Sellwood & Wilkinson (1993). Abraham et al. (1999) fit ellipses to the image at many isophote levels, and evaluate from deprojection of the inner ellipses assuming the outer ellipses indicate the projection geometry of a round, flat disk. Buta & Block (2001) define bar strength from the gradients of the gravitational potential in the disk plane deduced from a photometric image, rectified to face-on, and assuming a fixed M/L ratio and disk thickness. Laurikainen, Salo & Rautianen (2002) show that correlates well with the maximum ellipticity of the bar. Jogee et al. (2004) and Marinova & Jogee (2006) also base their method on multiple ellipse fits, but define a galaxy to be barred from a combination of the ellipse parameters. Laurikainen, Salo & Buta (2005) quantify the non-axisymmetric light by Fourier decomposition. Radically different approaches were adopted by Seigar & James (1998), who quantified the bar flux after subtraction of an axisymmetric disk, and by Prieto et al. (2001), Peng et al. (2002), and de Souza, Gadotti & dos Anjos (2004) who fit assumed parametric forms for the disk, bulge and bar to the photometric image.
Abraham & Merrifield (2000) compare their bar-strength parameter with optical classifications of the Frei et al. (1996) sample of bright galaxies, finding some relation only when it is combined with a second parameter characterizing the concentration of the total light. Buta et al. (2005) estimate for the Eskridge et al. (2000) sample of galaxies and find a fairly smooth distribution of values, suggesting a continuum of bar strengths from zero to a maximum. Marinova & Jogee (2006) reanalyse the same sample by their method, finding instead a preponderance of strong, i.e. quite elliptical, bars.
Most of these studies aim for a single estimator, such as bar strength, and do not attempt to characterize the full multi-dimensional zoo of bars. In addition, many methods suffer from a number of intrinsic weaknesses.
First, all require an estimate of the inclination and position angle of the projected disk; estimating projection geometry from the outer isophotes, assuming a flat, circular disk, can be complicated by the presence of non-axisymmetric features, such as the bar itself as well as spiral arms, oval distortions or warps in the outer disk. Recognizing where such features might be important and adjusting estimates appropriately requires practice and good judgement, processes that are intrinsically difficult to automate.
Second, since the ellipticity at intermediate radii is affected by spiral arms and non-circular “rings”, as well as by bars, deciding the radius at which a bar ends and a different bisymmetric feature begins can be fraught with difficulty. Recent discussions of the appropriate way to estimate bar lengths have been given by Athanassoula & Misiriotis (2001), Aguerri et al. (2003), Erwin (2005), Gadotti & de Souza (2006), etc. Buta, Block & Knapen (2003) describe a Fourier method to separate the bar from the spiral before computing .
Third, the ellipticity in the inner disk is affected by the bulge, which is generally a weak contributor to the light by the end of the bar, but usually has the highest surface brightness in the center. Furthermore, the parameter requires that the bulge be subtracted from the disk and bar before deprojection and then added back (Laurikainen et al. 2004).
Here we propose a new method to decompose the light of a galaxy in a high-quality image. Our method offers a more automated, and possibly superior, approach to all three of the above difficulties, and yields estimates of the bar light fraction, luminosity profile and ellipticity. We present a preliminary description here, but recognize that there is substantial scope for improvement. For example, we assume an elliptical light distribution for the bar, which is generally a poor fit; however, our method could be extended to include more general shapes.
Our technique is a generalization of the disk-bulge decomposition method described by Barnes & Sellwood (2003, hereafter Paper I). We assume that the disk is thin, flat, and round; the bar is also thin and flat, and is concentric with the disk. We base our decomposition of the bar and disk upon the assumption that the bar is straight and, in general, has a different position angle and ellipticity from that of the projected disk. We make no assumptions about the light profiles either of the disk or of the bar. Following Palunas & Williams (2001), Barnes & Sellwood also used a non-parametric form for the bulge; here we adopt instead a more conventional Sérsic bulge model (Sérsic 1968), but a parametric bulge model is not a required feature of our three-component decompositions.
We reduce the subjectivity of defining the projection geometry by fitting the entire light distribution at once. Since a single elliptical isophote can be affected by local non-axisymmetric features, most workers generally look for a radial range over which the ellipticity and position angle do not vary much. By requiring a single ellipticity for the entire disk we evaluate a weighted average automatically. The average ellipticity and position angle in a disk-bulge decomposition can be thrown off by prominent non-axisymmetric features. Barnes & Sellwood attempted to estimate the systematic uncertainties caused by such features, by determining the spread in the fitted projection angles after the image is rectified and reprojected about other major axes. By fitting the most prominent non-axisymmetric feature, the bar, we significantly reduce this potential systematic error. The influence of bright spiral arms remains, but they should have a lesser effect both because they are generally less strong than bars and because they, by their nature, do not have a fixed position angle.
We avoid judging where the bar turns to a spiral and/or ring simply by fitting a straight feature of arbitrary light profile; the bar intensity profile should simply drop to the noise in the outer disk. Generally we find that the fit assigns some light to the bar beyond the end of the bar, as judged by eye, which is probably due in part at least to other non-axisymmetric features in the disk that are not completely orthogonal to the bar direction. As will be described below, we cut off the bar light profile at some distance from the center to prevent it from rising again where it crosses an outer spiral arm, for example.
Finally, by fitting a separate bulge component, we are able to follow the disk and bar light profiles in towards the center, where they are required to have the same ellipticity and position angle as at larger radii.
The data we use here were acquired specifically for this study. Our objective was to obtain high-quality images of a manageable, but representative, sample of galaxies selected without regard to morphological appearance. We have used this sample to develop our technique and present the statistics of disk, bulge, and bar light fractions. We hope that the method can be refined and at least partly automated in order to be able to analyse the light of much larger galaxy samples, e.g. SDSS (York et al. 2000), the Millennium Galaxy survey (Liske et al. 2006), etc.
2 Data
2.1 Sample
We have selected a magnitude-limited sample of galaxies with known redshifts in as unbiased a manner as possible. The redshift is important only to determine whether the properties of the fitted bar vary with absolute magnitude. Our starting point was the Southern Sky Redshift Survey (da Costa et al. 1998), which gives redshifts of a complete sample of galaxies selected from the Hubble Space Telescope Guide Star Catalog (Lasker et al. 1990) to a magnitude limit of . Da Costa et al. estimate the uncertainty in the quoted magnitudes, which were determined automatically from scans of sky survey plates, to be about 0.31 magnitudes.
We targeted a complete sub-sample of 129 objects from the SSRS in the declination range and right ascension hr. There were no large clusters of galaxies among the targets, but several small groups were apparent.
2.2 Observations
The galaxies were observed on the nights of April 6–10, 2000 using the CTIO 0.9 m telescope and the Tek2K#3 CCD. The CCD was operated unbinned, providing an image scale of /pixel. Quad readout mode was used, with an approximate gain of 3 electron/ADU and read noise of 5 electrons per readout pixel. The standard CTIO B, V and I filters were used. Observing conditions were photometric throughout the first three nights, while the later part of the fourth night and the entire fifth night were plagued by varying amounts of cloud. Seeing conditions were variable throughout the run, with image FWHM varying from to , with typical. Standard stars from the fields of Landolt (1992) were observed on the first four nights. Twilight sky flats were taken on the first, third, and fourth nights, and bias frames were taken at the beginning of each night.
The observing scheme was designed to provide a deep, high-quality I band image to be used to model the galaxy’s light distribution. We also acquired less-deep images in the B and V bands in order to measure the colors of the modeled components. For each galaxy we took two B exposures, two V exposures, and three I exposures; the telescope was jogged slightly between exposures to minimize the effects of CCD artifacts. Exposure times for each image were 110 seconds in B, 75 seconds in V, and 240 seconds in I; on the last night the exposure times were doubled.
We had time to observe 95 of the identified list of 129 target galaxies. The selection of galaxies to observe was based purely on their position, without reference to any intrinsic property. Most of the 34 omitted galaxies were in the more southerly half of the declination range.
2.3 Reductions
The images were overscan and bias subtracted, trimmed, and flattened with the twilight sky flats in the usual way, using IRAF.111IRAF is distributed by the National Optical Astronomy Observatories, which are operated by the Association of Universities for Research in Astronomy, Inc., under a cooperative agreement with the National Science foundation. We determined the centroids of stars in the images which we used to align multiple exposures; integer pixel translations were adequate, since the pixel scale was small compared to the seeing. We combined the aligned images with cosmic ray rejection. We estimated the sky brightness in the vicinity of each galaxy using the biweight (Beers et al. 1990) and subtracted it from the images. We also examined each image and masked out foreground stars and any remaining artifacts.
We measured the brightnesses of standard stars in a fixed digital aperture of diameter 2.5 times the worst seeing FWHM, and subtracted the local sky from a surrounding annulus. We did not attempt to measure the atmospheric extinction, but used the standard CTIO extinction coefficients from Stone & Baldwin (1983). We determined the photometric zeropoints for the first three nights of the run, with an internal precision of 4 to 5%.
3 Modeling
We attempt to divide the light of each galaxy into distinct components: a disk, a bar and a bulge. Our technique is an extension of that used for fitting a 2-D photometric image with a non-parametric disk and bulge model, which is described in the appendix of Paper I. While Peng et al. (2002) and de Souza et al. (2004) also fit 2-D images, they assume the light can be decomposed into a number of components of fixed parametric form. Kent & Glaudell (1989) attempted a non-parametric fit to the light distribution of NGC 936, but modeled the bar along its major axis only.
Here we make the usual assumption that the disk is thin, flat, and intrinsically round; the fitted ellipticity and position angle of the disk defines the projection geometry, therefore. The bulge is assumed to be spheroidal with its symmetry plane coincident with that of the disk, and we also require the disk, bulge and bar to be concentric. As in Paper I, we depart from convention by allowing the radial profile of the disk light to be non-parametric, but here parameterize the bulge as a spheroidal Sérsic model.
The new aspect of this work is that we allow for the possibility of a bar component in the disk, which we define to be an additional feature in the 2-D light distribution that is bi-symmetric with no spirality. Thus the disk and bar components are each constrained to have fixed ellipticity and position angle at all radii, but the light profiles of each have arbitrary tabulated values. As will be clear from our fits, our assumption of an elliptical shape for the bar light is generally poor; a more boxy shape would be more appropriate. Since we suspect that a more sophisticated characterization of the bar light (e.g. Athanassoula et al. 1990) would not have a strong effect on our conclusions, we leave this refinement for future work.
3.1 Mathematical details
We minimize the reduced , which is defined in the usual way:
| (1) |
Here are the sky-subtracted intensities of the pixels used in the image, with their associated uncertainties . The photometric model is described by a tabulated set of intensities , which are interpolated to the pixel locations using the weights , and is the contribution of the model bulge to the intensity of the th pixel.
We first describe the simplest case in some detail, which is to fit only a thin, circular disk that is inclined to the line of sight. The model isophotes are ellipses with fixed ellipticity and position angle of the major axis , all centered on the photometric center . The intensity of the th elliptical isophote with semi-major axis is .
The major-axes of all the ellipses make an angle to the -axis of the image. We define elliptical coordinates to be the position relative to axes centered on , and rotated to be aligned with the current estimate of major-axis position angle. Thus a pixel center at has elliptical coordinates
The semi-major axis, , of the ellipse passing through this point is given by
Since we adopt linear interpolation between the tabulated isophote values (the data do not merit anything more sophisticated), the two non-zero weights are
where are the semi-major axes of the ellipses at which the model disk intensities are tabulated. The intensity at the central point is and the model intensity for any pixel outside the the last ellipse is computed by linear extrapolation from the outermost pair.
Our numerical task is to find the set of parameters that minimize . For a given set of the parameters , the values of that minimize can be obtained by solving the linear system
| (2) |
obtained by setting the derivative equal to zero. The search for the optimum choices for is by standard minimization; we adopt Powell’s method (e.g. Press et al. 1992).
It is easy to include a bulge light component. We adopt a parametric Sérsic bulge model
| (3) |
where is the Sérsic index, and is the intensity scale. The value of is set such that the effective radius, , contains half the light, and is defined by the implicit relation , with the function and the incomplete gamma functions having their usual definitions.
We allow the bulge to be spheroidal, with the disk plane being the plane of symmetry. The parameter adds a single extra row to the matrix solution, whereas the bulge apparent ellipticity, , Sérsic index, , and effective radius, , add three non-linear parameters to the fit. We do not place bounds on these parameters, but sometimes find increases without bound at every iteration, while becomes very small. We found this behavior to be an excellent indicator of a bulgeless galaxy.
Finally, we model the bar as an elliptical light distribution, with ellipticity and projected position angle that can differ from those of the disk. Much of the foregoing can be applied with ease; we add an additional set of intensities to describe the bar, and all we need do is to extend the summation such that and . We have used the same set of semi-major axes of the bar ellipses as for the disk, but our method could allow the disk and bar ellipses to be spaced differently.
The values are not guaranteed to be positive, and we regard significantly negative values as unacceptable, on the grounds that they would distort the relative light fractions in the different components. When the best fit model includes any significantly negative values, we reset those values to zero and re-fit. It is sometimes necessary to do this several times to ensure that the fitted model has no negative intensity values. (It is possible to enforce in each evaluation of , but this results in discontinuities in the surface as ellipses are added and removed, which confuse the minimizing algorithm.)
3.2 Procedure
We selected a elliptical region of the image to be used in the fit. We first estimated the size and ellipticity of the galaxy by eye and then increased the semi-major axis by 30% and the axis ratio by 10% to ensure that all pixels containing significant galaxy light were included. We masked out pixels containing light from foreground stars and other galaxies in order to eliminate them from the fit.
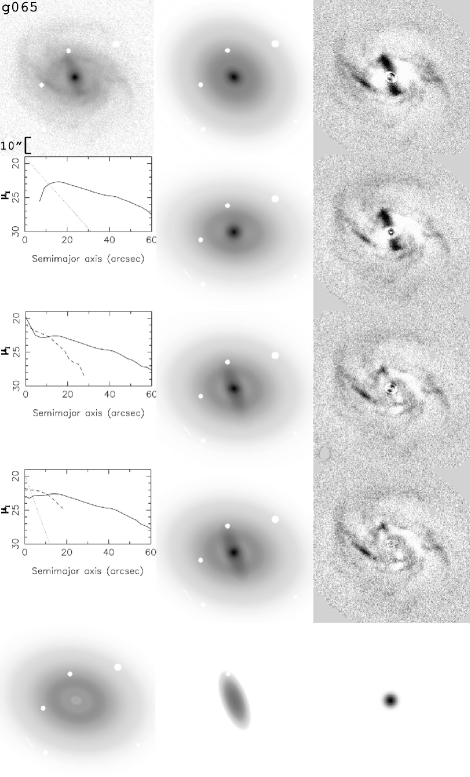
We begin by fitting a disk only, and determine the four non-linear parameters , & . Having found the best-fit center, we generally hold it fixed in all subsequent fits with additional components. Allowing the center to float in subsequent fits slows the fitting procedure by adding two extra parameters, but does not lead to a significantly improved . We then fit a bar and disk model, and a disk and bulge model, and finally a three-component model with a disk, bar and bulge.
These steps are illustrated in Figure 1 for a sample case of the strongly barred galaxy g065 (PGC 035480). This Figure shows the fitted models, light profiles and residual maps from each converged fit with the different set of components, together with the separate components of our final fit.
The elliptical ring-like features in the centers of the residual maps (Fig. 1, right hand column) for the two fits without a bulge component are artifacts of our linear interpolation scheme. Linear interpolation between our somewhat coarsely spaced ellipses does not allow the model to follow the steep bulge light profile all that well. However, this failing is of no consequence, since the steep light component in every galaxy is fitted by a Sérsic bulge, leaving a shallower light profile to be fitted by the disk and bar, for which our interpolation scheme is entirely adequate.
Ideally, we would like an objective test to determine whether the extra parameters of the additional components cause a significant reduction in the value of , but we have not found anything satisfactory. We tried using the standard F-test, and also the Bayesian information criterion (Schwarz 1978; Mukherjee et al. 1998), but neither proved useful. The number of independent pixels in our images, after allowing for seeing, is perhaps one tenth of the actual number, ), yet is still large compared with the number of parameters, ), with the result that these formal tests nearly always indicate that the extra parameters are needed, even for a very small improvement to , such as might result from fitting part of a spiral pattern with the bar model. A further problem is that we do not attempt to model spiral arms, dust lanes, lop-sidedness, etc., and therefore we find typically , implying that all models are formally rejected with a high degree of significance, which undermines the rationale of these formal tests. We therefore rely on visual inspection of the residuals, after subtraction of the various models from the data, to determine the number of separate components in the galaxy.
We have always employed equal spacing for the major axes at which the model intensities are tabulated, even though it is not a restriction of the procedure. Experience revealed that thirty ellipses to represent the disk was adequate; adding more did not reduce significantly for test galaxies, but was significantly worse when many fewer were employed. We used the same semi-major axes for the bar, making a maximum of sixty ellipses when both components are fitted. The intensity profiles along a short bar are not determined very well by only a few ellipses, and with hindsight we might have spaced the bar ellipses more closely. However, the principal conclusions of this study are not affected by our undersampling of the bar light profile.
3.3 Discussion
While the objective in our three component fits is to separate the disk from the bulge and bar, this did not always happen. In particular, the “bar” light fraction sometimes turned out to be an elliptical, presumably tri-axial, bulge misaligned with the disk major axis. In other cases with strong spiral arms and a weak or small bar, the fitting software sometimes identified these outer non-bar features as the principal non-axisymmetric component. These latter rare cases can be recognized by visual inspection of the model, and a new fit undertaken with fewer bar ellipses covering the inner disk only.
The light profile of a “bar” that extends to the edge of the galaxy may not decline monotonically, but rise again well outside the visual bar where its major-axis crosses a spiral arm, for example. In order to find a more realistic bar, we repeat the fit with a smaller number of bar ellipses restricted to the inner region; we retain only those inside the first ellipse to fall below of the noise in the first fit. The fits that result from this procedure seem reasonable in most cases, although the bar may be slightly larger than would have been estimated by eye. An alternative strategy would be to add a penalty to the function when the bar profile does not decrease monotically; we did not employ this strategy, however, since it would preclude the solution for the by linear algebra.
As our method relies on the shapes to separate the different components, there can be significant degeneracy between them if the shapes do not differ by much. For example, it becomes more difficult to separate bulge light from disk light when the galaxy is nearly face-on as both components are then assumed to have almost circular isophotes. In this circumstance, our method subtracts the best-fit Sérsic bulge and assigns any remaining axisymmetric light to the disk. Such degeneracies become less problematic for more inclined disks.
Here, we present our findings using the algorithm described above. We recognize that the light fractions in each component, and other parameters, may be systematically biased by our procedures. However, it is likely that every method to quantify bars suffers from its own idiosyncratic biases, and a method with a different set of biases is therefore useful. We are applying our technique to the OSUBSGS sample (Eskridge et al. 2002) that has been analysed by other methods, and will present comparisons elsewhere.
4 Results
4.1 Magnitudes
The apparent magnitudes of the galaxies observed during the first three photometric nights are listed in Table 1. The quoted values are isophotal magnitudes to the surface brightness I=24 mag arcsec-2. Comparison with existing measurements in the literature is possible in a few cases. Only two galaxies in our sample (g019 & g059) have isophotal I-band magnitudes given in the literature, and both agree with ours to within 0.05 mag. Since our B- & V-band exposures were deliberately rather short, our colors are not very precise. We found photographic magnitudes in the literature for 7 galaxies in the V-band and 9 galaxies in the B-band; our estimates agree with these published values to within their, rather large, errors.
4.2 Decompositions
Of the 95 galaxies observed, we exclude six spiral galaxies (22, 28, 29, 57, 61 & 81) that had excessive light contamination from foreground stars, 2 galaxies with images that overlap another galaxy (64 & 67), and two galaxies with long tails indicating mergers or merger remnants (6 & 62). Throwing out these 10 cases reduces our sample to 85 galaxies.
Our sample naturally contained elliptical galaxies. We identified and set aside the following 17 galaxies as ellipticals: g001, g010, g023, g027, g031, g038, g039, g044, g045, g060, g066, g069, g078, g089, g092, g093 & g095.
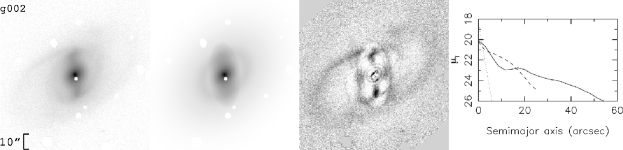
The results of the fitting procedure are shown in Figure 2. From left to right, the I-band image, the best fitted model, residual map and light profiles of the fitted components are shown for all 68 disk galaxies. We give the fraction of total light in each component for the fit with the most components judged necessary to fit the image in Table 2. These light fractions report the total fluxes assigned to each component in our decompositions ignoring any flux in the masked pixels. Including masked pixels or extrapolating the bulge light to infinity would have hardly any effect on the light fractions.
Uncertainties in the fluxes of the separate components were calculated by the Metropolis-Hastings algorithm (Monte Carlo Markov chain). We stopped the Metropolis evaluations once the changes in the error bars dropped below 0.03% for an additional 20,000 accepted points. We found that our parameters generally have small statistical uncertainties because of the large number of pixels.
The first disk galaxy in our sample, g002 (NGC 3469), is a good example of a three-component model; the fitted disk, bulge (6.6%) and bar (28%), illustrated in the center panel, match the original image well. The residuals are dominated by the prominent spiral arms in the outer parts, but the regular pattern of residuals in the bar region indicates that the real bar is boxier than our fitted elliptical model.
We note galaxy g043 (NGC 3479) has a smaller bar light fraction (6%) and is again fitted well, with the exception of the spirals. Galaxy g026 (NGC 4094) has the smallest identifiable bar light fraction (1.3%) of any in our sample, yet the bar is clearly present. A fit without it has a much higher and the bar stands out in the residuals. Galaxy g052 (NGC 4924) is a good example of an unbarred galaxy that is fitted well by a disk and bulge only.

4.2.1 Bulges
Figure 3 shows the distributions of bulge light fractions in the barred and unbarred disks. Of the 68 disk systems, 12 have no bulge. The fraction of light in the bulge is generally moderate, and is greater than 20% in only 7 of the 68 cases, with the largest being 31.5%. Apart from a slightly larger fraction of bulgeless disks in the unbarred sample, there does not appear to be a significant difference between the bulge light fractions in barred and unbarred galaxies in our sample.
We find only a loose correlation, in the expected sense (e.g. Simien & de Vaucouleurs 1986), between our estimated bulge light fractions and the Hubble T parameter.
4.2.2 Bar Fraction
As is well known, identification of bars in disks becomes more difficult in more highly inclined galaxies. Among the 51 galaxies with apparent axis ratio , we identify bars in 24, i.e. almost half the cases. Although we have successfully fitted bars in a few more inclined disks, we do not find as large a bar fraction (4/17) in these cases – almost certainly due to this bias. Our 47% bar fraction in the less inclined galaxies is on the low side of recent estimates; the visual classification of the OSUBSGS sample by Eskridge et al. (2000) finds the bar fraction to be 70%, whereas the more quantitative criteria employed by Laurikainen, Salo & Buta (2004) and Marinova & Jogee (2006) yield bar fractions of 60% and 62% respectively in the same images.
Our low bar fraction is all the more surprising since several of our barred galaxies have of the light in the bar; visual classifications may easily miss such small features. Furthermore, the bars in two other cases seem to be more triaxial bulges and may therefore have been classified visually as unbarred. Visual inspection of the images lacking bars by our criteria turned up just two possible cases that might have been visually classified as barred; in both cases, the possible bar is aligned with the inner end of a prominent spiral pattern in nearly face-on systems. However, it is quite out of the question that we could have missed as many as the 11 bars that would be required to bring our bar fraction up to 70% of the less inclined subsample of 51.
It is possible that our sample of galaxies just happens to be deficient in bars; the discrepancy from Eskridge et al. is just , for our . Apart from small numbers, the discrepancy in bar fractions could be due to two possible systematic differences. First, Eskridge et al. used H-band images where the identifiable fraction of bars is higher than in visual bands; it is possible, but unlikely, that our I-band images also suffer from a similar, but lesser, bias. Second, the OSUBSGS is biased to higher surface brightness, since their sample selection criteria were and . Perhaps bars are less common in systems of lower surface brightness.

4.2.3 Comparison with Visual Classifications
Figure 4 shows the Hubble classifications from the RC3 for 23 disk galaxies in our sample. We find six galaxies with SB classifications that have no bars, while we find bars with moderate light fractions for two galaxies that are classified SA. The original visual classifications were based on sky-survey images for the most part, which are of much lower quality than our data.

4.3 Bar properties
In all, 28 galaxies in our sample have an identifiable bar, for which the fit was significantly improved by adding the bar component. As shown in Figure 5, the fraction of bar light has a broad distribution from 1.3% to 40% of the total light, with no preferred value.
We estimate the bar length to be the semi-major axis at 10% of the maximum of the fitted bar intensity profile. Assuming the fitted disk is intrinsically round, we deproject the fitted bar length and ellipticity to find these quantities for a face-on disk.

The bar light fraction correlates strongly with deprojected bar length, expressed as a fraction of , as shown in Figure 6. Of the two points that lie below the trend, g013 has a high inclination for which the deprojected the bar length is uncertain and g025 the “bar” may be a triaxial bulge. The single outlier above the distribution, g040, has a long bar in low surface brightness disk. As this correlation implies a somewhat constant surface brightness contrast for the bar, one worries whether the absence of large, low luminosity bars is simply a selection effect. After re-examination of the images, we think it unlikely that low contrast bars could have been missed, since the bars in all the cases on the upper edge of the distribution in Fig. 6 are still high-contrast features.

Figure 7 shows the distribution of deprojected axis ratios, which has a broad range from (note that we plot ). Values of closer to unity are excluded because such round bars would simply seem to be part of the disk. However, the lower limit is interesting – no bars in our sample are skinnier than about 3:1. Marinova & Jogee (2006) find a similar range of ellipticities from their different approach. It should be noted that this bound may depend on our use of simple ellipses; it seems unlikely that the distribution of values shown in this Fig. would be affected much by use of a more general bar shape, but the lower bound on may be different.

Figure 8 shows the disk light profiles, with the bar and bulge subtracted, of all the barred galaxies in our sample. The galaxies are ordered from top to bottom by increasing bar light frations. The light profiles of many disks decrease toward the center, which is mostly due to bulge subtraction. However, it is interesting that the bar component in a number of cases produces an additional inflexion in the inner disk profile, suggesting that the stars that make up the bar were taken from the radial range of the bar, and are not an additional feature “on top” of the disk. This feature is generally more easily recognizable in cases with large bar-light fractions towards the bottom of the figure.


4.4 Colors
We can estimate color differences between components by comparing component magnitudes fitted to images taken in different filters. As our deeper I-band data is of higher quality, we adopt the best fit parameters for each component from the fit to the I-band image, which we then apply to the B and V images. We insist that the disk, bar and bulge have the same geometric parameters, and the same light profile in each of the different components. We therefore fit for the overall normalization of the light in each component in the B- and V-bands, using the projection parameters and light profile determined from the best fit to the I-band image.
As shown in Figure 9 (upper), we generally find bars are slightly redder than the disk of the same galaxy and the bulges are significantly redder still, as shown in the lower panel. The small color differences between the disk and bar may indicate slightly different stellar populations, or may simply be due to rather more dust in the bars. We have not corrected our plotted colors for internal extinction.
Three galaxies (g008, g042, and g058) apparently have extremely red bulges. All three have rather faint bulges with of the total I-band light. One (g008) is quite edge-on, and all three appear to have considerable internal extinction that presumably contributes to the red colors.
5 Noteworthy galaxies
Two galaxies (g018 & g021) have prominent bars in otherwise low surface brightness disks. The fitted bar in g018 is 34% of the total light, although we feel this could be an overestimate.
Our sample includes two apparently double barred galaxies: g019 (NGC 5878) and g070. The weaker bar feature in both cases, which is easily visible in the residual maps, appears close to perpendicular to the bright bar and seems to be of roughly equal length! The similar lengths of the bright and faint bars sets them aside from the “bars within bars” that are widely discussed (e.g. Erwin & Sparke 2002).
In addition to g026, noted above, g004 and g098 are galaxies with extremely small bars. Our fitting procedure could detect these very small bars that may easily be overlooked in visual classification schemes.
Four galaxies, g025, g030, g068 & g096, seem to have large intrinsic ellipticity differences between the inner and outer disks. No one deprojection would yield a disk with near-circular isophotes; in all four cases the inner HSB disk appears to have a separate ellipticity from that of the outer LSB disk. The HSB inner disk in these cases does not correspond to a classical lens, since is has spiral arms in all four cases that are strongest in g030. The existence of spirals might suggest that the inner feature is the more nearly circular, which would imply a highly elliptic outer disk, or one with a very different inclination.
Our algorithm selected a compromise ellipticity for the disk light of g025, which also has a small bar. Curiously, the position angle of the outer disk is within 20∘ of that of the bar.
g030 was the most difficult galaxy in our sample to fit. Not only did the almost round inner HSB disk have strong spirals, but the more elongated outer disk was somewhat lop-sided. The fitting algorithm favored including the HSB inner disk as part of the slightly elliptical “bulge” and a more elliptical disk. There is some evidence of a bar in the visual image, but we were unable to obtain a 3-component fit that captured this feature – other decompositions were preferred.
g074 and g094 are two moderately inclined disk galaxies () that both appear to have an excess of light on the major axis in two “blobs” symmetrically placed about the center. They do not appear as a classic bar, and may be a ring that is limb-brightened due to projection.
6 Discussion
We define disk size, , to be the semi-major axis of 25th magnitude isophote in the I-band. Our definition of the bar length, is the semi-major axis of the bar isophote at an intensity of 10% of its maximum. We find little correlation between and in our models. This disagress with Erwin’s (2005) finding that bar length scales with disk size, perhaps because we can find much smaller bars that may have been overlooked in previous work.
We find no correlation with bar length and absolute magnitude, but find a good correlation with disk length and absolute magnitude as expected for systems of similar surface brightness.
Ostriker and Peebles (1973) argued that the existence of a bar in a galaxy is determined by the dynamical importance of the dark halo; i.e. barred galaxies are predicted to have less dark halo than have unbarred galaxies.222Athanassoula & Misiriotis (2002) reported an apparently contradictory result that bars can be excited by massive halos. However, such bars formed in their simulations have far too low a pattern speed to be consistent with bars in real galaxies (e.g. Aguerri et al. 2001). Since it is well-established that dark matter varies inversely with galaxy luminosity, the Ostriker-Peebles stabilization mechanism indirectly predicts a decreasing bar fraction towards lower galaxy luminosity. We adopt a distance to every galaxy based on the SSRS redshift, using a Hubble constant of .
Since our sample is too small to look for a detailed trend of bar fraction with luminosity, we simply ranked our sample of nearly face-on galaxies by absolute luminosity. (Eight of the 51 barred galaxies in our sample were observed under non-photometric conditions and therefore lack I magnitudes.) The bar fraction in the fainter half (8/21) is slightly lower than that in the brighter half (13/22). However, a Kolmogorov-Smirnov test confirms that the difference in the distributions of absolute magnitudes between the barred and unbarred samples is of very low signficance. If our galaxy sample is representative, it would take a ten times larger sample for the minor difference between the luminosity functions of barred and unbarred galaxies to become significant. It is already interesting that our result is of low significance, since if bar-formation is inhibited by massive dark halos and if halo mass fraction varies strongly with luminosity, the luminosity functions of barred and unbarred galaxies should differ decisively.
7 Conclusions
We have described a method for separating the light of a disk galaxy into up to three separate components: a bulge, a disk, and a bar. The method also yields the radial light profiles of the disk and bar, as well as the axis ratio and length of the bar. The criterion for separating bar light from disk light is that the two ellipitical light components have different ellipticities and position angles that are radially invariant. We have not found an objective test to determine the number of components required by the data.
We have applied this method to a sample of 68 spiral galaxies and shown that it works well in many cases, in that the separate components correspond to those that the eye identifies. In these cases, the light fractions and other properties of the separate components have moderate statistical uncertainties.
The method is not completely objective, since it frequently fits features in galaxies that are not at all those intended. A triaxial bulge can be fitted as the bar, as can bright outer spiral arms. Lop-sided or oval disks also generally cause problems. In most cases, the fit can be “nursed” to something close to the desired decomposition by restricting the radial range allowed for the bar fit, although in one case (g030) we were unable to obtain a satisfacory 3-component fit despite repeated attempts with this strategy.
Our procedure is still under development. One refinement that could be implemented quite readily is to allow for boxiness in the bar isophotes; the pattern of residuals after subtracting our model frequently indicates that a better fit would be obtainable by adding an extra bar shape parameter. Our method also has a tendency to taper the bar light out to larger radii than where the eye would judge the bar to end. It is fortunate that this weakness does not appear to compromise our estimates of bar length, since the low surface brightness of this excess bar light is below the 10% threshold that defines the bar light, but it may cause some overestimate of the bar light fraction.
Although our statistical uncertainties are small, it is very hard to say much in general about systematic errors. These depend largely on how well our model fits the image – the fitted model matches the data well in some cases, but the light fractions in others are quite uncertain because the light distribution is more complicated than our simple 3-component model. Spiral arms are common, and several galaxies appear not to have intrinsically round disks; such features can, and clearly do, affect our estimates of the light fractions in the different components, but in ways that are impossible to quantify.
This weakness aside, we find the fraction of barred galaxies in our sample is 47%, which is lower than other recent estimates. It is unlikely that visual classifications would overestimate the bar fraction, since our more objective scheme finds very small bars that could easily be overlooked by eye. Since galaxies were selected in an unbaised manner, its lower bar fraction could simply be due to our small sample size.
The fraction of the total light that is in a bar ranges up to some 40%, with no preferred value. We have identified very small bars in a number of galaxies: the bar light in six cases is of the total, with the smallest identified fraction being 1.3%. The bar light fraction correlates with the relative size of the bar, suggesting a somewhat constant intensity contrast.
The deprojected bar axis ratios range from . Intrinsically rounder bars would be hard to separate from the disk, but it is interesting that no bar was skinnier than 3:1.
We find some evidence that bars were formed from the disk, in that the more luminous bars weakly associated with disk light profiles that dip just interior to the bar end. We also find that bars appear to be redder than the host disk, but cannot say whether the color difference is intrinsic or is due to extra dust in the bar.
We find a slightly lower fraction of bars in the fainter half of our sample than in the brighter, but the difference of 5 cases out of 43 is barely significant. If disks are stabilized by halos, as originally proposed by Ostriker & Peebles (1973), then we should expect a lower bar fraction in low-L disks, which are known to be halo dominated. It is already interesting that the luminosity functions of barred and unbarred galaxies are so similar, but a larger sample of galaxies would provide a more decisive test of this hypothesis.
References
- (1)
- (2) Abraham, R. G. & Merrifield, M. R. 2000, AJ, 120, 2835
- (3)
- (4) Abraham, R. G., Merrifield, M. R., Ellis, R. S., Tanvir, N. R. & Brinchman, J. 1999, MNRAS, 308, 569
- (5)
- (6) Aguerri, J. A. L., Debattista, V. P. & Corsini, E. M. 2003, MNRAS, 338, 465
- (7)
- (8) Athanassoula, E. & Misiriotis, A. 2002, MNRAS, 330, 35
- (9)
- (10) Athanassoula, E., Morin, S., Wozniak, H., Puy, D., Pierce, M. J., Lombard, J. & Bosma, A. 1990, MNRAS, 245, 130
- (11)
- (12) Barnes E. & Sellwood J. A. 2003, AJ, 125, 1164
- (13)
- (14) Beers, T. C., Flynn, K. & Gebhardt, K. 1990, AJ, 100, 32
- (15)
- (16) Buta, R. & Block, D. L. 2001, ApJ, 550, 243
- (17)
- (18) Buta, R., Block, D. L. & Knapen, J. H. 2003, AJ, 126, 1148
- (19)
- (20) Buta, R., Laurikainen, E., Salo, H., Block, D. L. & Knapen, J. H. 2006, AJ, to appear (astro-ph/0609406)
- (21)
- (22) Buta, R., Vasylyev, S., Salo, H. & Laurikainen, E. 2005, AJ, 130, 506
- (23)
- (24) da Costa, L. N., et al. 1998, AJ, 116, 1
- (25)
- (26) de Souza, R. E., Gadotti, D. A. & dos Anjos, S. 2004, ApJS, 153, 411
- (27)
- (28) de Vaudouleurs, G. 1959, Handbuch der Physik, 53, 275
- (29)
- (30) Elmegreen, B. G. & Elmgreen, D. M. 1985, ApJ, 2̱88, 438
- (31)
- (32) Erwin, P. 2005, MNRAS, 364, 283
- (33)
- (34) Erwin, P. & Sparke, L. S. 2002, AJ, 124, 65
- (35)
- (36) Eskridge, P. B., et al. 2000, AJ, 119, 536
- (37)
- (38) Eskridge, P. B., et al. 2002, ApJS, 143, 73 (OSUBSGS)
- (39)
- (40) Frei, Z., Guhathakurta, P., Gunn, J. E. & Tyson, J. A. 1996, AJ, 111, 174
- (41)
- (42) Gadotti D. A. & de Souza R. E. 2006, ApJS, 163, 270
- (43)
- (44) Graham, A. W. 2001, AJ, 121, 820
- (45)
- (46) Hubble, E. 1926, ApJ, 64, 321
- (47)
- (48) Jogee, S., et al. 2004, ApJ, 615, L105
- (49)
- (50) Kent, S. M. & Glaudell, G. 1989, AJ, 98, 1588
- (51)
- (52) Marinova, I. & Jogee, S. 2006, preprint
- (53)
- (54) Landolt, A. U. 1992, AJ, 104, 372
- (55)
- (56) Lasker, B. M., Sturch, C. R., McLean, B. J., Russell, J. L., Jenkner, H. & Shara, M. M. 1990, AJ, 99, 2019
- (57)
- (58) Laurikainen, E., Salo, H., Buta, R. & Vasylyev, S. 2004, MNRAS, 355, 1251
- (59)
- (60) Laurikainen, E., Salo, H. & Buta, R. 2004, ApJ, 607, 103
- (61)
- (62) Laurikainen, E., Salo, H. & Buta, R. 2005, MNRAS, 362, 1319
- (63)
- (64) Laurikainen, E., Salo, H., & Rautiainen, P. 2002, MNRAS, 331, 880
- (65)
- (66) Liske, J., Driver, S. P., Allen, P. D., Cross, N. J. G. & De Propris, R. 2006, MNRAS, to appear (astro-ph/0604211)
- (67)
- (68) Mukherjee, S., Feigelson, E. D., Jogesh Babu, G., Murtagh, F., Fraley, C. & Raftery, A. 1998, ApJ, 508, 314
- (69)
- (70) Ostriker, J. P. & Peebles, P. J. E. 1973, ApJ, 186, 467
- (71)
- (72) Palunas, P. & Williams, T. B. 2000, AJ, 120, 2884
- (73)
- (74) Peng, C. Y., Ho, L. C., Impey, C. D. & Rix, H.-W. 2002, AJ, 124, 266
- (75)
- (76) Press, W. H., Flannery, B. P., Teukolsky, S. A., Vetterling, T. A. 1992, Numerical Recipes (Cambridge: Cambridge Univ. Press)
- (77)
- (78) Prieto, M., Aguerri, J. A. L., Varela, A. M. & Muñoz-Tuñón, C. 2001, A&A, 367, 405
- (79)
- (80) Sandage, A. & Tamman, G. A. 1981, A Revised Shapley-Ames Catalog of Bright Galaxies (Carnegie Inst. of Washington)
- (81)
- (82) Schwarz, G. 1978, Annals of Statistics, 6, 461
- (83)
- (84) Seigar & James, 1998, MNRAS, 299, 672
- (85)
- (86) Sellwood, J. A. & Wilkinson, A. 1993, Rep. Prog. Phys., 56, 173
- (87)
- (88) Sérsic, J. L. 1968, Atlas do Galaxies Australes (Córdoba: Obs. Astron., Univ. Nac. Córdoba)
- (89)
- (90) Simien, F. & de Vaucouleurs, G. 1986, ApJ, 302, 564
- (91)
- (92) Stone, R. P. S. & Baldwin, J. A. 1983, MNRAS, 204, 347
- (93)
- (94) York, D. G., et al. 2000, AJ, 120, 1579
- (95)
| Gal | GSC | Other Name | B bbaffiliationmark: | V vvaffiliationmark: | I iiaffiliationmark: | B-I | V-I | RC3 type |
|---|---|---|---|---|---|---|---|---|
| g001 | 5505 00732 | PGC 032054 | 15.85 | 14.28 | 12.66 | 2.44 | 1.31 | |
| g002 | 5506 01648 | NGC 3469 | 14.62 | 13.29 | 11.76 | 2.26 | 1.26 | PSBR2 |
| g003 | 5514 00880 | 2MASX J11183223-1426139 | 15.62 | 14.72 | 13.47 | 1.96 | 1.14 | |
| g004 | 5514 00914 | 2MASX J11232225-1428148 | 15.67 | 14.48 | 13.22 | 2.17 | 1.16 | |
| g005 | 5515 00365 | PGC 035176 | 15.76 | 14.42 | 12.82 | 2.32 | 1.24 | |
| g006 | 5523 01245 | PGC 036744 | 16.07 | 15.34 | 14.21 | 1.42 | 0.86 | SBR6 |
| g008 | IC 3799 | 14.86 | 13.84 | 12.48 | 2.14 | 1.25 | S.7*/ | |
| g009 | 5541 00914 | IC 3822 | 15.66 | 14.59 | 13.14 | 2.28 | 1.33 | |
| g010 | 5541 00698 | IC 3824 | 15.66 | 14.12 | 12.50 | 2.63 | 1.38 | |
| g011 | 5541 00714 | IC 3838 | 14.69 | 14.08 | 12.90 | 1.48 | 0.95 | |
| g012 | 5541 00974 | NGC 4740 | 13.44 | 12.47 | 11.10 | 2.19 | 1.23 | |
| g013 | 5542 00471 | PGC 044854 | 15.22 | 14.02 | 12.70 | 2.26 | 1.22 | |
| g014 | 5550 00795 | 2MASX J13201390-1417445 | 15.43 | 14.49 | 13.21 | 2.02 | 1.17 | |
| g015 | 5550 01450 | PGC 046958 | 15.06 | 14.26 | 13.07 | 1.79 | 1.09 | |
| g016 | 5560 00839 | PGC 050211 | 15.25 | 14.05 | 12.59 | 2.42 | 1.35 | SBS3?/ |
| g017 | 5577 00923 | PGC 052853 | 14.93 | 13.88 | 12.60 | 1.60 | 0.98 | SBS6 |
| g018 | 5591 00907 | PGC 053654 | 15.83 | 14.57 | 12.40 | 2.25 | 1.28 | |
| g019 | 5593 00656 | NGC 5878 | 12.94 | 11.72 | 10.31 | 2.34 | 1.32 | SAS3 |
| g020 | 5593 00550 | PGC 054387 | 16.56 | 14.20 | 12.47 | 2.45 | 1.35 | |
| g021 | 5497 01342 | 2MASX J10255521-1443151 | 16.24 | 14.86 | 13.36 | 2.35 | 1.25 | |
| g022 | 5506 00659 | 2MASX J10552639-1432581 | 15.46 | 14.87 | 13.83 | 1.44 | 0.91 | |
| g023 | 5507 01145 | PGC 033775 | 15.44 | 14.06 | 12.61 | 2.34 | 1.23 | |
| g024 | 5514 01149 | PGC 034225 | 15.59 | 14.24 | 12.83 | 2.33 | 1.28 | L…P |
| g025 | 5514 00991 | PGC 034459 | 15.17 | 14.19 | 12.90 | 2.04 | 1.19 | |
| g026 | 5525 00637 | NGC 4094 | 13.08 | 12.33 | 10.94 | 1.69 | 1.05 | SXT6* |
| g027 | 5533 01001 | 2MASX J12295938-1437208 | 15.96 | 14.41 | 12.78 | 2.44 | 1.27 | |
| g028 **affiliationmark: | 5533 00831 | 15.66 | 14.59 | 13.22 | 2.44 | 1.37 | ||
| g029 **affiliationmark: | 5534 01280 | PGC 042495 | 15.55 | 15.07 | 13.91 | 1.64 | 1.16 | IB.9?/ |
| g030 | 5534 01374 | PGC 042590 | 16.19 | 15.15 | 13.93 | 1.64 | 0.99 | |
| g031 | 5541 00037 | PGC 043424 | 13.87 | 12.51 | 10.93 | 2.38 | 1.34 | RLAR+P? |
| g032 | 5541 00839 | IC 3831 | 14.20 | 12.90 | 11.44 | 2.30 | 1.26 | PLXS0? |
| g033 | 5542 00352 | NGC 4887 | 14.26 | 13.70 | 12.74 | 1.41 | 0.90 | LA.+P? |
| g034 | NGC 4902 | 12.25 | 11.32 | 10.10 | 1.91 | 1.13 | SBR3 | |
| g035 | 5550 01028 | IC 4221 | 14.00 | 13.27 | 12.14 | 1.62 | 1.00 | SAR5P? |
| g036 | 5560 00352 | NGC 5420 | 14.27 | 13.30 | 12.03 | 1.98 | 1.17 | S..3* |
| g037 | 5576 00288 | NGC 5664 | 14.66 | 13.73 | 12.41 | 2.06 | 1.22 | |
| g038 | 5593 00419 | NGC 5880 | 15.54 | 14.15 | 12.56 | 2.46 | 1.34 | |
| g039 | 5593 00376 | NGC 5883 | 14.64 | 13.24 | 11.65 | 2.51 | 1.36 | |
| g040 | 5593 00575 | 2MASX J15152969-1429317 | 15.39 | 14.41 | 13.01 | 2.04 | 1.21 | |
| g041 | 5505 01314 | 2MASX J10531764-1459549 | 16.42 | 15.41 | 14.19 | 2.07 | 1.14 | |
| g042 | 5506 01625 | 2MASX J10555210-1457435 | 15.46 | 14.50 | 13.46 | 1.89 | 1.14 | |
| g043 | 5506 01127 | NGC 3479 | 14.78 | 13.51 | 12.19 | 1.95 | 1.14 | SXR4 |
| g044 | 5507 00560 | 2MASX J11095185-1458201 | 15.84 | 14.66 | 13.28 | 2.08 | 1.14 | |
| g045 | 5507 00627 | 2MASX J11133590-1447377 | 15.75 | 14.37 | 12.87 | 2.46 | 1.30 | |
| g046 | 6093 00632 | 2MASX J11521816-1500408 | 15.64 | 14.72 | 13.43 | 2.07 | 1.20 | |
| g047 | 5525 00508 | PGC 038496 | 14.11 | 13.21 | 11.99 | 1.83 | 1.11 | PSBT3P* |
| g048 | 5541 00225 | PGC 044021 | 15.44 | 14.78 | 13.79 | 1.43 | 0.87 | |
| g049 | 6111 00332 | PGC 044267 | 15.17 | 13.88 | 12.46 | 2.09 | 1.14 | SBT4* |
| g050 | 5542 00818 | PGC 044645 | 15.42 | 14.39 | 13.04 | 1.95 | 1.18 | L..-*/ |
| g051 | 5542 00814 | PGC 044952 | 14.48 | 13.79 | 12.62 | 1.59 | 1.00 | |
| g052 | 5542 01198 | NGC 4924 | 14.10 | 13.20 | 11.85 | 1.88 | 1.13 | PSXS0P? |
| g053 | 5543 01211 | 2MASX J13153736-1452209 | 15.63 | 14.53 | 13.19 | 2.26 | 1.26 | |
| g054 | NGC 5073 | 13.59 | 12.64 | 11.27 | 2.16 | 1.31 | SBS5?/ | |
| g055 | 5550 01415 | PGC 046523 | 15.47 | 14.35 | 12.95 | 2.11 | 1.18 | |
| g056 | 5551 00322 | PGC 047994 | 14.82 | 13.91 | 12.34 | 1.78 | 1.05 | |
| g057 **affiliationmark: | PGC 050081 | 15.35 | 14.21 | 12.87 | 2.47 | 1.33 | ||
| g058 | 5560 00405 | PGC 050209 | 15.44 | 14.43 | 13.21 | 1.66 | 1.01 | |
| g059 | 5577 00786 | NGC 5756 | 13.47 | 12.56 | 11.19 | 2.01 | 1.21 | PSBS4P/ |
| g060 | 5592 01120 | PGC 053889 | 15.47 | 14.14 | 12.55 | 2.53 | 1.39 | |
| g061 | 6076 00771 | IRAS 10495-1504 | 15.48 | 14.86 | 13.68 | 1.57 | 0.99 | |
| g062 | 6077 01161 | PGC 033374 | ||||||
| g063 | 6077 01600 | 2MASX J11050927-1521039 | 15.93 | 15.25 | 14.16 | 1.52 | 0.92 | |
| g064 | 6077 00021 | PGC 034046 | 15.48 | 14.73 | 13.69 | 1.60 | 0.95 | |
| g065 | 6085 00590 | PGC 035480 | PSBR3 | |||||
| g066 | 6093 00259 | PGC 037281 | ||||||
| g067 **affiliationmark: | 6111 00448 | PGC 043547 | 15.68 | 14.15 | 12.40 | 2.47 | 1.36 | |
| g068 | 6111 00192 | PGC 043625 | 14.89 | 13.93 | 12.47 | 2.07 | 1.23 | |
| g069 | 6111 00630 | NGC 4756 | 13.85 | 12.49 | 11.04 | 2.35 | 1.29 | LXS0? |
| g070 | NGC 4856 | 11.90 | 10.78 | 9.42 | 2.34 | 1.31 | SBS0 | |
| g071 | 6112 00735 | PGC 044701 | 14.78 | 13.92 | 12.63 | 1.80 | 1.07 | IBS9?/ |
| g072 | 6112 01482 | NGC 4877 | 13.80 | 12.52 | 11.14 | 2.16 | 1.26 | SAS2* |
| g073 | 6113 00188 | PGC 045958 | SXS8 | |||||
| g074 | 6113 01709 | PGC 046436 | ||||||
| g075 | 6122 00596 | PGC 048102 | 15.10 | 14.58 | 12.42 | 2.25 | 1.84 | |
| g076 | 6122 00579 | PGC 048144 | 16.26 | 15.89 | 13.34 | 1.83 | 1.65 | |
| g077 | 6123 00184 | 2MASX J13445714-1515151 | ||||||
| g078 | 6153 00233 | PGC 052002 | ||||||
| g079 | 6154 00667 | PGC 052840 | ||||||
| g080 | 6168 01004 | PGC 053634 | SBS7 | |||||
| g081 | 6062 00839 | 2MASX J10380158-1531057 | ||||||
| g088 | 5525 00508 | PGC 038496 | 14.77 | 13.72 | 12.53 | 1.80 | 1.04 | PSBT3P* |
| g089 **affiliationmark: | PGC 043646 | 16.63 | 15.25 | 13.75 | 2.45 | 1.34 | ||
| g090 | 6111 01092 | PGC 043664 | 15.10 | 14.25 | 12.84 | 1.92 | 1.24 | |
| g091 | 6111 01258 | IC 0829 | 14.62 | 13.56 | 12.35 | 2.10 | 1.12 | |
| g092 | 6111 01164 | 2MASX J12523303-1531010 | 15.65 | 14.38 | 12.80 | 2.30 | 1.30 | |
| g093 | 6111 00632 | PGC 043777 | 15.88 | 14.20 | 12.83 | 2.31 | 1.09 | |
| g094 | PGC 044471 | 14.04 | 13.14 | 11.97 | 2.00 | 1.14 | ||
| g095 | 6112 00084 | 2MASX J13071600-1543396 | 15.80 | 15.10 | 12.84 | 2.40 | 1.83 | |
| g096 | NGC 4984 | 12.35 | 11.26 | 9.84 | 2.22 | 1.27 | RLXT+ | |
| g098 | 6113 00989 | PGC 046334 | ||||||
| g112 | 6095 00798 | PGC 038529 | 14.54 | 13.30 | 11.90 | 2.63 | 1.54 | SAS1? |
| g113 | 6104 01587 | 2MASX J12390630-1610472 | 15.38 | 14.37 | 13.09 | 1.99 | 1.13 | |
| g120 | 6113 01387 | PGC 046350 | ||||||
| g124 | 6121 00362 | 2MASX J13331239-1608216 | ||||||
| g125 | 6121 00343 | PGC 47717 | SXS2P* |
Note. — B,V,and I are R25 magnitudes. B-I and V-I are calculated at the I25 isophote.
| Name | disk % aaaffiliationmark: | bar % aaaffiliationmark: | bulge % aaaffiliationmark: | |||||||
|---|---|---|---|---|---|---|---|---|---|---|
| g002 | ||||||||||
| g003 | ||||||||||
| g004 | ||||||||||
| g005 | ||||||||||
| g008 | ||||||||||
| g009 | ||||||||||
| g011 | ||||||||||
| g012 | ||||||||||
| g013 | ||||||||||
| g014 | 100 | |||||||||
| g015 | ||||||||||
| g016 | ||||||||||
| g017 | 100 | |||||||||
| g018 | ||||||||||
| g019 | ||||||||||
| g020 | ||||||||||
| g021 | ||||||||||
| g024 | ||||||||||
| g025 | ||||||||||
| g026 | ||||||||||
| g030 | ||||||||||
| g032 | ||||||||||
| g033 | ||||||||||
| g034 | ||||||||||
| g035 | ||||||||||
| g036 | ||||||||||
| g037 | ||||||||||
| g040 | ||||||||||
| g041 | ||||||||||
| g042 | ||||||||||
| g043 | ||||||||||
| g046 | ||||||||||
| g047 | ||||||||||
| g048 | ||||||||||
| g049 | ||||||||||
| g050 | 100 | |||||||||
| g051 | 100 | |||||||||
| g052 | ||||||||||
| g053 | ||||||||||
| g054 | ||||||||||
| g055 | ||||||||||
| g056 | ||||||||||
| g058 | ||||||||||
| g059 | ||||||||||
| g063 | 100 | |||||||||
| g065 | ||||||||||
| g068 | ||||||||||
| g070 | ||||||||||
| g071 | 100 | |||||||||
| g072 | ||||||||||
| g073 | ||||||||||
| g074 | ||||||||||
| g075 | ||||||||||
| g076 | ||||||||||
| g077 | 100 | |||||||||
| g079 | ||||||||||
| g080 | 100 | |||||||||
| g088 | ||||||||||
| g090 | ||||||||||
| g091 | ||||||||||
| g094 | ||||||||||
| g096 | ||||||||||
| g098 | ||||||||||
| g112 | ||||||||||
| g113 | ||||||||||
| g120 | ||||||||||
| g124 | 100 | |||||||||
| g125 |