On the moat-penumbra relation
Abstract
Proper motions in a sunspot group with a -configuration and close to the solar disc center have been studied by employing local correlation tracking techniques. The analysis is based on more than one hour time series of G-band images. Radial outflows with a mean speed of km s-1 have been detected around the spots, the well-known sunspots moats. However, these outflows are not found in those umbral core sides without penumbra. Moreover, moat flows are only found in those sides of penumbrae located in the direction marked by the penumbral filaments. Penumbral sides perpendicular to them show no moat flow. These results strongly suggest a relation between the moat flow and the well-known, filament aligned, Evershed flow. The standard picture of a moat flow originated from a blocking of the upward propagation of heat is commented in some detail.
Subject headings:
Sun: sunspots – Sun: granulation – Sun: magnetic fields1. Introduction
Sunspots, as complex magnetic structures embedded in a convective plasma, show many active and changing features on multiple scales. Convective flows and large-scale plasma circulation plays an important role in the dynamics and evolution of solar active regions (see, e.g., Schrijver & Zwann, 2000) The granular convective pattern surrounding sunspots is perturbed by the presence of magnetic elements known as Moving Magnetic Features (MMFs), magnetic elements that move radially outwards through an annular cell called the ”moat” (Sheeley, 1972; Harvey & Harvey, 1973; Hagenaar & Shine, 2005, for a recent view) This moat flow also carries away granules as inferred using local correlation techniques (LCT, Bonet et al., 2005). It has been suggested that the moat could be a supergranule whose center is occupied by a sunspot with a typical cell-scale of up to km (Meyer et al., 1974). The sunspot would act as a blocking agent for the upward propagation of heat from below. The excess temperature and pressure generated in this way has been proposed as the origin of the moat flow (see also Nye et al., 1988). An interesting property of this supergranular cell is that, in deeper layers, it would have a component directed towards the spot that could help stabilizing the magnetic structure. While this viewpoint has been prevalent in sunspots physics, the real nature of the moat flow is not well understood. Already Vrabec (1974) pointed out that in an irregular sunspot, the moat was observed only in the sector with a well developed penumbra. The sunspot sector that had no penumbra, was an area where pores were being advected (inflowing) towards the main spot and, thus, displaying no moat-like flow.
 |
This old result already suggests a link between the presence of a penumbra and the moat flow, but no studies exist confirming such a relationship. It is interesting to point out that pores are not seen to be surrounded by a moat (whereas mature sunspots always are). Sobotka et al. (1999) studied (using LCT) six solar pores (including one with 6 arcsec diameter) and found the surrounding motions to be dominated by mesogranular flows, as found elsewhere in the photosphere. No trace of a moat flow was observed. It is clear that any possible heat blockage by the pores magnetic body was unable to generate a moat flow.
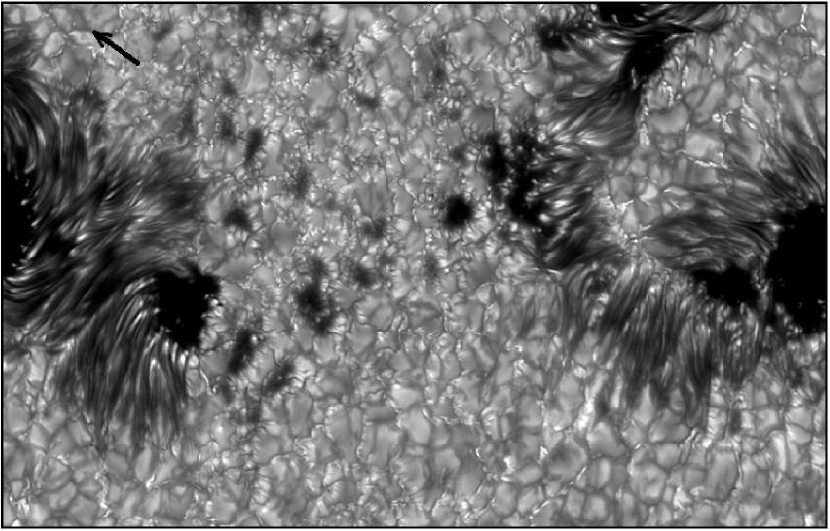
The present paper studies the relation between moat flows and the existence of penumbrae. It is based on an excellent 79 minutes time series of a sunspot group with -configuration. The configuration is ideal for this study because it displays complex umbral regions harboring fully developed penumbra on one side and none on the other. The long duration of these series, besides the high and stable quality throughout the entire period, substantially improved after image reconstruction (see Fig. 1), make of this material an excellent data set to study the morphology and dynamical behaviour of sunspots and their surroundings.
 |
2. Observations and data processing
The NOAA Active Region 10786 was observed on July 9, 2005 at the Swedish 1-meter Solar Telescope (SST, Scharmer et al., 2003a) equipped with Adaptive Optics (AO, Scharmer et al. 2003b), under collaboration in the International Time Program. This complex region, corresponding to a -configuration, was placed at heliocentric position . A dichroic beamsplitter separates setups in the red and the blue. In the blue beam, two simultaneous time sequences of high-resolution images were taken in wavelength bands at the G-band ( nm) and nearby continuum ( nm, G-cont). The sequences span for more than one hour, from 7:47 UT to 9:06 UT, following the evolution of the sunspots. The images were acquired using Kodak Megaplus 1.6 CCD cameras with a 10-bits dynamical range and 1536 1024 pixels. The pixel size was square. Real-time corrections with the AO and further post-processing techniques rendered up images near the diffraction limit. Standard procedures for flatfielding and dark-current subtraction were applied before restoration.
Post-processing for image restoration was performed by employing the Multi-Object Multi-Frame Blind Deconvolution (MOMFBD) method (Van Noort et al., 2005). The observational strategy to apply this technique consisted in taking G-band images and simultaneous G-cont phase diversity image-pairs (Gonsalves, 1982; Paxman et al., 1992; Löfdahl & Scharmer, 1994) by using an optical configuration with three channels. Sets of about 18 images per channel (i.e. 3 18 images) were combined to produce a pair of simultaneous G-band and G-cont restored images. Following this procedure, two time series of reconstructed images were produced. Figure 1 shows one of these images in the G-band.
The restored images were de-rotated to compensate the diurnal field rotation and rigidly aligned using cross-correlation. Additional image processing consisted of destretching and p-mode filtering (threshold phase velocity km s-1). The final product was two movies (G-band and G-cont) of 428 frames each, spanning over 71 min with a cadence of 10.0517 s, and covering a field-of-view (FOV) of (see movies at the web site: http://www.iac.es/galeria/svargas/movies.html).
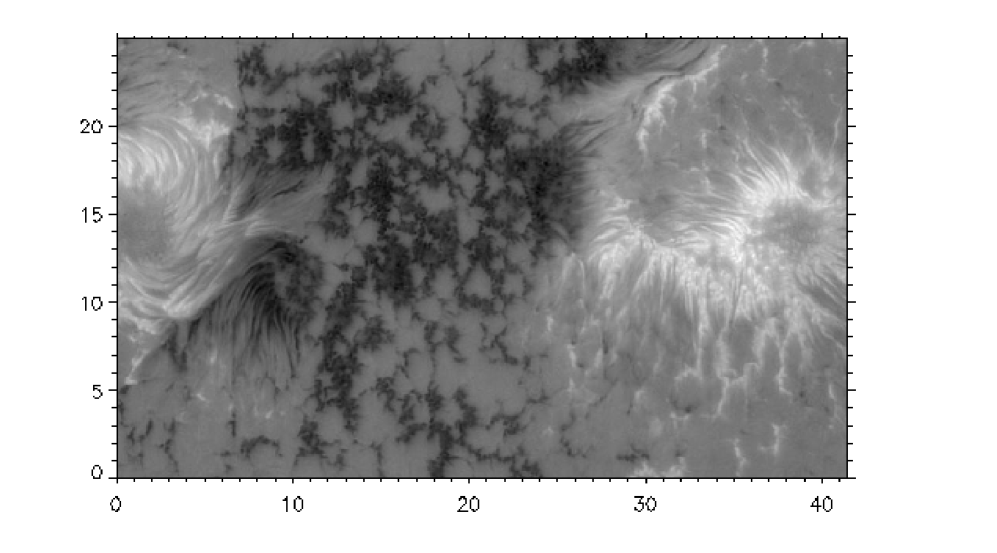
In the red beam a tunable birefringent filter (SOUP, Title et al, 1986) working at FeI 6302Å in combination with liquid crystal retarders produced longitudinal magnetograms. A beamsplitter in front of the SOUP filter splitted off 10% of the light to obtain phase diversity image-pairs that combined with the narrow-band images of the SOUP, allowed reconstructions MOMFBD to finally provide magnetograms with of resolution (see Fig. 4).
3. Data analysis and results
The G-band series has been used to study the proper motions of the structures in the FOV by the local correlation tracking algorithm of November & Simon (1988), as implemented by Molowny-Horas & Yi (1994). We have chosen a Gaussian tracking window of FWHM (half of the typical granular size) suitable for tracking mainly granules. With this procedure, we obtain maps of horizontal displacements or proper motions per time step (horizontal velocities), which we average in time. Averages of horizontal velocities have been performed over 5 min and 71 min intervals.
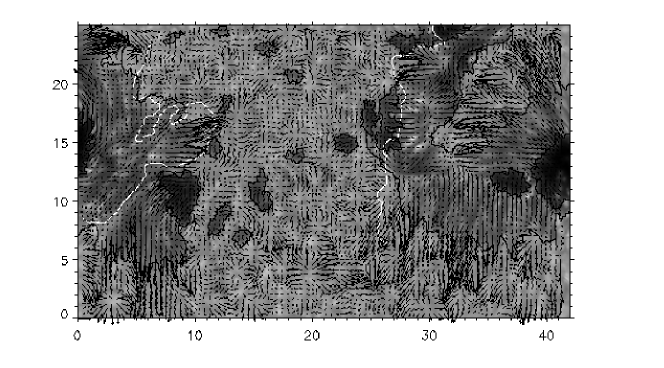
Figure 2 shows the resulting flow map averaged over the whole series (71 min). Moat flows are seen in the spot on the lower left of the FOV but more prominently in the spot on the right side (upper and lower penumbral regions). Several centers of diverging horizontal motions are present in the entire FOV. Some surround sunspots (lower left and right sides of the figure) but the most conspicuous ones are seen in the lesser magnetized area (lower part of the FOV between the spots), displaying greater velocities and more symmetrical shapes. These velocity structures, related to recurrent expansion and splitting of granules, are commonly associated with mesogranulation (Roudier et al., 2003; Roudier & Muller, 2004; Bonet et al., 2005).
The white lines in Fig. 2 delineate the line-of-sight (LOS) neutral lines inferred from a SOUP magnetogram (see Fig. 4). The regions crossed by this line correspond naturally to horizontal fields, similar to those found in penumbrae. However, we caution that these horizontal fields can have different flows as those that occur in normal penumbra (such as shear flows, as found by, Deng et al. (2006) or the supersonic nozzles observed by Martínez Pillet et al. (1994). Close inspection also shows that areas near neutral lines have a filamentary appearance that is much less distinct than observed in normal penumbrae extending radially from umbral cores.
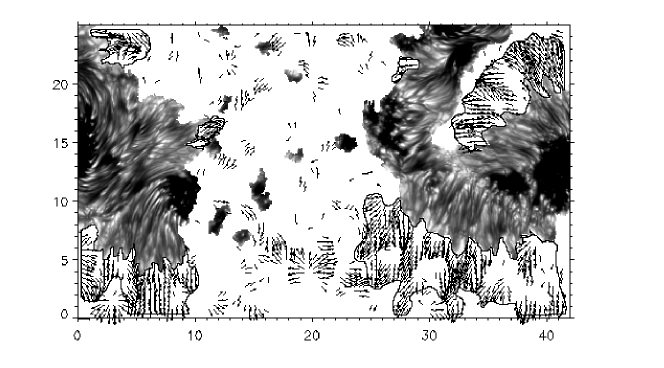
The map in Fig. 3 shows only those velocities in the granulation field with magnitude above km s-1. Strong radial outflows (moats) are evident surrounding the sunspots and km s-1 appears to be a characteristic in the velocity value to define the moats. The black contour in the figure outline the area of the moats. It has been drawn by hand following visual criteria of proximity to the sunspot and avoiding a few strong exploding events at the lower part of the FOV that contaminate the large-scale moat flow. Empty areas in the moat region in the velocity maps are a result of the chosen value of the velocity threshold and correspond to the interaction with exploding events that occur inside the moat.
From inspection of Fig. 3, it becomes evident that the moats are closely associated with the presence of a penumbra. The examples in the lower left, lower right and upper right corners are quite revealing. The right pointed velocity vectors on the lower left corner correspond to the moat flow of a penumbra that is not visible in the FOV of this figure. Moats are missing in the sunspot sides with no penumbral structure. This is readily seen in the right side of the umbral core at coordinates (9,10), but also in the left side of the one at (25,18). None of the pores in the middle of the FOV is associated with any moat-like flow. More importantly, moats are also absent in granulation regions that are located side by side with a penumbra, but that are in the direction perpendicular to that marked by the penumbral filaments. A clear example is the region around coordinates (9,6-7) in Fig. 3. As a ’normal’ (meaning here far from the neutral line) penumbra, it is a candidate to develop a moat flow, but none is seen in this region. The moat flow only appears along the direction delineated by the penumbral filaments. Moats, thus, appear to be a natural extension of the flow along the direction of penumbral filaments and do not exist as outflows in the transverse direction.
The penumbral region in Fig. 3, centered at coordinates (5,20), does not show clear evidences of a moat flow (although localized outflows are seen above and below it). This region corresponds to a strongly sheared neutral line commonly seen in spots (Deng et al., 2006). Figure 4 shows a SOUP magnetogram obtained simultaneously with the G-band series. The spot centered on the left side of the FOV (white polarity) does not show a radially outward directed penumbra, but penumbral filaments that run parallel to the neutral line. This is a configuration commonly referred as sheared. This configuration is also inferred from the filaments observed in the G-band frames. We suspect that both conditions, the presence of a neutral line and the absence of radially oriented filaments, are responsible for the absence of a clearly developed moat flow. The nature of neutral lines with sheared configurations in spots is not well understood. But we stress that if they correspond to relatively shallow structures, they would also block the upward propagation of heat and should be able to generate a moat flow. Such a moat flow is not observed in this sunspot.
4. Conclusions
Time series of G-band and G-cont images of a sunspot group with -configuration (NOAA active region 10786), spanning over 71 min, were observed and corrected for atmospheric and instrumental degradation. Proper motions in the entire FOV have been measured in the G-band series by means of local correlation tracking techniques. In this paper, we concentrate in the results obtained in the identified moat flows (or lack thereof) of several structures within the FOV. The main conclusions from our analysis can be summarized as follows:
1) We have detected strong (mean speeds of km s) outflows streaming from penumbrae radially oriented from an umbral core, the so-called sunspot moats. Umbral cores sides with no penumbra do not display moat flows.
2) Furthermore, the moats are also absent on penumbral sides perpendicular to the direction defined by the penumbral filaments. They are not found in directions transverse to them. A special case is sheared penumbral configurations tangential to the umbral core. No moat flow is found there either.
These evidence is clearly suggestive of a link between the moat flow and flows aligned with the penumbral filaments. The possible connection with the Evershed flow is inescapable. Although it can be argued that a physical relationship between these two flows is not firmly established in this work, we believe the evidence is clear-cut and that a statistical analysis of a larger number of regions, as done here, can establish this connection more solidly. In particular, work is being done on analysing the moat flow configuration of round unipolar sunspots lacking penumbra in one of their sectors to find more evidence supporting points 1) and 2) above.
This result should be put in the context of the recent findings by Sainz Dalda & Martínez Pillet (2005); see also Ravindra (2006). These authors find that the penumbral filaments extend beyond the photometric sunspot boundary and cross the region dominated by the moat flow. This region is also the location where the MMF activity is normally found. Indeed some of these MMFs are seen by these authors to start inside the penumbra. All these results point to an origin linking the moat flow and MMF activity with the well-known Evershed flow. Cabrera Solana et al. (2006) also suggest that the Evershed clouds inside the penumbrae propagate to the moat becoming MMFs once they leave the sunspot. It is indeed somewhat paradoxical that while the final fate of the Evershed flow has remained unknown for decades, independent explanations and physical scenarios have been proposed to generate the moat flow (that starts exactly where the Evershed flow is seen to vanish).
Similarly, the results obtained from local helioseismology near sunspots, in particular those related to the f-mode (Gizon et al., 2000), are also quite relevant to the results presented here. The interpretation of these results in terms of convective cells surrounding sunspots (e.g., Bovelet & Wiehr, 2003) may be different if the Evershed flow turns out to be the major process that injects mass into the moats surrounding sunspots.
We believe the hypothesis put forward in this paper, the moat flow is the continuation outside the spots of the Evershed flow, deserves adequate attention both from an observational and a theoretical point of view.
References
- Bonet et al. (2005) Bonet, J.A., Márquez, I., Muller, R., Sobotka, M., Roudier, Th., 2005, A&A, 430, 1089
- Bovelet & Wiehr (2003) Bovelet, B., & Wiehr, E., 2003, A&A 412, 249
- Cabrera Solana et al. (2006) Cabrera Solana, D., Bellot Rubio, L.R., Beck, C., Del Toro Iniesta, J.C., ApJ 649, L41
- Deng et al. (2006) Deng, N., Xu, Y., Yang, G., Cao, W., Liu, C., Rimmele, T.R., Wang, H. & Denker, C., 2006, ApJ 644, 1278
- Gizon et al. (2000) Gizon, L., Duvall, T.L., Jr., & Larsen, R.M. 2000, J. Astrophys. Astron., 21, 339
- Gonsalves (1982) Gonsalves, R. A., 1982, Opt. Eng. 21, 829
- Hagenaar & Shine (2005) Hagenaar, H.J., & Shine, R.A., 2005, ApJ 635, 659
- Harvey & Harvey (1973) Harvey, K., & Harvey, J., 1973, Solar Phys. 28, 61
- Löfdahl & Scharmer (1994) Löfdahl, M.G., Scharmer, G.B., 1994, A&A Suppl. Ser. 107, 243
- Martínez Pillet et al. (1994) Martínez Pillet, V., Lites, B. W., Skumanich, A., Degenhardt, D., 1994, ApJ, 425, 113
- Meyer et al. (1974) Meyer, F., Schmidt, H.U., Weiss. N. O., Wilson, P.R., 1974, Proc. IAU Symp., 56, p.235
- Molowny-Horas & Yi (1994) Molowny-Horas, R., & Yi, Z., 1994, ITA (Oslo) Internal Rep. No. 31
- November & Simon (1988) November, L.J., & Simon, G.W., 1988, ApJ 333, 427
- Nye et al. (1988) Nye, A., Bruning, D., Labonte, B. J., 1988, Solar Phys. 115, 251
- Paxman et al. (1992) Paxman, R.G., Schulz, T.J., Fienup, J.R., 1992, J.Opt.Soc.Am. A9, 7, 1072
- Ravindra (2006) Ravindra, B., 2006, Solar Phys. 236, 297
- Roudier & Muller (2004) Roudier, Th., & Muller, R., 2004, A&A, 419, 757
- Roudier et al. (2003) Roudier, Th., Lignières, F., Rieutord, M., Brandt, P.N., & Malherbe, J.M. 2003, A&A, 409, 299
- Sainz Dalda & Martínez Pillet (2005) Sainz Dalda, A., Martínez Pillet, V., 2005, ApJ, 662, 1176
- Scharmer et al. (2003a) Scharmer G. B., Bjelksjö K., Korhonen, T.K., Lindberg, B. & Petterson, B., 2003a, Proc. SPIE. 4853, 341
- Scharmer et al. (2003b) Scharmer G. B., Dettori, P. M., Löfdahl, M. G. & Shand, M., 2003b, Proc. SPIE, 4853, 370
- Schrijver & Zwann (2000) Schrijver, C. J., & Zwann, C., 2000, Solar and stellar magnetic activity. Cambridge U Press
- Sheeley (1972) Sheeley, N.R., 1972, Solar Phys. 25, 98
- Sobotka et al. (1999) Sobotka, M., Vázquez, M., Bonet, J.A., Hanslmeier, A., Hirzberger, J., 1999, ApJ, 511, 436
- Title et al (1986) Title, A. M., Tarbell, T., Simon, G., and the SOUP team, 1986, Adv. Space Res., 6, 253
- Van Noort et al. (2005) Van Noort. M., Rouppe van der Voort, L., Löfdahl, M. G., 2005, Sol. Phys., 228, 191
- Vrabec (1974) Vrabec, D., 1974, Proc. IAC Symp., 56, p.201