22institutetext: National Centre for Radio Astrophysics, Post Bag 3, Ganeshkhind, Pune 411 007, India
A multiwavelength study of the ultracompact HII region associated with IRAS 20178+4046
Abstract
Aims. We present a multiwavelength study of the ultra compact HII region associated with IRAS 20178+4046. This enables us to probe the different components associated with this massive star forming region.
Methods. The radio emission from the ionized gas was mapped at 610 and 1280 MHz using the Giant Metrewave Radio Telescope (GMRT), India. We have used 2MASS data to study the nature of the embedded sources associated with IRAS 20178+4046. Submillimetre emission from the cold dust at 450 and 850 m was studied using JCMT-SCUBA.
Results. The high-resolution radio continuum maps at 610 and 1280 MHz display compact spherical morphology. The spectral type of the exciting source is estimated to be B0.5 from the radio flux densities. However, the near-infrared (NIR) data suggest the presence of several massive stars (spectral type earlier than O9) within the compact ionized region. Submillimetre emission shows the presence of two dense cloud cores which are probably at different evolutionary stages. The total mass of the cloud is estimated to be 700 – 1500 from the submillimetre emission at 450 and 850 m.
Conclusions. The multiwavelength study of this star forming complex reveals an interesting scenario where we see the presence of different evolutionary stages in star formation. The ultra compact HII region coinciding with the southern cloud core is at a later stage of evolution compared to the northern core which is likely to be a candidate protocluster.
Key Words.:
infrared: ISM – radio continuum: ISM – ISM: H II regions – ISM: individual objects: IRAS 20178+40461 Introduction
The early stages and evolution of massive stars are some of the least understood aspects of star formation. Ultracompact (UC) HII regions are manifestations of newly formed massive (O or early B) stars deeply embedded in the parental cloud. IRAS 20178+4046 (G78.44+2.66) is a massive star forming region chosen from the catalog of massive young stellar objects by Chan et al. (1996). It has been classified as an UC HII region (Kurtz et al. 1994;1999). The kinematic distance estimates range from 1.5 kpc to 3.3 kpc (Kurtz et al. 1994; Caswell et al. 1975). In this paper we assume a distance of 3.3 kpc. The far-infrared (FIR) luminosity from the IRAS fluxes is estimated to be (Kurtz et al. 1994). IRAS low-resolution spectra show a red continuum beyond 13 m with the presence of the polycyclic aromatic hydrocarbon (PAH) feature at 11.3 m (Volk & Cohen 1989). In their study of UC HII regions, Faison et al. (1998), present the intermediate resolution infrared spectra of IRAS 20178+4046, where PAH features at 3.3, 8.7 and 11.3 m, the [Ne II] line at 12.8 m and the silicate feature at 9.7 m have been detected. MSX mid-infrared (MIR) image at 21 m is presented by Crowther & Conti (2003).
In a recent study, Verma et al. (2003) have mapped this source in two FIR bands ( 150 and 210 m) with the 1 m TIFR balloon-borne telescope. They also present the ISO observations using the ISOCAM instrument in seven spectral bands (3.30, 3.72, 6.00, 6.75, 7.75, 9.62 and 11.4 m). The ISOCAM images mainly consist of a single component with a lobe towards south. They have modelled this source with a single core and a dust density distribution of the form comprising mainly of silicates. IRAS 20178+4046 has been part of several maser surveys (Codella et al. 1996; Baudry et al. 1997; Slysh et al. 1999; Szymczak et al. 2000). No maser has been found to be associated with this source. It has been detected in the CS(2–1) survey of Bronfman et al. (1996). McCutcheon et al. (1991) and Wilking et al. (1989) have observed this source in the CO lines as part of the survey of protostellar candidates.
In this paper, we present a multiwavelength study of this UC HII region. In Sect. 2, we describe the radio continuum observations and the related data reduction procedure used. In Sect. 3, we discuss other available datasets used in the present study. Section 4 presents a comprehensive discussion of the results obtained. In Sect. 5, we discuss the general star forming scenario in the region associated with IRAS 20178+4046 and in Sect. 6 we summarize the results.
2 Observations and Data Reduction
2.1 Radio continuum observations
In order to probe the ionized gas component, radio continuum interferometric mapping of the region around IRAS 20178+4046 was carried out using the Giant Metrewave Radio Telescope (GMRT) array, India. Observations were carried out at 1280 and 610 MHz. The GMRT has a “Y”-shaped hybrid configuration of 30 antennas, each 45 m in diameter. There are six antennas along each of the three arms (with arm length of 14 km). These provide high angular resolution (longest baseline 25 km). The rest of the twelve antennas are located in a random and compact arrangement within near the centre and is sensitive to large scale diffuse emission (shortest baseline 100 m). Details of the GMRT antennas and their configurations can be found in Swarup et al. (1991). The radio sources 3C48 and 3C286 were used as the primary flux calibrators, while 2052+365 was used as phase calibrator for both the 1280 and 610 MHz observations.
Data were reduced using AIPS. The data sets were carefully checked using tasks UVPLT and VPLOT for bad data (owing to dead antennas, bad baselines, interference, spikes, etc). Subsequent editing was carried out using the tasks UVFLG and TVFLG. Maps of the field were generated by Fourier inversion and subsequent cleaning using the task IMAGR. Several iterations of self calibration were carried out to obtain improved maps.
3 Other available datasets
3.1 Near-infrared data from 2MASS
Near-infrared (NIR) () data for point sources around IRAS 20178+4046 have been obtained from the Two Micron All Sky Survey111This publication makes use of data products from the Two Micron All Sky Survey, which is a joint project of the University of Massachusetts and the Infrared Processing and Analysis Center/California Institute of Technology, funded by the NASA and the NSF. (2MASS) Point Source Catalog (PSC). Source selection was based on the ‘read-flag’ which gives the uncertainties in the magnitudes. In our sample we retain only those sources for which the ‘read-flag’ values are 1 – 3. The 2MASS data have been used to study the sources associated with the UC HII region.
3.2 Mid-infrared data from MSX
The Midcourse Space Experiment222This research made use of data products from the Midcourse Space Experiment. Processing of the data was funded by the Ballistic Missile Defense Organization with additional support from NASA Office of Space Science. This research has also made use of the NASA/ IPAC Infrared Science Archive, which is operated by the Jet Propulsion Laboratory, Caltech, under contract with the NASA.(MSX) surveyed the Galactic plane in four MIR bands centered at 8.3 (A), 12.13 (C), 14.65 (D) and 21.34 m (E) at a spatial resolution of 18′′ (Price et al. 2001). The MIR data is used to model the continuum SED from the interstellar medium around IRAS 20178+4046. Other than this, two of the MSX bands (A & C) cover the unidentified infrared bands (UIBs) at 6.2, 7.7, 8.7, 11.3 and 12.7 m. The MSX images in the four bands for the region around IRAS 20178+4046 have been used to study the emission from the UIBs and to estimate the spatial distribution of temperature and optical depth of the warm interstellar dust. The MSX Point Source Catalog (MSX PSC) is used to study MIR sources associated with the UC HII region.
3.3 Sub-mm data from JCMT
Submillimetre observations at 450 and 850 m using the Submillimetre Common-User Bolometer Array (SCUBA) instrument of the James Clerk Maxwell Telescope333This paper makes use of data from the James Clerk Maxwell Telescope Archive. The JCMT is operated by the Joint Astronomy Centre on behalf of the UK particle Physics and Astronomy Research Council, the National Research Council of Canada and the Netherlands Organisation for Pure Research. (JCMT) were retrieved from the JCMT archives and processed using their standard pipeline SCUBA User Reduction Facility (SURF). JCMT-SCUBA observations for the data used in our study were carried out on 17 Aug 1998. Uranus was used as the primary flux calibrator for the maps. The submillimetre maps were used to study the cold dust environment associated with IRAS 20178+4046.
4 Results and Discussion
4.1 Radio continuum emission from ionized gas
High-resolution radio maps were generated from the GMRT data. The radio continuum emission from the ionized gas associated with the region around IRAS 20178+4046 at 1280 and 610 MHz is shown in Fig. 1. The details of the observations and maps are given in Table 1. For the 610 MHz observations, we present the map generated by using only baselines larger than 1 kilo-lambda. Correction factors for the system temperature () were obtained from additional observations of the neighbouring sky on and off the Galactic plane. The correction factors are 1.2 and 1.6 for 1280 and 610 MHz, respectively. The generated maps were scaled using the correction factors obtained from our observations. The integrated flux densities from our maps at 1280 and 610 MHz are 574 and 664 mJy, respectively. The flux densities are estimated by integrating down to the lowest selected contour at the 3 level, where -s are the rms noises in the respective maps. The corresponding size of the UC HII region is 10″and 15″at 1280 and 610 MHz, respectively. Considering the errors, these flux densities are consistent with the hypothesis that the emission at these frequencies are optically thin. For this UC HII region, Wilking et al. (1989) estimate flux density values of 80 and 65 mJy from their 15 and 5 GHz radio maps and McCutcheon et al. (1991) obtain a value of 69 mJy at 5 GHz. As expected from our low frequency GMRT data, the 5 GHz flux density values of the above studies also indicate an optically thin continuum flux distribution. The higher value at 15 GHz from Wilking et al. (1989) may be due to the contribution from the extended emission.
Kurtz et al. (1994;1999) have also studied this source at 8.3 and 15 GHz. Kurtz et al. (1994) estimate flux density values of 82.2 and 35.6 mJy from their very high-resolution ( 1″) maps using the VLA B array at 8.3 and 15 GHz, respectively. The integration boxes used by them are and for the two bands, respectively. Further observations by Kurtz et al. (1999) at 8.3 GHz with the VLA D array give a value of 68 and 158 mJy for 50″ and 300″ boxes, respectively with a synthesized beam size of . It should be noted here that the 300″ box covers a much larger area and includes the surrounding extended diffuse emission.


| Details | 1280 MHz | 610 MHz |
|---|---|---|
| Date of Obs. | 2 Aug 2003 | 18 Sep 2004 |
| Primary beam | 26′ | 54′ |
| Cont. bandwidth (MHz) | 16 | 16 |
| Synth. beam | 4″.9 2″.7 | 5″.04″.8† |
| Position angle. (deg) | -38.6 | -0.25 |
| Peak Flux (mJy/beam) | 22.3 | 29.0 |
| rms noise ()(mJy/beam) | 1.4 | 1.5 |
| Largest detectable | 8′ | 17′ |
| scale size | ||
| Highest angular | 2″ | 4″ |
| resolution | ||
| Int. Flux density‡ (mJy) | 574 | 664 |
† For 610 MHz, the synthesized
beam size is for the baselines 1 kilo-lambda
‡ Flux densities are obtained by integrating down to
the contour at 3 level, where represents
the map noise in corresponding frequency band.
The contour maps at 1280 and 610 MHz generated from the GMRT observations display a simple compact spherical morphology. In comparison, the high-resolution ( 1″) radio map at 8.3 GHz of Kurtz et al. (1994) show a cometary UC HII region. However, in their 15 GHz map, the sources are resolved out and morphology looks ‘clumpy’. This is possibly the reason for the low integrated flux density (35.6 mJy) obtained at this frequency. The lower resolution (8″.7 7″.8) 8.3 GHz map by Kurtz et al. (1999) is unresolved with an extended east-west emission seen to the south which according to the authors is unlikely to be connected with the UC HII region. A point worth mentioning here is that we possibly detect extended diffuse emission in the low resolution map at 610 MHz (not presented in this paper). But the signal-to-noise ratio of the map is not sufficient to conclusively comment on the nature and association if any of this extended diffuse emission with the UC HII region. However, we do not detect any such emission in our 1280 MHz map. This could be because the flux levels of the extended emission is below our sensitivity limit at 1280 MHz.
Using the low-frequency flux densities at 1280 and 610 MHz from our GMRT observations and the 8.3 GHz data from Kurtz et al. (1999), we derived the physical properties of the compact core of the HII region associated with IRAS 20178+4046. Mezger & Henderson (1967) have shown that for a homogeneous and spherically symmetric core, the flux density can be written as
| (1) |
where
| (2) |
where is the integrated flux density in Jy, the electron temperature in K, the frequency of observation in MHz, the optical depth, the solid angle subtended by the source in steradians, and the emission measure in . Also, is a correction factor and we used a value of 0.99 (using Table 6 of Mezger & Henderson 1967) for the frequency range 0.6 – 8 GHz and . The two GMRT maps were convolved to a common angular resolution of , which is the resolution of the 8.3 GHz map of Kurtz et al. (1999). In our case, since the core is unresolved, is taken as this synthesized convolved beam size (i.e , where and are the half power beam sizes). The peak flux densities of the core in the 0.6 – 8.3 GHz frequency range are consistent with an optically thin HII region. Assuming a typical electron temperature of 8000 K, these flux densities were used to fit the above equations. The best fit value for the emission measure is . We obtained an estimate of for the electron density: , with being the core size which in this case corresponds to the synthesized convolved beam size of . These values are on the lower side compared to the estimates of Kurtz et al. (1994) obtained from their high-resolution maps at 8.3 GHz. They derive values of and for and , respectively. It should be noted here that the beam size of Kurtz et al. (1994) is much smaller compared to the convolved beam size used in our derivation.
Taking the total integrated flux densities of 57 and 66 mJy estimated from the 1280 and 610 MHz maps and using the formulation of Schraml & Mezger (1969) and the table from Panagia (1973; Table II), we estimate the exciting zero age main-sequence star (ZAMS) of this UC HII region to be of spectral type B0.5 – B0. This is consistent with the estimates of Kurtz et al. (1994; 1999). However, the FIR luminosity of from IRAS PSC implies an exciting star of spectral type O8 (Kurtz et al. 1994). Radiative transfer modeling of the FIR and MIR flux densities of IRAS 20178+4046 by Verma et al. (2003) also suggests an O7 ZAMS exciting star. In a later section (see Sect. 4.4), a detailed model of the emission from the ISM around IRAS 20178+4046 has been presented, which implies the region to be powered by a cluster with the most massive star being of type B0.
4.2 Embedded cluster in the near-infrared
The 2MASS - band image of the region around IRAS 20178+4046 is shown in Fig. 2.
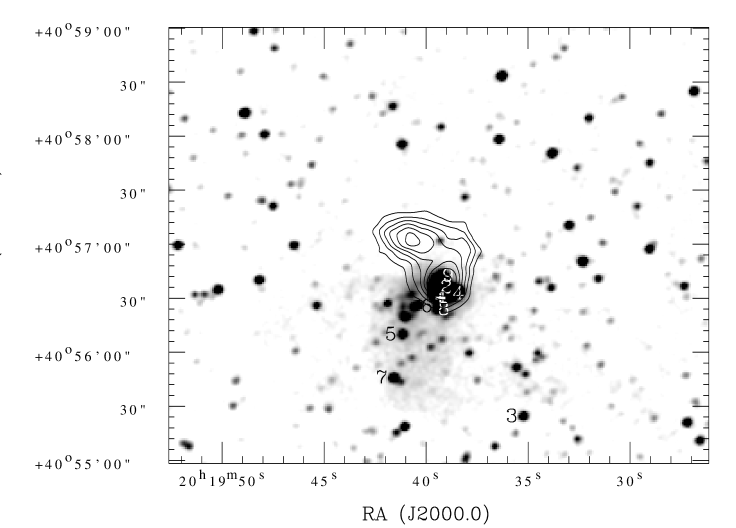
We see the presence of a stellar group/cluster mostly concentrated around the UC HII region. We use the 2MASS data to study the nature of these sources seen in the vicinity of this UC HII region associated with IRAS 20178+4046. We select a large area of 90″ radius centred on the IRAS point source so as to completely cover the UC HII region and the surrounding diffuse nebulosity seen in the near-infrared images. We have restricted our sample of sources to those having good quality photometry (2MASS ‘read-flag’ 1 – 3). Figure 3 shows the two (()/ and ()/) NIR colour-magnitude (CM) diagrams. Using the ZAMS loci and the reddening vectors, we estimated the spectral type of the sources. The two CM diagrams show the presence of nine early type sources with spectral types B0.5 or earlier, out of which six sources are common to both the diagrams. Within an error of around one subclass (except for source # 3), the spectral type estimations derived from both the CM diagrams are consistent. It is likely that the source # 3 (which has the least extinction among the early type stars) is a foreground star though it is not very close to the zero extinction curve. It is also possible that it does not belong to the group because spatially it is farther away (see Fig. 2). The nine early type sources identified from both the CM diagrams are listed in Table 2.


| Source | RA (2000.0) | DEC (2000.0) | J | H | Ks |
|---|---|---|---|---|---|
| No. | (hh:mm:ss.s) | (dd:mm:ss.s) | (mag) | (mag) | (mag) |
| 1 | 20:19:39.5 | +40:56:30.5 | 12.4910.034 | 10.9290.023 | 10.0160.027 |
| 2 | 20:19:39.3 | +40:56:35.9 | 12.5320.030 | 10.4330.039 | 9.1500.029 |
| 3 | 20:19:35.2 | +40:55:24.0 | 13.3800.022 | 12.0760.019 | 11.5800.015 |
| 4 | 20:19:38.7 | +40:56:32.6 | 13.4000.040 | 11.6590.034 | – |
| 5 | 20:19:41.2 | +40:56:09.6 | 13.9300.026 | 12.4560.018 | 11.5970.024 |
| 6 | 20:19:40.5 | +40:56:25.3 | 14.1180.046 | 12.2090.032 | 11.3150.029 |
| 7 | 20:19:41.6 | +40:55:45.5 | 14.4050.037 | 12.4750.030 | 11.2120.026 |
| 8 | 20:19:39.4 | +40:56:23.7 | – | 12.6100.029 | 11.3040.025 |
| 9 | 20:19:39.2 | +40:56:42.4 | – | 12.8330.032 | 11.4140.019 |
Note: Magnitudes satisfying the ‘read-flag’
criteria of 1 – 3 are given for the sources
Figure 4 shows the colour-colour (CC) diagram for the sources in the region associated with IRAS 20178+4046. For clarity we have classified the CC diagram into three regions (e.g. Tej et al. 2006; Ojha et al. 2004a & b). The sources in region “F” are generally considered to be either field stars, Class III objects, or Class II objects with small NIR excess. The “T” sources are classical T Tauri stars (Class II objects) with large NIR excess or Herbig AeBe stars with small NIR excess. The “P” region has mostly protostar-like Class I objects and Herbig AeBe stars. Considering the quoted magnitude errors in Table 2, majority of the early type sources (except source # 6 and # 3) are seen to lie in the “T” region.

In Fig. 2, we have overplotted sources listed in Table 2 on the -band 2MASS image. It is interesting to see that five of these massive stars form a cluster at the centre, of which the position of source # 1 coincides with the IRAS point source position. Comparing with the radio morphology (Fig. 1 left panel), sources # 1 and # 2 are well within the compact ionized region. Sources # 4, # 6, #8, # 9 envelope the UC HII region almost in a ring like structure. Apart from this clustering, three sources (#6, #5, #7) form a tail-type arc extending to the south. They lie within the diffuse emission (southward lobe) seen in the -band image.
The presence of the massive star clustering makes the complex interesting because the radio flux density suggests a B0 – B0.5 exciting source. It is likely that these sources are deeply embedded. This results in absorption of a large fraction of UV photons by the surrounding dust which results in the underestimation of the spectral type from the radio flux density of the ionized gas. Star # 2 has spectral type much earlier than O5 as indicated by both the CM diagrams. This could either be a deeply embedded pre main-sequence (PMS) star or two or more unresolved early-type stars. However, there is a discrepancy seen in the FIR luminosity (Kurtz et al. 1994) when compared with the total luminosity derived from the NIR sources. This could probably be due to the distance uncertainties, IR excess and 2MASS resolution limit which results in inaccuracies in the spectral type determinations from the NIR CM diagrams. Hence, additional infrared spectroscopic observations are essential in determining the exact nature and spectral type of these sources.
4.3 Dust emission in the sub-mm from JCMT-SCUBA data
We used the emission in submillimetre wavebands to study the cold dust environment in the region around IRAS 20178+4046. The spatial distribution of cold dust emission at 450 and 850 m is displayed in Fig. 5.


The angular resolutions are and for the 450 and 850 m wave bands, respectively. The 450 m map is relatively noisy and shows clumpy nature, whereas, the 850 m map clearly shows the presence of two dust cores.
The dust mass can be estimated from the following relation:
| (3) |
This is taken from Sandell (2000) and is a simplified version of Eq. 6 of Hildebrand (1983). The above equation assumes the standard Hildebrand opacities (i.e. ). Here, is the flux density at frequency , the dust temperature, the dust emissivity index and is taken to be 2 (Hildebrand 1983), and the distance to the source in kpc. We assume a typical dust temperature of 20 K (see Tej et al. 2006; Klein et 2005). The flux densities are obtained from the JCMT-SCUBA maps shown in Fig. 5. To obtain the flux density of the entire cloud, we integrated up to the last contour (which is at 35% of the peak value). Using the above relation, we estimate dust masses of 7 and 15 from the 450 and 850 m maps, respectively. Assuming a gas-to-dust ratio of 100, the above values translate to total masses of 700 and 1500 for the cloud from the 450 and 850 m maps, respectively. We estimate the individual masses of the these two dust cores to be 250 (northern core) and 335 (southern core) from the 850 m map. The cores are defined to cover regions upto 75% of the northern and southern intensity peaks. Exploring the range of (20 – 40 K) and (1 – 2), we infer that the mass estimates can be lower by up to a factor of 8.
In Fig. 6, we present the various components of the region associated with IRAS 20178+4046. The plot shows the contour map of the dust emission at 850 m and the peak position of ionized gas emission at 1280 MHz overlaid on the 3.6 m Spitzer-IRAC444The archival image presented is the Post-Basic Calibrated Data (PBCD) downloaded using the software Leopard. This work is based in part on observations made with the Spitzer Space Telescope, which is operated by the Jet Propulsion Laboratory, under NASA contract 1407. image.
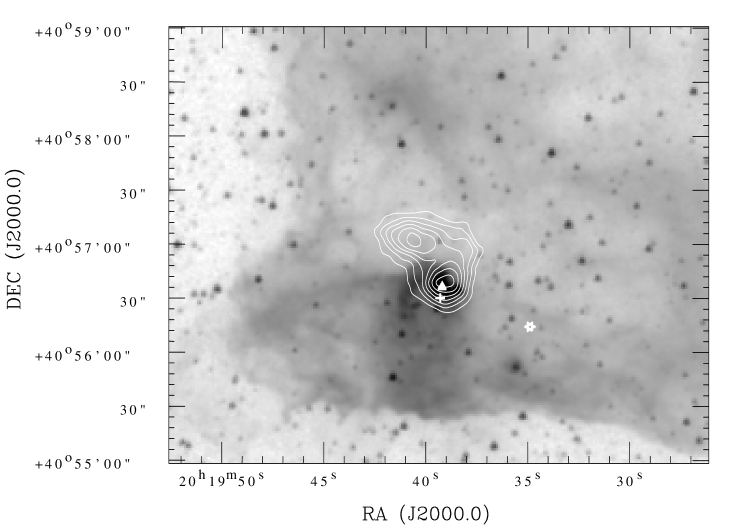
As compared to the -band image, the diffuse emission seen in the Spitzer image is far more extended. The outer envelope spreads out to a “hat-shaped” morphology. It is interesting to note that the southern core of the 850 m map coincides with the radio continuum emission and the cluster of massive stars. One MIR source (G078.4373+02.6584 – .2), lies inside the southern core coincident with the radio peak position. The MSX MIR colours , , , and of this source fall in the zone mostly occupied by compact HII regions (Lumsden et al. 2002). MIR emission in UIBs due to PAH (see Appendix A) is also seen from this region. The morphology of the UIB emission is similar to that seen in the Spitzer image. Comparing with the FIR intensity maps of Verma et al. (2003), it is seen that this southern core is not spatially coincident with the FIR peaks at 150 and 210 m but lies close to them (the core is located close to the last contours of the maps presented in Fig. 5 of Verma et al. 2003). It is likely that this is an evolved protocluster or a young (partly embedded) cluster where the massive stars develop UC HII regions and the cluster emerges out of the parental cloud and the stars are detected in the near-infrared. Whereas, the northern core is only detected in the sub-mm. No radio emission (down to the level of the rms noise in the radio maps), MIR or NIR emission is detected for this core. As is seen clearly from Figs. 2 and 6, the northern core appears as an absorption region with a notable lack of stars. This northern core is relatively further away from the emission peaks in the two FIR bands (150 & 210 m) as compared to the southern core. The mass of the two cores are similar and satisfy the mass limit criteria of 100 (Klein et al. 2005) for identifying earliest stages of massive star formation. The above scenario suggests that this dense core could be harbouring a possible pre-protocluster or an early protocluster candidate where we are sampling the initial phases of cloud collapse in which massive stars have possibly begun to form deeply embedded in the cluster. Though the FIR data is not conclusive, the location of the sub-mm dust cores with respect to the other components most likely implies that we are seeing different evolutionary stages of star formation in the two cores. A similar massive star forming complex IRAS 06055+2039 was studied by Tej et al. (2006) where the dense cloud core was at an earlier evolutionary stage compared to the associated HII region.
4.4 Line emission from the Gas
Spectroscopic signatures from the interstellar gas around IRAS 20178+4046 have been considered to explore additional information about this star forming region. Millimeter-wave observations of CS(=2-1) by Bronfman et al (1996), 13CO(2-1) by Wilkins et al (1989) and 13CO(1-0) by McCutcheon et al (1991) has been translated to estimated gas mass of 544, 1130 and 1760 M⊙ respectively, under reasonable assumptions. The lower value from the CS data is expected due to a smaller beam size (39″) used. These masses are similar to the estimates from the thermal emission from cold dust, 700 – 1500 M⊙ (see Sect. 4.3). The available infrared spectroscopic measurements for IRAS 20178+4046 includes IRAS Low Resolution Spectrometer data (LRS; covering 8 to 22 m) and those by Faison et al. (1998) (covering 3 – 5.3 & 8 – 13 m). The latter has detected the [Ne II] line at 12.8 m. We have analysed the IRAS-LRS data to extract possible spectral signatures for a few selected ionic fine-structure lines commonly observed in HII regions. This resulted in clear detection of the [Ne II] line and marginal detections of the lines due to [S III] (18.7 m) and [Ar III] lines (8.99 m).
We have explored a self-consistent model of IRAS 20178+4046 region capable of explaining the observed infrared line emission as well as radio continuum from the photo-ionized gas. The scheme developed by Mookerjea & Ghosh (1999) has been used, which is based on the photoionization code CLOUDY (Ferland 1996). It considers various relevant physical and chemical processes involving constituents of the interstellar cloud. The geometrical parameters describing the cloud were taken from Verma et al. (2003), who have successfully modelled the observed infrared SED and angular sizes using radiative transfer through the dust component. Our best model corresponds to a constant density cloud of radial dust optical depth, = 0.005, and a centrally embedded star cluster with upper mass cut-off of 17.5 (B0 type star) and the slope of the initial mass function of -1.6. The predicted radio emission at 1280 MHz is 51 mJy in very good agreement with our GMRT measurement (57 mJy). The emerging infrared spectrum including high-contrast lines are presented in Fig. 7 alongwith the observed SED. The inferred luminosity of the [Ne II] line from the measurements of Faison et al. (1998) and IRAS LRS correspond to 74 & 5.3 L⊙, respectively. This discrepancy could be due to the very different beams and spectral resolutions employed. The prediction of our model lies in between these two values, viz., 26.1 L⊙. The luminosities for the [S III] and [Ar III] lines extracted from IRAS LRS are 7.7 & 0.7 L⊙ respectively, which are lower than those predicted. However, the predicted line ratio [S III]/[Ne II] is very similar to that from the LRS. Better measurements of these and other spectral lines are required to resolve the above issues. Several of the lines predicted (Fig. 7), can easily be detected by the InfraRed Spectrograph (IRS) instrument onboard Spitzer Space Telescope, leading to better understanding of the star forming complex associated with IRAS 20178+4046.

5 General star formation scenario in IRAS 20178+4046
The morphology of the radio emission of this UC HII region at higher resolution (Kurtz et al. 1994) is cometary in shape. As mentioned in Garay & Lizano (1999), the champagne flow and the bow shock models explain the cometary morphologies satisfactorily though observationally it is difficult to differentiate between the two. The morphology of the various components presented in Fig. 6 seems to suggest a champagne flow. In this model the medium in which the massive star is born has strong density gradients which results in the HII region moving supersonically away from the high density region in a so-called champagne flow (Garay & Lizano 1999). The HII region is density bounded and the pressurized HII gas bursts out of the cloud into a fan-like or plume-like structure. The presence of the dense dust core and the high density to the north of the UC HII region and the fan-like morphology seen in the Spitzer image and the MIR image adds strength to this conjecture. It is important to note that the fan-like morphology is seen in the other three IRAC bands also (4.5, 5.8 and 8 m which are not presented in this paper). Theoretical simulations in the champagne phase by Yorke et al. (1983) show that during this phase the resulting configuration is ionization bounded on the high-density side and density bounded on the side of the outward flow. The Spitzer image shows the presence of another high density lane to the south of the fan-like diffuse emission. This southern high density lane is spatially coincident with the east-west extended emission detected in the low resolution 8.3 GHz map of Kurtz et al. (1999). Further high resolution observations of molecular gas velocity structure in this star forming region is crucial in understanding the details of the environment and formation mechanism of the massive stars. Inspite of the intrinsic temporal variability typically seen in masers (Stahler & Palla 2004) and the sensitivity of the single dish observations carried out for this source, the absence of the OH maser could possibly be an indication of a more evolved HII region (Codella et al. 1994) in support of the optically thin scenario infered from our radio observations.
6 Conclusions
The massive star forming region associated with IRAS 20178+4046 has been studied in detail in the radio, infrared and sub-mm wavelengths, leading to the following conclusions
-
1.
High-sensitivity and high-resolution radio continuum maps at 1280 and 610 MHz obtained from our observations using GMRT show a simple compact spherical morphology. The total integrated emission implies an exciting star of spectral type B0 – B0.5.
-
2.
The sub-mm emission from cold dust has been studied using JCMT-SCUBA at 450 and 850 m, from which we estimate the total mass of the cloud to be 700 – 1500 which is also supported by the estimates derived from the millimeter-wave molecular line data. The 850 m map shows the presence of two dense cores of masses 250 and 335 . The southern core is most likely an evolved protocluster or a young cluster where the massive stars have formed the UC HII region and the cluster emerges out of the parental cloud. The northern core is only detected in the sub-mm and is a possible pre-protocluster candidate.
-
3.
The NIR colours from 2MASS data suggest the presence of several massive stars (earlier than B0.5) within and enveloping the UC HII region which are likely to be deeply embedded.
-
4.
The embedded star cluster has been characterized by modelling the observed radio continuum and infrared SED using a photoionization code. The upper mass cut-off is found to be 17.5 (B0 type star) for an usual initial mass function.
Acknowledgments
We thank the anonymous referee for providing critical comments and suggestions, which have helped in improving the scientific content of this paper. We also thank Dr. Malcolm Walmsley for his useful suggestions. We thank the staff at the GMRT who have made the radio observations possible. GMRT is run by the National Centre for Radio Astrophysics of the Tata Institute of Fundamental Research.
References
- (1) Baudry, A., Desmurs, J. F., Wilson, T. L., & Cohen, R. J. 1997, A&A, 325, 255
- (2) Bessell, M. S., & Brett, J. M. 1988, PASP, 100, 1134
- (3) Bronfman, L., Nyman, L. -A., & May, J. 1996, A&AS, 115, 81
- (4) Caswell, J. L., Murray, J. O., Roger, R. S., et al. 1975, A&A, 45, 239
- (5) Chan, S. J., Henning, T., & Schreyer, K. 1996, A&AS, 115, 285
- (6) Codella, C., Felli, M., & Natale, V. 1996, A&A, 311, 971
- (7) Codella, C., Felli, M., Natale, V., Palagi, F., Palla, F. 1994, A&A, 291, 261
- (8) Crowther, P. A., & Conti, P. S. 2003, MNRAS, 343, 143
- (9) Faison, M., Churchwell, E., Hofner, P., et al. 1998, ApJ, 500, 280
- (10) Ferland, G. J., 1996, Hazy, a brief introduction to CLOUDY, Univ. of Kentucky, Dept. of Phys. and Astron. Internal Reports.
- (11) Garay, G., Lizano, S. 1999, PASP, 111, 1049
- (12) Ghosh, S. K., & Ojha, D. K. 2002, A&A, 388, 326
- (13) Hildebrand, R. H. 1983, QJRAS, 24, 267
- (14) Klein, R., Posselt, B., Schreyer, K., Forbich, J., & Henning, Th. 2005, ApJS, 161, 361
- (15) Kurtz, S., Churchwell, E., & Wood, D. O. S. 1994, ApJS, 91, 659
- (16) Kurtz, S. E., Watson, A. M., Hofner, P., & Otte, B. 1999, ApJ, 514, 232
- (17) Lada, C. J., & Adams, F. C. 1992, ApJ, 393, 278
- (18) Lumsden, S. L., Hoare, M. G., Oudmaijer, R. D., & Richards, D. 2002, MNRAS, 336, 621
- (19) Mathis, J. S., Mezger, P. G., Panagia, N. 1983, A&A, 128, 212
- (20) Mezger, P. G., & Henderson, A. P. 1967, ApJ, 147, 471
- (21) McCutcheon, W. H., Dewdney, P. E., Purton, C. R., & Sato, T. 1991, AJ, 101, 1435
- (22) Meyer, M. R., Calvet, N., & Hillenbrand, L. 1997, AJ, 114, 288
- (23) Mookerjea, B. & Ghosh, S. K., 1999, J. Astrophys. Astr. 20, 1
- (24) Ojha, D. K., Tamura, M., Nakajima, Y., et al. 2004a, ApJ, 608, 797
- (25) Ojha, D. K., Tamura, M., Nakajima, Y., et al. 2004b, ApJ, 616, 1042
- (26) Panagia, N. 1973, AJ, 78, 929
- (27) Price, S. D., Egan, M. P., Carey, S. J., Mizuno, D. R., & Kuchar, T. A. 2001, AJ, 121, 2819
- (28) Rieke, G. H., & Lebofsky, M. J. 1985, ApJ, 288, 618
- (29) Sandell, G. 2000, A&A, 358, 242
- (30) Schraml, J., & Mezger, P. G. 1969, ApJ, 156, 269
- (31) Slysh, V. I., Val’tts, I. E., Kalenskii, S. V., Voronkov, M. A., Palagi, F., Tofani, G., & Catarzi, M. 1999, A&AS, 134,115
- (32) Stahler, S. W., Palla, F. 2004, in The Formation of Stars, WILEY-VCH Verlag GmbH & Co. KGaA
- (33) Swarup, G., Ananthakrishnan, S., Kapahi, V. K., et al. 1991, Current Sci., 60, 95
- (34) Szymczak, M., Hrynek, G., & Kus, A. J. 2000, A&AS, 143, 269
- (35) Tej, A., Ojha, D. K., Ghosh, S. K., Kulkarni, V. K., Verma, R. P., Vig, S., Prabhu, T. P. 2006, A&A, 452, 203
- (36) Verma, R. P., Ghosh, S. K., Mookerjea, B., & Rengarajan, T. N. 2003, A&A, 398, 589
- (37) Volk, K., & Cohen, A. 1989, AJ, 98, 931
- (38) Wilking, B. A., Mundy, L. G., Blackwell, J. H., & Howe, J. E. 1989, ApJ, 345, 257
- (39) Yorke, H. W., Tenorio-Tagle, G., Bodenheimer, P. 1983, A&A, 127, 313
Appendix A Spatial distribution of UIBs from the MSX data
We have used the scheme developed by Ghosh & Ojha (2002) to extract the contribution of UIBs (due to the PAHs) from the mid-infrared images in the four MSX bands. The scheme models the observations with a combination of thermal emission from the ‘normal’ large interstellar dust grains (gray body) and the UIB emission from the gas component, under reasonable assumptions. The spatial distribution of emission in the UIBs with an angular resolution of 18′′ (for the MSX survey) extracted for the region around IRAS 20178+4046 is shown in Fig. 8. The morphology of the UIB emission is similar to that of the diffuse emission seen in the -band and Spitzer images shown in Figs. 2 and 6. The integrated emission (upto 5% of the peak value) from the UIB features in band A (viz., 6.2, 7.7, 8.7 m) and band C (11.3, 12.7 m) is found to be . In comparison, the emission in the PAH bands (6.2, 7.7 & 11.3 m) from the ISOCAM measurements is reported to be in Verma et al. (2003). Our larger value is not surprising considering that it includes two additional features and also covers a larger area. In addition, spatial distribution of warm dust component (optical depth; ) and its temperature () have been generated (maps not presented here). The distribution of is compact with a peak value of 0.018, the peak coinciding with that of the UIB emission. On the other hand, distribution is more extended ranging between 80 – 193 K, with the warmest region to the western edge of extended UIB emission.
