2006 \SetConfTitleMassive Stars Argentina
LBVs and the nature of the S Dor cycles: the case of AG Carinae
Abstract
We present the results of a detailed spectroscopic analysis of 20 years of observations of AG Carinae using the radiative transfer code CMFGEN. Among the conclusions of this work, we highlight the importance of including time-dependent effects in the analysis of the full S Dor cycle. We obtained that the mass-loss rate is approximately constant during the cool-phases, implying that the S Dor-type eruptions begin well earlier than the maximum seen in the visual lightcurve. We also determined that the S Dor cycles are ultimately a consequence of an increase/decrease of the hydrostatic radius in combination with the formation of a pseudo-photosphere.
Stars: individual: AG Car \addkeywordStars: early-type \addkeywordStars: mass loss
0.1 AG Car in context
The massive star AG Carinae has been the most variable object among the Galactic luminous blue variables during the last 20 years. Dramatic photometric changes of 3 magnitudes in the band have been recorded, while the stellar spectra have indicated effective temperatures ranging from about 9kK to 25 kK. AG Car is a rare member of the LBV class that shows strong S Dor-type variations and is surrounded by a bipolar nebula.
This work is a result of a monitoring campaign spanning 20 years of observations of AG Car to obtain its stellar and wind parameters for each epoch. The first results were discussed in Groh et al. (2006), highlighting the first observational evidence of fast rotation in LBVs. The evolution of both stellar (effective temperature, radius, luminosity) and wind parameters (mass-loss rate and wind terminal velocity) along the S Dor cycle, and the correlations among them, provides significant insights about the physical processes going on during this short and unstable evolutionary stage.
0.2 Spectroscopic modeling
The physical parameters of AG Car were obtained through spectroscopic modeling using the radiative transfer code CMFGEN (Hillier & Miller 1998), which allows a simultaneous solution of the radiative transfer and rate equations. Spherical geometry and steady state are assumed to solve those equations, while clumping is included using a depth-variable filling factor. Fully-blanketed models were calculated for AG Car, taking into account the presence of over than 50,000 transitions of H, He, C, N, O, Si, P, Na, Mg, Fe, Mn, Co and Ni.
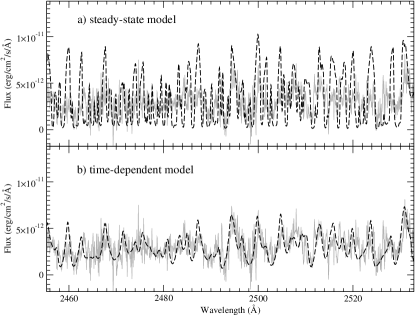
For the first time in the analysis of LBV winds, time-dependent effects were included consistently in the velocity law and density structure of the wind assuming that the mass-loss rate and wind terminal velocity change linearly as a function of time (J. H. Groh et al. 2007, in preparation). Significant differences can be seen in the fits obtained with a time-dependent model in comparison with a steady-state model, especially in the ultraviolet region (Fig. 1).
0.3 Results and conclusions
0.3.1 Comparison between the minimum epochs
The stellar and wind parameters are different during consecutive minima as derived from the analysis of spectra taken in 1985–1990 and 2001 (Table 1). During those epochs, a significant difference of K in is noticed. In addition, a remarkable difference is seen in (which is 2 times higher in 2001 than in 1985–1990) and (3 times lower in 2001). We interpret the changes in and as a consequence of the bistability of line-driven winds (Lamers et al. 1995). Indeed, there is a change in the iron ionization structure around the sonic point, as predicted by Vink & de Koter (2002). The dominant iron ionization stage below the sonic point (which is around 18 ) changes from Fe3+ in 1990 to Fe2+ in 2001.
5 Epoch () (K) () () 1985–1990 62 23,800 300 Apr 2001 69 20,500 105
0.3.2 The mass-loss rate evolution
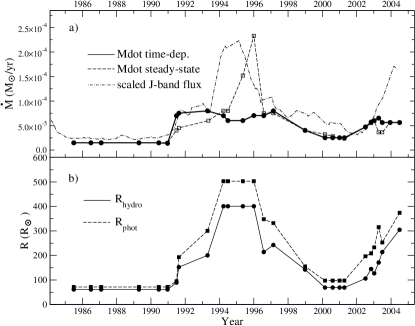
Figure 2 (panel ) shows the mass-loss rate evolution along the S Dor cycle obtained from steady-state and time-dependent models. As a result of the large flow timescale ( years) during the cool phases, significant differences are derived when time-dependent effects are taken into account. In special, is actually approximately constant during the cool phase (1991–1999), in comparison with a strong increase in around maximum when steady-state models are used. Thus, the results obtained from time-dependent modeling imply that the eruptions during the S Dor cycles begin well earlier than the maximum seen in the visual and near-infrared lightcurve. In addition, it is misleading the idea of an increase in as a consequence of the maximum – actually, the maximum in the lightcurve is a consequence of the increase in which occurred 2 or 3 years ago, in the beginning of the cool phase.
0.3.3 Changes in the photospheric and hydrostatic radius
The evolution of the photospheric and hydrostatic radius of AG Car during the S Dor cycle is presented in the panel of Figure 2. It is apparent to conclude that the S Dor-type variability is driven mainly by changes in the hydrostatic radius of the star. Changes in the photospheric radius do occur as a result of the dense wind and variable mass-loss rate, but this change solely is not sufficient to explain the strong temperature changes seen from minimum to maximum.
References
- (1) Hillier, D. J. & Miller, D. L. 1998, ApJ, 496, 407
- (2) Groh, J. H., Hillier, D. J., & Damineli, A. 2006, ApJ, 638, L33
- (3) Lamers, H. J. G. L. M. et al. 1995, ApJ, 455, 269
- (4) Vink, J., & de Koter, A. 2002, A&A, 393, 543