CBI limits on 31 GHz excess emission in southern Hii regions
Abstract
We have mapped four regions of the southern Galactic plane at 31 GHz with the Cosmic Background Imager. From the maps, we have extracted the flux densities for six of the brightest Hii regions in the southern sky and compared them with multi-frequency data from the literature. The fitted spectral index for each source was found to be close to the theoretical value expected for optically thin free-free emission, thus confirming that the majority of flux at 31 GHz is due to free-free emission from ionised gas with an electron temperature of K.
We also found that, for all six sources, the 31 GHz flux density was slightly higher than the predicted value from data in the literature. This excess emission could be due to spinning dust or another emission mechanism. Comparisons with m data indicate an average dust emissivity of K (MJy/sr)-1, or a 95 per cent confidence limit of K (MJy/sr)-1. This is lower than that found in diffuse clouds at high Galactic latitudes by a factor of . The most significant detection () was found in (RCW49) and may account for up to per cent of the total flux density observed at 31 GHz. Here, the dust emissivity of the excess emission is K (MJy/sr)-1 and is within the range observed at high Galactic latitudes.
Low level polarised emission was observed in all six sources with polarisation fractions in the range per cent. This is likely to be mainly due to instrumental leakage and is therefore upper an upper limit to the free-free polarisation. It corresponds to an upper limit of per cent for the polarisation of anomalous emission.
keywords:
Hii regions – radio continuum: ISM – ISM: clouds – radiation mechanisms: thermal1 INTRODUCTION
The characterisation of diffuse emission from the Galaxy is important for the detailed study of fluctuations in the cosmic microwave background (CMB). Knowledge of the spectral shape and spatial morphology is important for the accurate subtraction of the foreground emission. This in turn provides a more precise view of the CMB anisotropies thus providing the most reliable cosmological information. The frequency range of greatest interest for CMB observations is GHz, which is close to the minimum of foreground emission at GHz (Bennett et al. 2003b). The diffuse Galactic foregrounds include synchrotron, free-free and vibrational (thermal) dust emissions. However there is considerable evidence, from deep CMB data at high Galactic latitudes, for an additional component that emits in the frequency range GHz (Kogut et al. 1996; Leitch et al. 1997; de Oliveira-Costa et al. 2002,2004; Banday et al. 2003; Finkbeiner, Langston & Minter, 2004; Lagache 2003; Davies et al. 2006; Fernández-Cerezo et al. 2006). The data show a strong correlation with FIR (m) emission that suggests a connection to dust grains. The most popular candidate for this anomalous component is rapidly spinning small dust grains (Draine & Lazarian 1998a,b), referred to as spinning dust. Models of spinning dust emission predict a strongly peaked spectrum at GHz, which appears to be broadly consistent with the data. Furthermore, targetted observations of Galactic sources have shown excess emission in this frequency range (Finkbeiner et al. 2002,2004; Casassus et al. 2004,2006; Watson et al. 2005; Scaife et al. 2007).
At radio/microwave frequencies ( GHz), Hii regions are dominated by free-free (thermal bremsstrahlung) emission from ionised gas with electron temperatures, K. The spectrum of free-free radiation is well-understood; in the optically thin regime (GHz), it has a well-defined flux density spectral index***Throughout the paper, the flux density spectral index, , is defined as . that does not vary greatly with frequency or [Dickinson et al. 2003]. However, emission from spinning dust could be inherent since ion collisions with grains are expected to be the largest contributory factor in maintaining large rotational velocities required to produce significant rotational dust emission (Draine & Lazarian 1998b). Indeed, several detections are associated with Hii regions (Watson et al. 2005) or PNe (Casassus et al. 2004,2007). One previous tentative detection of spinning dust from the Hii region LPH96[201.663+1.643], which appeared to show a rising spectrum from GHz, suggestive of spinning dust (Finkbeiner et al. 2002; Finkbeiner 2004), was shown to be a spurious result with only little room for spinning dust (Dickinson et al. 2006; Scaife et al. 2007).
In this paper we have imaged several southern Hii regions with the Cosmic Background Imager (CBI) to look for excess emission at 31 GHz, which could be attributed to spinning dust. These are among the brightest Hii regions in the sky and are known to be dominated by free-free emission at radio frequencies up to GHz. Furthermore, they contain copious amounts of dust within the same volume, as traced by correlated FIR (m) emission. Using data from the literature, we model the spectrum of free-free radiation and compare the CBI data to measure or place limits on possible excess emission at 31 GHz. We also use CBI polarisation data to measure and place upper limits on the polarisation of free-free emission.
| Object/ | Centre R.A. | Centre Dec. | Integration∗ (hr)/ | Notes |
|---|---|---|---|---|
| Region | (J2000) | (J2000) | noise level (Jy) | |
| 1.25/ | Contains (RCW38) and fainter extended components | |||
| (RCW38) | 0.17 | to the north () and to the east (). | ||
| 0.43/ | Low level extension to the east. | |||
| (RCW49) | 0.14 | |||
| 2.28/ | Carina nebula (RCW53,NGC3372) covers a region degrees. | |||
| (Carina nebula) | 0.15 | 2 bright spots: Car-I & Car-II. | ||
| 1.15/ | Two distinct Hii regions: (NGC3603) & | |||
| (RCW57) | 0.18 | (NGC3576,RCW57) |
2 Data
2.1 The CBI interferometer
The CBI is a 13-element interferometer, located on the high altitude site (5080-m elevation) of Chajnantor Observatory, Chile. The 0.9-m diameter Cassegrain antennas are co-mounted on a 6-m platform which tracks the sky on a Alt-Az mount but at a constant parallactic angle through rotation of the “deck” platform. This gives a static -coverage for a given configuration and given “deck” angle. Using the best low-noise amplifiers provides a typical system temperature K in a 10 GHz band centred at 31-GHz. The bandwidth is split into 10 separate 1-GHz-wide bands from 26 to 36 GHz which can be used to provide spectral information. Each antenna can measure a single left (L) or right (R) circular polarisation mode therefore allowing observations in total intensity (LL or RR) or polarisation (LR or RL). Rotation of the deck allows the “filling” of the plane to improve beam quality in Stokes (total intensity) and combinations of LR or RL thus allowing mapping of Stokes and . We use the CBI in a compact configuration that gives optimal sensitivity to extended objects and many redundant baselines. Baseline lengths range from 1-m to 4-m, which corresponds to angular scales arcmin to arcmin and a primary beam FWHM of arcmin at 31 GHz.
2.2 Observations
Observations of several of the brightest southern Hii regions were made with the CBI in a compact configuration during the period April - July 2005. Here we present data for four regions: (RCW38), (RCW49), (Carina nebula) and (RCW57). These were chosen for their brightness, well-studied radio spectra and strong FIR emission that is aligned with the radio emission. Each region was observed for hours, at a range of deck angles to improve coverage. Only short observations were required since the images are limited by dynamic range due to beam deconvolution residuals and calibration errors, that will dominate over the thermal noise for the brightest sources. Longer integrations would not significantly improve the signal-to-noise ratio, except for allowing more deck rotations. A summary of the observations is given in Table 1. The noise level was estimated from areas of the map well outside the primary beam.
2.3 Data reduction
The data were reduced and calibrated using in-house software, cbical, originally written for CMB data analysis (see Readhead et al. 2004a,b and references therein for more details). The majority of data editing and flagging was done automatically, such as removing bad antennas, baselines or channels that were noisy or not working correctly.
Flux calibration was achieved by observations of bright calibrator sources (primarily Jupiter) tied to the temperature of Jupiter of at 32 GHz (Readhead et al. 2004a). This, in principle, gives an accuracy of 1.3 per cent. We note that short-term gain variations and elevation corrections have not been applied due to instabilities of the noise calibration diodes in the CBI system. Checks on the data, by comparing flux densities on different nights, showed these to be below the 1 per cent level.
Ground spillover is a source of relatively strong contamination at the level of Jy on the shortest baselines of the CBI. Due to the co-mounted design, filtering based on varying fringe rates of the astronomical signal (e.g. Watson et al. 2003) cannot be used. For CMB measurements, lead/trail fields or other strategies must be employed for subtraction of ground spillover (e.g. Pearson et al. 2003). Fortunately, for very bright objects ( Jy), the ground signal is essentially negligible. For the southern Galactic plane (longitudes ), lead/trail fields are difficult to observe since the plane is approximately parallel to lines of constant declination, thus we have not performed the ground subtraction technique. We find that the majority of the data are unaffected by such contamination, which would be highly visible on the shortest (1-m) baselines.
2.4 Imaging and fitting
Imaging of the visibility data was carried out using the difmap package employing uniform weights to give optimal resolution since we are mainly limited by dynamic range (typically 500:1 for the CBI) rather than thermal noise. The dirty images were deconvolved using the CLEAN algorithm [Högbom, 1974]. Primary beam corrections were applied to the CLEAN components directly so that each of the frequency channels were corrected separately with a Gaussian function of FWHM arcmin, which is a good approximation to the measured CBI primary beam (Pearson et al. 2003).
The incomplete coverage of interferometric data can potentially lead to loss of flux for sources that are extended relative to the synthesised beam; arcmin for these data. The exact amount of flux loss depends on the structure of the source and the coverage. To estimate the flux loss for CBI maps presented in this paper, we simulated observations based on m IRIS†††Throughout the paper we use the recently re-processed IRAS 100 m map of Miville-Deschênes & Lagache (2005), “IRIS”, which retains optimal resolution (4.3 arcmin) while removing the majority of artifacts such as striping. maps using the same CBI real visibilities to define the -coverage for each region. This is particularly important for complex extended structures. However, we found that the peak and integrated flux densities for the individual sources studied were within 5 per cent of the real values‡‡‡All fits were made using the aips task jmfit, which provides integrated flux densities and errors for the fitted parameters.. For example, , which is located in a region of extended emission, was reduced by just 3 per cent. On the other hand, the integrated flux density within a 30 arcmin radius was 58 per cent indicating that the extended emission is more strongly affected. This shows that for sources with angular diameters comparable to the synthesised beam, ( arcmin or smaller), the fitted flux densities are not significantly affected by the missing spatial frequencies and are correct to better than a few per cent. We therefore make no flux loss corrections for the relatively compact sources considered here. Such corrections would only increase the CBI 31 GHz flux densities quoted in Table 2.
To estimate a possible 31 GHz excess, data at lower frequencies were used to make a power-law fit of the form . We used data that were believed to be reliable and did not include very low frequencies ( GHz) where the free-free emission becomes optically thick and the spectrum no longer obeys a simple power-law. The best-fitting power-law was then used to estimate the flux density at 31 GHz, which was compared to the observed value from the CBI. Fitted flux densities include an error term due to the fitting procedure. However, we include an additional error of 2 per cent for instabilities in fitting Gaussians when choosing different box sizes. In general, we found the fits to be relatively stable to changes in box size. Experimentation with sensible choices of boxes showed that the integrated flux densities could vary by per cent. The errors quoted for the CBI fluxes therefore contain 3 components: an absolute calibration error (1.3 per cent), a variable fitting error, and an additional 2 per cent error. This results in a typical CBI flux density error of per cent.
3 Results
3.1 (RCW38)
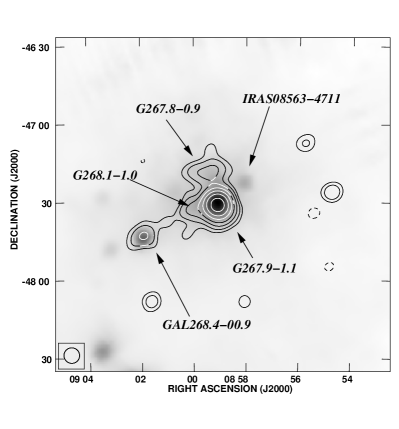

, (also known as RCW38, Kes5; RA(J2000), Dec.(J2000)) is one of the brightest and most dense Hii regions in the southern sky. The CBI 31 GHz primary-beam-corrected map is shown in Fig. 1 as contours overlaid on the IRAS 100 m map. The peak 31 GHz flux density is Jy beam-1 with a uniform-weighted synthesised beam FWHM of arcmin. The dominant central component is . It has a fainter companion, to the north and also to the east that can be seen as extensions to the much brighter central object§§§The name is sometimes used in the older literature and usually refers to the integrated emission from the entire region.. The morphology is very similar to the low frequency (0.4 and 5 GHz) maps of [Shaver & Goss 1970a, Goss & Shaver 1970].
The IRAS 100 m emission is similar to that seen in the radio (Fig. 1). A compact source arcmin to the north-west of is visible in the m image but is not seen in the CBI or other radio maps. It is likely to be the IR source IRAS08563-4711 and appears to be associated with the reflection nebula BRAN213. A relatively strong 100 m source is visible arcmin to the south-east of the RCW38 region and is also detected in the CBI map, but is significantly attenuated by the 45 arcmin FWHM primary beam. This is identified as the Hii region GAL268.4-00.9 (IRAS09002-4732).
Three Gaussian components were found to be a very good fit to the central region of the primary-beam-corrected image. However, previous data in the literature have been simply fitted with a single Gaussian (plus a baseline offset) to each source so we have tried to replicate this Gaussian fitting procedure to make a fairer comparison. This makes a difference of per cent in the integrated flux densities due to the overlapping Gaussian contributions of several closely spaced sources. The bright compact component () contains an integrated flux density, Jy with a deconvolved size of FWHM arcmin. The northern component () has Jy and is arcmin. A more extended Gaussian accounts for the eastern extension with Jy and is arcmin but this was not included when fitting for .
The spectrum of is plotted in Fig. 2. Data from the literature are plotted if they were believed to be reliable in relation to the fitting procedure used to determine the CBI flux densities. For example, the integrated flux densities from VLA data at 1.4 GHz could not be reliably summed due to significant flux losses which would not make a valid comparison. Similarly, the lower resolution WMAP data (Bennett et al. 2003a) is sensitive to local extended emissions. The data points are at 0.4 and 5 GHz [Shaver & Goss 1970b], 2.7 GHz [Day et al. 1972], 8.9 GHz [McGee et al. 1975], 14.7 GHz [McGee & Newton 1981], 90 and 150 GHz¶¶¶These data were verified to be the most up-to-date measurements at this frequency (P. Mauskopf; private communication). [Coble et al. 2003] and 300 GHz [Cheung et al. 1980]. The free-free emission is clearly optically thick at 408 MHz and turns over at GHz. Above 5 GHz, the emission appears to be optically thin and is best fitted by a power-law over the range GHz (omitting the CBI data point) with flux density spectral index, . This agrees well with the theoretical value of [Dickinson et al. 2003] for GHz and K [McGee et al. 1975, Caswell & Haynes 1987]. From visibility-visibility correlations with the Parkes 6 cm map [Haynes et al. 1978], we found a consistent value of . Within the CBI band ( GHz), the best-fitting index was , where the error was estimated assuming a 2 per cent error over the range GHz. All the data, including the CBI data point at 31 GHz, fit extremely well with this simple free-free model, with a predicted 31 GHz flux density Jy. Contributions from vibrational dust emission are only important above 200 GHz. The fitted values to observations are summarised in Table 2. The data give an upper limit to a possible excess component of 14.2 Jy at the 95 per cent confidence level (c.l.)∥∥∥Throughout the paper, upper limits are quoted at the 95 per cent confidence level (c.l.), which is .. When the spectral index was fixed at , the upper limit remained at Jy.
The FIR peak is well aligned in position with the peak in the radio. We used the IRAS m map to place limits on the relative dust emission. Assuming a dust emissivity of K (MJy/sr)-1 at 31 GHz, the CBI-simulated m map results in a peak flux density of 13.8 Jy beam-1 and an integrated flux density of 15.5 Jy. This corresponds to an upper limit on the dust emissivity of K (MJy/sr)-1; see Table 2.
| Source | Fitted | FWHM | Spectral index | Predicted | 31 GHz excess | Excess m emissivity |
|---|---|---|---|---|---|---|
| (Jy) | (arcmin) | (Jy) | (Jy) | [K (MJy/sr)-1] | ||
| Car-I | ||||||
| Car-II | ||||||
3.2 (RCW49)

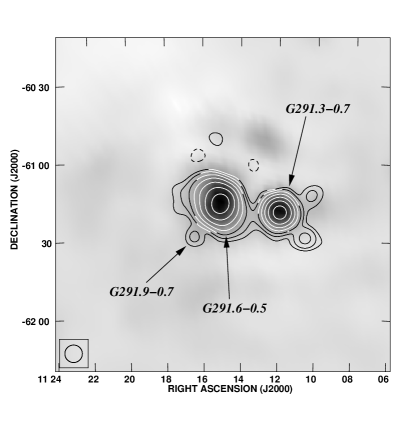
The bright HII region (RCW49, NGC3247, MSH10-54, Gum29; RA(J2000), Dec.(J2000) ) has a peak flux density of 79.6 Jy beam-1 in the 31 GHz CBI primary-beam-corrected map shown in Fig. 3. The synthesised beam has a FWHM of arcmin. There are low level extensions to the north and east that include the diffuse source . Wilson et al. (1970) note that the shoulder of emission to the east is probably not related to the brighter object. The CBI map agrees very well with the 5 GHz map [Goss & Shaver 1970] and the 100 m map (Fig. 3). A single Gaussian fit to the brightest object (not including the NE extension, but allowing for a curved baseline) gave an integrated flux density of Jy with a deconvolved size of arcmin. The eastern and northern extensions contain integrated flux densities of Jy and Jy, respectively. However, they have negligible effect ( per cent) on the fitting of the much brighter and compact component, . Stellar emission from massive O-type stars, such as those found in Westerlund 2 cluster, is negligible. The strongest emission is likely to come from colliding winds in Wolf-Rayet systems that is typically at the mJy level [Benaglia et al. 2005, Rauw et al. 2007].
The spectrum of is plotted in Fig. 4. Data points from the literature are as for where data are available, with the addition of 5.0 GHz [Caswell & Haynes 1987]. The 5 GHz value appears to be above the line of the other data points with Jy. We note that Caswell & Haynes (1987) find a flux density of 161 Jy at 5 GHz, but for a slightly smaller size of FWHM arcmin, that is more consistent with the fitted spectrum. We also performed a re-analysis of the Parkes 6 cm data [Haynes et al. 1978] and find Jy. Still, it is possible that the 14.7 GHz is a little low due to a smaller beam and smaller fitted area of arcmin. A power-law fit over the range GHz has a spectral index , and the CBI point is well above this line; the predicted 31 GHz flux density is Jy. As can be seen from the spectrum in Fig. 4, the CBI point appears to be significantly above the expected emission from optically thin free-free alone. For this model, the excess is Jy. This is a detection of excess emission at the level and could account for 32 per cent of the total emission at 31 GHz. The significance increases further when fixing the spectral index to the slightly flatter value of , which is more consistent with that expected from theory for K [Azcarate, 1992]. For this model, the excess is Jy (). Only when omitting the 14.7 GHz data point did the CBI point come in line with the model with a spectral index .
Using only the 2.7 GHz and 8.9 GHz data gave a spectral index of , consistent with the 408 MHz data point. In this case, there still remained a significant () excess at 31 GHz of Jy. The spectral index within the CBI band is . Cross-correlation of the simulated 5 GHz visibilities and CBI visibilities show a very tight correlation of with a mean slope of K K-1, which corresponds to . We therefore consider this a tentative detection of anomalous emission. Clearly, more precise data in the GHz range are required to determine the free-free spectrum more accurately and confirm this result.
The 100 m image is well-matched to the CBI image. A simulated observation, assuming a dust emissivity of K (MJy/sr)-1 gave a flux density of Jy; the error was estimated from trying different fitting boxes. The 31 GHz excess seen in therefore has a 100 m emissivity of K (MJy/sr)-1. For a fixed spectral index, , the emissivity becomes K (MJy/sr)-1.
3.3 (Carina nebula) region
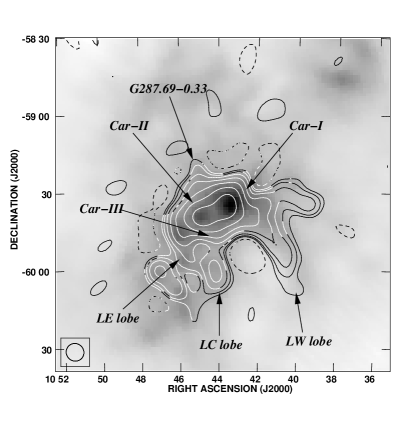


The Carina nebula (RCW53,NGC3372,MSH10-57,Gum 33, Keyhole nebula) consists of two main radio sources: Car-I (NW) () and Car-II (SE) (). These are excited by the young open clusters Tr14 and Tr16 [Tateyama et al. 1991] and are at a common distance of kpc. A number of weaker sources have been identified within the Carina nebula complex, which covers an area of 4 sq. degrees.
The CBI 31 GHz primary-beam-corrected map is shown in Fig. 5, with a synthesised beam arcmin and peak flux density, Jy beam-1. There is much extended emission in this region, particularly the several “lobes” that extend to the south, which are also seen at lower frequencies [Whiteoak, 1994, Duncan et al. 1995] and are thought to be non-thermal [Tateyama et al. 1991]. The non-thermal lobes (LE, LC and LW) of Tateyama et al. (1991) are clearly seen as extensions to the south of Car-I/Car-II in Fig. 5, including Car-III (southern lobe of Car-II). The source can be identified arcmin to the north of Car-II with a peak flux density of Jy. At this resolution, the brighter central region can just be resolved into the two known components, Car-I and Car-II, which are clearly seen in the 100 m map (Fig. 5).
Two Gaussians were fitted simultaneously to the central part of the primary-beam-corrected image with a baseline slope to account for the surrounding extended emission. We found that two Gaussians could be well-fitted to the data with Jy and Jy, for Car-I and Car-II, respectively (Table 2). The larger errors reflect the fact that the components are slightly confused at this resolution. Their deconvolved sizes were measured to be arcmin and arcmin, respectively.
The spectrum of Car-I is shown in Fig. 6. Data points from the literature are as for where data are available, with the addition of 1.4 GHz [Retallack, 1983], 8.9 GHz [Huchtmeier & Day 1975] and 22 GHz [Tateyama et al. 1991]. We re-analysed the Parkes 5 GHz map of Haynes et al. (1978) and found it to be consistent with the Goss & Shaver (1970) result. In Fig. 6 we include the 22 GHz flux density from Tateyama et al. (1991) by scaling their peak flux density with their reported source size, but do not include it in the fit due to possible errors in this extrapolation. It is interesting to see the 22 GHz data point is well above the free-free model. This could be real and is consistent with spinning dust models that predict a peak at this frequency (Draine & Lazarian 1998a,b). The spectrum lies close to the optically thin free-free value down to 408 MHz [Gardner et al. 1970]. The best-fitting power-law over the range GHz has a spectral index , consistent with that predicted by theory for K [Gardner et al. 1970, Caswell & Haynes 1987]. The best-fitting spectral index within the CBI band is . The model predicts a 31 GHz flux density Jy and the CBI 31 GHz data point fits well within this model with an upper limit for an excess of 24.8 Jy (95 per cent c.l.). For a fixed spectral index, , the predicted 31 GHz flux was Jy corresponding to an upper limit of Jy.
The CBI-simulated 100 m map, scaled with K (MJy/sr)-1 gives a flux density of Jy for a point-like source. This translates to an upper limit on the excess dust emissivity of K (MJy/sr)-1 at the 95 per cent c.l. For the fixed spectral index model, the emissivity is K (MJy/sr)-1.
The spectrum of Car-II is shown in Fig. 7 with the same data plotted as for Car-I, except for omitting the 8.9 GHz value from Huchtmeier & Day (1975), which appears to be anomalously low. This is probably due to a mismatch in fitted source size and proximity of Car-I. The free-free emission remains optically thin down to 408 MHz [Gardner et al. 1970] with a spectral index fitted over the range GHz, again close to the theoretical value. The predicted 31 GHz flux density is then Jy. The CBI data point lies slightly above the prediction with an upper limit of Jy (95 per cent c.l.) for excess emission. Although not a statistically strong detection, it is interesting to see that the 22 GHz value is also above the free-free model alongside the 31 GHz data point. For a fixed spectral index, , the predicted flux density is Jy, allowing an excess of Jy i.e. a detection.
The CBI-simulated 100 m map, scaled with K (MJy/sr)-1 gives a flux density of Jy for a point-like source. This translates to an upper limit on the excess dust emissivity of K (MJy/sr)-1. For the fixed spectral index model, the emissivity is at K (MJy/sr)-1, as summarised in Table 2.
3.4 (RCW57) region


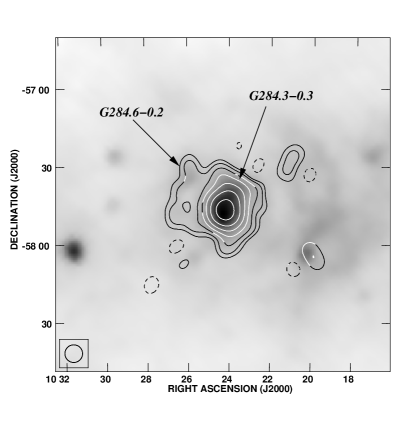
The RCW57 region is dominated by two bright Hii regions: (NGC3603) and (NGC3576), which are two of the highest luminosity optically visible Hii regions in the Galaxy [Goss & Radhakrishnan 1969]. The 31 GHz CBI map, with a synthesised beam FWHM of arcmin, is shown in Fig. 8. The two Hii regions dominate the map: is the larger eastern component at the center of the image (RA(J2000), Dec(J2000); is the more compact component located arcmin to the west. The CBI 31 GHz map shows NGC3603 as the brighter and slightly extended source with peak flux density Jy beam-1 and NGC3576 has Jy beam-1 after correcting for the primary beam. The 31 GHz map agrees very well with the low frequency GHz maps [Shaver & Goss 1970a, Goss & Shaver 1970] and the 100 m map (Fig. 8). Some low-level extended emission is also detected in the vicinity of the dominant Hii regions. A compact source to the south-east of NGC3603 is detected and is identified as with an integrated flux density of Jy.
Single Gaussians were fitted to the 2 bright sources in the CBI primary-beam-corrected map. For , we find an integrated flux density Jy with a deconvolved size arcmin. The spectrum is plotted in Fig. 9. Data points from the literature are as for where data are available, with the addition of 150 and 240 GHz data (Sabattini et al. 2005). The spectrum remains relatively flat up to a frequency of several GHz possibly indicating optically thick components. Nevertheless, we fitted a power-law to data in the range GHz and obtained . This model gave a predicted 31 GHz flux of or an upper limit to an excess component of Jy (95 per cent c.l.). For a fixed spectral index, , the prediction becomes Jy, or an excess of Jy i.e. a detection. The spectral index within the CBI band was found to be , consistent with a typical electron temperature of K [Wilson et al. 1970, McGee et al. 1975, McGee & Newton 1981, de Pree et al. 1999]. The two data points at 150 and 240 GHz (Sabattini et al. 2005) provide a useful limit to the contribution of vibrational (thermal) dust emission, where they find a dust temperature K. Unless there exists a very cold dust component, the contribution from vibrational dust at 31 GHz is relatively small. Extrapolating from the Sabattini et al. values, assuming an emissivity index , gives a flux density of 8.9 Jy, or 6 per cent of the total; this may explain the small excess observed and slightly flatter spectral index. Indeed, making a correction for the vibrational dust component, reduces the significance of the detection (for a fixed spectral index) to .
The CBI-simulated m, scaled with K (MJy/sr)-1 gives a peak brightness of 12.1 Jy beam-1 and an integrated flux density Jy. The 95 per cent c.l. upper limit on the excess dust emissivity is then K (MJy/sr)-1. For the fixed spectral index model, with no correction for a vibrational dust contribution, the emissivity is K (MJy/sr)-1, as summarised in Table 2.
For , we find Jy with a deconvolved size arcmin. The spectrum is plotted in Fig. 10 with data taken from the literature. The turn-over is much more gradual indicating optically thick components and only becomes truly optically thin above GHz. With so few data points to fit, we included the 14.7 GHz, 150 GHz and CBI 31 GHz data point itself in the fit. The best-fitting spectral index in the range GHz is and is an excellent fit to the data. The upper limit is 6.7 Jy (95 per cent c.l.) for an additional component. From the data at 240 and 300 GHz, there appears to be a small contribution from vibrational dust at 150 GHz, which was found to be typically warmer ( K) than for (Sabattini et al. 2005). This is somewhat discrepant with the values found by Kuiper et al. (1987) who find warmer dust temperatures, K, based on the m ratios. Extrapolating from the Sabattini et al. values, for , gives 1.6 Jy at 31 GHz ( per cent). This would steepen the spectral index further and therefore leave the possibility for a small excess at 31 GHz. However, we tried several different fits with varying assumptions (e.g. including lower frequency data), which did not allow a significant additional component at 31 GHz.
The CBI-simulated m, scaled with K (MJy/sr)-1 has a peak brightness of 5.5 Jy beam-1 and in integrated flux density Jy. The upper limit on the excess dust emissivity is then K (MJy/sr)-1 when the fit was done including the CBI data point. This will under-estimate any possible excess emission since including the CBI point reduces the allowable range. However, it is such a good fit to the model, the fit is unlikely to change by much. For a fixed spectral index, , the upper limit becomes 15.8 Jy (95 per cent c.l.), or a dust emissivity K (MJy/sr)-1. As with , the data points at 150 and 240 GHz (Sabattini et al. 2005) suggest there may be a contribution from vibrational dust emission at 31 GHz of a few Jy, or a few per cent of the total 31 GHz flux density and a much larger fraction at 150 GHz. Without more data points, and detailed modelling of the dust spectrum, it is difficult to calculate a more precise limit for this source. However, our upper limits can be considered as being conservative since these corrections are likely to steepen the free-free model allowing more room for excess emission. Nevertheless, it is clear from Fig. 10 that the CBI 31 GHz data point fits in well with the other data points following a smooth curve, leaving little or no room for possible excess emission.
3.5 Polarisation limits
Stokes and maps were made for each region and imaged/cleaned using the same procedure as for the total-intensity maps. Polarised intensity maps, , were made using the aips task comb, where is the correction for the Ricean noise bias, using estimates of the noise from areas of the map away from the primary beam. For all four regions, small polarised signals were detected. For both and , a ring-like structure was observed with a peak frequency centred close to the map centre. In the Carina nebula map, we observed two point-like peaks centred on Car-I and Car-II. For a similar faint ring-like feature is seen. The largest polarised signal, at 480 mJy beam-1 or 0.61 per cent polarisation fraction, was observed in ; a highly significant () detection is observed in both and maps. The peak polarised flux densities for all the Hii regions are given in Table 3 along with the polarised fraction calculated from the ratio of peak flux densities.
| Source | r.m.s. noise | Polarisation | |
|---|---|---|---|
| (mJy bm-1) | (mJy bm-1) | fraction (per cent) | |
| 348 | 75 | ||
| 190 | 25 | ||
| Car-I | 119 | 23 | |
| Car-II | 123 | 23 | |
| 204 | 35 | ||
| 480 | 35 |
Given the brightness in total intensity, the observed polarised signals are unlikely to be real since no corrections were made for instrumental leakage terms, which are expected to be at the per cent level. The observed polarisation is therefore consistent with polarisation generated by the instrument itself, which is discussed further in section 4.4.
4 Discussion
4.1 Free-free emission
| Source | Radio size | FIR size | |||
|---|---|---|---|---|---|
| GHz (arcmin) | m (arcmin) | (K) | () | (K) | |
| 45 | 7500 | ||||
| 50 | 8500 | ||||
| Car-I | 48 | 7000 | |||
| Car-II | 70 | 6600 | |||
| 55 | 7500 | ||||
| 45 | 7500 |
All the Hii regions discussed in this paper are dominated by thermal free-free emission, which becomes optically thin at frequencies GHz. These bright sources usually consist of many compact objects that are unresolved by the CBI beam, many of which contain substantial dust which emits primarily in the FIR band (m) within a similar volume (Table 4). At higher frequencies, the blackbody tail from the vibrating dust mechanism typically dominates and can extend down to frequencies GHz. These two emission mechanisms largely explain the general shape of the spectrum over a wide range of frequencies, from the radio to the mid-IR. Indeed, we have found that the 31 GHz flux observed with the CBI is broadly consistent with free-free emission when combined with multi-frequency data taken from the literature.
The original purpose of this study was to search for evidence of spinning dust, which would show up as an additional excess component at 31 GHz, which is close to the peak of current models of spinning dust (Draine & Lazarian 1998a,b). There are inconsistencies with some of the data in the literature, where calibration errors are typically 10 per cent on quoted flux densities. In addition to this, there can be difficulties when comparing data taken at different resolutions and where different fitting techniques have been employed. Fortunately, the spectrum of free-free emission is well understood. When the radiation becomes optically thin it has a well-defined spectral index that varies slowly with frequency and electron temperature. In fact, many authors simply fix the spectral index to the canonical radio spectral index, . At higher frequencies ( GHz), it steepens slightly to for K [Dickinson et al. 2003].
We have found that the best-fitting spectral index (Table 4), not including CBI data, for all Hii regions was essentially consistent with this range of values. The electron temperatures for all the Hii regions are within the range K (Table 4). Furthermore, the CBI 31 GHz data point, was found to be close to the predicted flux density from a simple power-law fit to data from the literature. This confirms the dominance of free-free emission in bright Hii regions. Fits were also made with a fixed spectral index, , which is the mean spectral index expected for free-free emission for the range GHz for K [Dickinson et al. 2003]. Although this artificially reduces the error in the model, it can help limit the impact of low or high data points that can artificially bias the spectral index, particularly when only a few data points are being fitted. For most sources, we found that the results remained stable either way.
4.2 Anomalous dust emission
We have found that at least one of the sources, (RCW49), shows evidence for a significant excess component, suggestive of spinning dust. Furthermore, it is compelling that all six sources are found to have a slightly higher flux density at 31 GHz than the predicted value given by a power-law model for the free-free emission. The average m dust emissivity for all the 6 sources is K (MJy/sr)-1, which corresponds to a 95 per cent upper limit of K (MJy/sr)-1. We have discussed some possible systematics that may lead to this apparent excess, but given the conservative error bars assigned to the data, and the relative accuracy of the CBI data, this result is unlikely to be due to a systematic error. Moreover, no flux loss correction was made to the CBI data points, since it was shown to be a small correction for sources comparable to the beam size (see section 2.4).
The most significant () result was for (RCW49). We consider this to be a tentative detection. As remarked upon in section 3.2, there is some level of inconsistency in the lower frequency data in the range GHz. In particular, the 5 GHz data point seems high relative to the other frequencies, yet we obtained a consistent value when we independently analysed the Parkes 6 cm map. Moreover, the 14 GHz point appears to be on the low side, while the 9 GHz value has a larger error than its neighbours. For example, taking just the 5 GHz data and the 31 GHz data alone, the spectral index is significantly flatter and is more consistent with free-free alone. Clearly more precise data in the range GHz data is required to clarify the situation.
If spinning dust emission is found to be a significant fraction of the 31 GHz flux emission, it would be expected to originate from very small grains that can spin fast enough to produce observable emission. The smallest grains, polycyclic aromatic hydrocarbons (PAHs) are one possibility. PAHs are most readily identified as broad lines in the mid-IR spectrum that have been seen in many Hii regions and PNe. The observed survival of small dust grains in hostile environments is difficult to reconcile with models [Spitzer, 1978], yet strong mid-IR PAH signals are observed in active star-forming regions including RCW49 [Churchwell et al. 2004]. The spinning dust mechanism appears therefore to be still viable in such environments. It is rather surprising that the spectral index at GHz is so similar to the canonical free-free value (). However, the spinning dust spectrum is expected to turn over in the range GHz and hence it may appear to be locally flat in this range.
4.3 Anomalous dust emissivity
The radio emission from dust in HII regions is found to be a factor of 3-4 less than in the cooler diffuse dust at intermediate latitudes. The limits on excess emission at 31 GHz have been converted to a dust emissivity, relative to the IRIS re-processed version of the IRAS m map [Miville-Deschênes & Lagache 2005], which has units MJy sr-1, thus our emissivities have units K (MJy/sr)-1. We did this for simplicity and because it is model independent******Some authors have calculated dust emissivities relative other standards, including the DIRBE m map, the Finkbeiner, Davis & Schlegel (1999) model 8 map normalised at 94 GHz, or the hydrogen column density, , estimated from the m map of Schlegel, Finkbeiner & Davis (1998); see Finkbeiner (2004) for a useful discussion of units.. From CMB data at frequencies GHz, and at high Galactic latitudes, the dust emissivity has a typical value of K (MJy/sr)-1, with variations of about a factor of [Davies et al. 2006]. We can immediately see that our tentative detection, in , is consistent with the dust emissivity found at high latitude. On the other hand, the upper limits listed in Table 2 indicate that the dust emissivity is considerably lower than that found at high latitudes; the average emissivity for all 6 Hii regions (when the spectral index was fitted for) is K (MJy/sr)-1. In other words, if the spinning dust were to emit at the same levels as seen at in more quiescent high latitude regions of sky (at least relative to the m intensity map), we would have detected a larger excess in most of the sources studied here.
In Table 5, we have listed the 31 GHz normalised dust emissivities for Hii regions and the cooler dust clouds from the literature. This emphasises that the dust emissivity appears to be less in the Hii regions than in the diffuse interstellar medium by a factor of , but where the average dust temperature is K (Schlegel et al. 1998). It is also clear that the scaling of emissivity at high latitudes, found by Davies et al. (2006), does not hold in these regions; the warmer dust does not emit at higher levels relative to m data. This is presumably due to the different conditions in the interstellar medium, where in Hii regions there is a considerably larger flux of -photons from O-B stars that formed the ionised regions, which in turn disassociates the smaller grains required for current models of spinning dust emission.
Hii regions exhibit a wide range of environmental conditions (UV radiation field, X-rays, -rays, electron temperatures) which affect the distribution of grain sizes and properties. The emissivity of spinning dust could then vary considerably from cloud to cloud [Davies et al. 2006]. This could explain the apparent lack of anomalous emission from some regions but not others. It is also possible that some other mechanism is responsible for the bulk of the anomalous signal, including magneto-dipole emission [Draine & Lazarian 1999], which strongly depends on the abundance of ferromagnetic material.
| Source | Dust emissivity | Reference |
| K (MJy/sr)-1 | ||
| Hii regions | ||
| 6 Hii regions (mean) | This paper. | |
| LPH96 | Dickinson et al. (2006) | |
| Cool dust clouds | ||
| 15 regions WMAP | Davies et al. (2006) | |
| All-sky WMAP | Davies et al. (2006) | |
| LDN1622 | Casassus et al. (2006) | |
| Watson et al. (2005) |
4.4 Polarisation limits
The CBI polarisation maps all showed some polarised emission for these sources, but at a very low level of 0.3 per cent, except for , which was at 0.6 per cent. This may be due to the fact that is located away from the map centre by almost half a primary beam width. This could contribute extra leakage and/or errors due to the primary beam correction. We therefore take these values to be upper limits to the polarisation on these angular scales. This is consistent with little or no polarisation, as expected for pure free-free emission.
Free-free emission is intrinsically unpolarised, but can be polarised at the edges of Hii regions by Thomson scattering. The radiation is then tangentially polarised to the edges of the cloud, at a level that depends on the viewing angle relative to the incident radiation [Rybicki & Lightman 1979]. At these angular resolutions, we did not expect to see this effect since the sources are barely resolved in the CBI beam thus any secondary scattering will be averaged out by the beam. Spinning dust emission is expected to be weakly polarised at the few per cent level [Lazarian & Finkbeiner 2003]. However, we did expect some level of instrumental leakage, which converts Stokes to Stokes and , at the level of per cent based on earlier observations of W44 [Cartwright et al. 2005]. We have not attempted to correct for leakage terms and hence it is not surprising to see such levels of polarisation. This naturally explains the remarkably similar polarisation fractions observed in the different Hii regions. We therefore consider the quoted polarisation fractions (Table 3) to be upper limits. The level of the leakage shown here is encouraging since the recent CBI polarisation results [Readhead et al. 2004b, Sievers et al. 2007] had no corrections made for instrumental leakage. Given the signal-to-noise ratio of the CMB polarisation detections, this level of leakage can be safely ignored, and we can be sure that the contamination is certainly below the 1 per cent level.
For the most significant detection of excess emission in , the polarisation limit translates to an upper limit on the spinning dust polarisation. If indeed 30 per cent of the 31 GHz emission in is anomalous (e.g. from spinning dust), then the effective upper limit to the polarisation fraction of this component is per cent. This is lower than that observed in the Perseus cloud, , which was observed to have a polarisation fraction of per cent [Battistelli et al. 2006]. Such low levels of polarisation are consistent with electro-dipole emission from spinning grains. The slight discrepancy in polarisation level may be attributed to varying levels of ferromagnetic material, which through magneto-dipole emission can be much more highly polarised [Draine & Lazarian 1999].
5 Conclusions
Observations of 6 bright Hii regions suggest a small amount of excess emission at 31 GHz, based on fitting a free-free model from data in the literature. The dominant source of emission comes from optically thin free-free emission with a spectral index . But we find that all the sources were slightly brighter at 31 GHz relative to the simple free-free model. The average m dust emissivity for the 6 Hii regions was found to be K (MJy/sr)-1, or a 95 per cent confidence limit of K (MJy/sr)-1. This is lower by a factor of compared to cooler diffuse clouds at high Galactic latitudes (Table 5). However, only one source, (RCW49), was found to be statistically significant with a m dust emissivity of K (MJy/sr)-1 (). For this source, there are several caveats in interpreting and using data from the literature, which could reduce the significance of this result. New data in the range GHz, particularly from well-calibrated instruments, are required to clarify whether our tentative detection holds. The dust emissivity, relative to the m map, for this object is consistent with that found in diffuse clouds at high Galactic latitudes (Table 5). For the majority of the other sources, only upper limits could be obtained which appear to show that the dust emissivity is in fact lower than that observed at high Galactic latitudes.
We observed very low level ( per cent) polarisation at 31 GHz from all the Hii regions studied here. The level is consistent with that expected from instrumental leakage in the CBI instrument. This validates claims that the instrumental leakage is negligible ( per cent) for recent detections of CMB polarisation with the CBI.
ACKNOWLEDGMENTS
CD thanks Barbara and Stanley Rawn Jr. for funding a fellowship at the California Institute of Technology for part of this work. We thank the staff and engineers at the Chajnantor observatory for their hard work and continuing support. In particular, we thank Cristobal Achermann, Ricardo Bustos, Rodrigo Reeves and Nolberto Oyarace. SC aknowledges support from FONDECYT grant 1060827. SC and LB acknowledge support from the Chilean Center for Astrophysics FONDAP 15010003. Part of the research described in this paper was carried out at the Jet Propulsion Laboratory, California Institute of Technology, under a contract with the National Aeronautics and Space Administration.
References
- [Azcarate, 1992] Azcarate, I. N., 1992, Ap&SS, 194, 225
- [Battistelli et al. 2006] Battistelli, E. S., Rebolo, R., Rubiño-Martín, J. A., Hildebrandt, S. R., Watson, R. A., Gutiérrez, C., Hoyland, R. J., 2006, ApJ, 645, L141
- [] Banday, A.J., Dickinson, C., Davies, R.D., Davis, R.J., Górski, K.M., 2003, MNRAS, 345, 897
- [Benaglia et al. 2005] Benaglia, P., Romero, G. E., Koribalski, B., Pollock, A. M. T., 2005, A&A, 440, 743
- [] Bennett, C.L. et al., 2003a, ApJS, 148, 1
- [] Bennett, C.L. et al., 2003b, ApJS, 148, 97
- [Cartwright et al. 2005] Cartwright, J. K., Pearson, T. J., Readhead, A. C. S., Shepherd, M. C., Sievers, J. L., Taylor, G. B., 2005, ApJ, 623, 11
- [Casassus et al. 2004] Casassus, S., Readhead, A. C. S., Pearson, T. J., Nyman, L.-Å., Shepherd, M. C., Bronfman, L., 2004, ApJ, 603, 599
- [Casassus et al. 2006] Casassus, S., Cabrera, G. F., Förster, F., Pearson, T. J., Readhead, A. C. S., Dickinson, C., 2006, ApJ, 639, 951
- [] Casassus, S., et al., 2007, MNRAS, in prep.
- [Caswell & Haynes 1987] Caswell, J. L., Haynes, R. F., 1987, A&A, 171, 261
- [Cheung et al. 1980] Cheung, L. H., Frogel, J. A., Hauser, M. G., Gezari, D. Y., 1980, ApJ, 240, 74
- [Churchwell et al. 2004] Churchwell, E., et al., 2004, ApJS, 154, 322
- [Coble et al. 2003] Coble, K., et al., 2003, preprint (astro-ph/0301599)
- [] de Oliveira-Costa, A. et al., 2002, ApJ, 567, 363
- [] de Oliveira-Costa, A., Tegmark, M., Davies, R. D., Gutiérrez, C. M., Lasenby, A. N., Rebolo, R., Watson, R. A., 2004, ApJ, 606, L89
- [de Pree et al. 1999] de Pree, C. G., Nysewander, M. C., Goss, W. M., 1999, AJ, 117, 2902
- [Davies et al. 2006] Davies, R. D., Dickinson, C., Banday, A. J., Jaffe, T. R., Górski, K. M., Davis, R. J., 2006, MNRAS, 370, 1125
- [Day et al. 1972] Day, G. A., Caswell, J. L., Cooke, D. J., 1972, Australian Journal of Physics Astrophysical Supplement, 25, 1
- [Dickinson et al. 2003] Dickinson, C., Davies, R. D., Davis, R. J., 2003, MNRAS, 341, 369
- [Dickinson et al. 2006] Dickinson, C., Casassus, S., Pineda, J. L., Pearson, T. J., Readhead, A. C. S., Davies, R. D., 2006, ApJ, 643, L111
- [] Draine, B. T., Lazarian, A., 1998a, ApJ, 494, L19
- [] Draine, B. T., Lazarian, A., 1998b, ApJ, 508, 157
- [Draine & Lazarian 1999] Draine, B. T., Lazarian, A., 1999, ApJ, 512, 740
- [Duncan et al. 1995] Duncan, A. R., Stewart, R. T., Haynes, R. F., Jones, K. L., 1995, MNRAS, 277, 36
- [Fernández-Cerezo et al. 2006] Fernández-Cerezo, S., et al., 2006, MNRAS, 370, 15
- [] Finkbeiner, D. P., Davis, M., Schlegel, D.J., 1999, ApJ, 524, 867
- [] Finkbeiner, D. P., Schlegel, D. J., Curtis, F., Heiles, C., 2002, ApJ, 566, 898
- [Finkbeiner, 2004] Finkbeiner, D. P., 2004, ApJ, 614, 186
- [] Finkbeiner, D. P., Langston, G. I., Minter, A. H., 2004, ApJ, 617, 350
- [Gardner et al. 1970] Gardner, F. F., Milne, D. K., Metzger, P. G., Wilson, T. L., 1970, A&A, 7, 349
- [Goss & Radhakrishnan 1969] Goss, W. M., Radhakrishnan, V., 1969, ApJ, 4, 199
- [Goss & Shaver 1970] Goss, W. M., Shaver, P. A., 1970, Australian Journal of Physics Astrophysical Supplement, 14, 1
- [Haynes et al. 1978] Haynes, R. F., Caswell, J. L., Simons, L. W. J., 1978, Australian Journal of Physics Astrophysical Supplement, 45, 1
- [Högbom, 1974] Högbom, J. A., 1974, A&AS, 15, 417
- [Huchtmeier & Day 1975] Huchtmeier, W. K., Day, G. A., 1975, A&A, 41, 153
- [Kogut et al. 1996] Kogut, A., Banday, A. J., Bennett, C. L., Gorski, K. M., Hinshaw, G., Smoot, G. F., Wright, E. I., 1996, ApJ, 464, L5
- [Kuiper et al. 1987] Kuiper, T. B. H., Whiteoak, J. B., Fowler, J. W., Rice, W. 1987, MNRAS, 227, 1013
- [] Lagache, G., 2003, A&A, 405, 813
- [Lazarian & Finkbeiner 2003] Lazarian, A., & Finkbeiner, D., 2003, New Astronomy Review, 47, 1107
- [] Leitch, E. M., Readhead, A. C. S., Pearson, T. J., Myers, S. T., 1997, ApJ, 486, L23
- [McGee et al. 1975] McGee, R. X., Newton, L. M., Batchelor, R. A., 1975, Australian Journal of Physics, 28, 185
- [McGee & Newton 1981] McGee, R. X., Newton, L. M., 1981, MNRAS, 196, 889
- [Miville-Deschênes & Lagache 2005] Miville-Deschênes, M.-A., Lagache, G., 2005, ApJS, 157, 302
- [Pearson et al. 2003] Pearson, T. J., et al., 2003, ApJ, 591, 556
- [Rauw et al. 2007] Rauw, G., Manfroid, J., Gosset, E., Nazé, Y., Sana, H., De Becker, M., Foellmi, C., Moffat, A. F. J., 2007, A&A, 463, 981
- [Readhead et al. 2004a)] Readhead, A. C. S., et al., 2004a, ApJ, 609, 498
- [Readhead et al. 2004b] Readhead, A. C. S., et al., 2004b, Science, 306, 836
- [Retallack, 1983] Retallack, D. S., 1983, MNRAS, 204, 669
- [Rybicki & Lightman 1979] Rybicki, G. B., Lightman, A. P., 1979, Radiative Processes in Astrophysics, Wiley & Sons, New York
- [] Sabbatini, L. et al., 2005, A&A, 439, 595
- [] Scaife, A., et al., 2007, MNRAS, 377, L69
- [] Schlegel, D. J., Finkbeiner, D. P., Davis, M., 1998, ApJ, 500, 525
- [Shaver & Goss 1970a] Shaver, P. A., Goss, W. M., 1970a, Australian Journal of Physics Astrophysical Supplement, 14, 77
- [Shaver & Goss 1970b] Shaver, P. A., Goss, W. M., 1970b, Australian Journal of Physics Astrophysical Supplement, 14, 133
- [Sievers et al. 2007] Sievers, J. L., et al., 2007, ApJ, 660, 976
- [Spitzer, 1978] Spitzer, L., 1978, Physical Processes in the Interstellar Medium, New York Wiley-Interscience
- [Tateyama et al. 1991] Tateyama, C. E., Kaufmann, P., Strauss, F. M., 1991, MNRAS, 249, 716
- [Watson et al. 2003] Watson, R. A., et al., 2003, MNRAS, 341, 1057
- [] Watson, R.A., Rebolo, R., Rubiño-Martin, J.A., Hildebrandt, S., Gutièrrez C.M., Fernàndez-Cerezo S., Hoyland, R.J., Battistelli, E.S., 2005, ApJ, 624, L89
- [Wilson et al. 1970] Wilson, T. L., Mezger, P. G., Gardner, F. F., Milne, D. K., 1970, A&A, 6, 364
- [Whiteoak, 1994] Whiteoak, J. B. Z., 1994, ApJ, 429, 225