Long-Term Profile Variability of Double Peaked Emission Lines
in Active Galactic Nuclei
Abstract
We present up to two decades of spectroscopic monitoring of the double-peaked broad H emission lines of seven broad-line radio galaxies. These extremely broad, double-peaked lines are successfully modeled by emission from gas in the outer accretion disk, and their profiles vary on timescales of months to years. This variability is a valuable probe for understanding the structure and dynamics of the accretion disk. We characterize the long-term broad-line profile variability in detail, and compare the evolution of the line profiles with predictions from a few simple physical models for dynamical processes in the accretion disk. We find no evidence for persistent, periodic variability that would be indicative of a precessing elliptical disk, or a circular disk with a long-lived, single-armed spiral or warp. We do find transient, periodic variability on the orbital timescale, possibly resulting from shocks induced by tidal perturbations, and variability in the wings of the profile which suggests changes in the emissivity of the inner accretion flow. Dramatic but localized profile changes are observed during flares and high-states of broad-line flux. In 3C 332, these changes can be explained by a slow, smooth, secular change in disk illumination. In Arp 102B and 3C 390.3, however, a simple disk model cannot explain the asymmetric profile changes, suggesting a need for more sophisticated models. We also observe sharp, transient features that appear in the blue peak of the objects, which require a well-organized velocity field.
Subject headings:
accretion, accretion disks – galaxies: active – line: profiles1. Introduction
In the standard model for active galactic nuclei (AGNs), the central engine is powered by an accretion disk feeding a supermassive black hole. The first direct dynamical evidence for the presence of the nuclear accretion disk assumed to be powering AGNs emerged in a class of broad emission-line AGNs, known as “double-peaked emitters,” with extremely broad (FWHM = 10,000–20,000 km s-1) double-peaked Balmer emission lines (Eracleous & Halpern 1994) with line profiles reminiscent of the double-peaked lines known to originate in the accretion disks of cataclysmic variable stars (e.g., Horne & Marsh 1986). The detailed shape of the “disk-like” line profiles are well fitted by emission from photoionized gas in a circular or elliptical accretion disk around a central black hole (Chen et al. 1989; Chen & Halpern 1989; Eracleous et al. 1995). Ultraviolet spectroscopy of several double-peaked emitters obtained with HST (Halpern et al. 1996; Eracleous et al. 2004) revealed that the Mg II 2800 line also has a double-peaked profile similar to the optical H and H line profiles and appears to share the same origin as the Balmer lines, namely, a photoionized accretion disk. In 1/3 of the objects, the Ly line is weak and narrow, which is a prediction of the photoionized accretion disk model (Dumont & Collin-Souffrin 1990a,b,c; Rokaki et al. 1992). In the disk model, Ly photons in the dense inner regions of the accretion disk are trapped by scattering and destroyed by collisional de-excitation, resulting in a suppressed emissivity of Ly in the inner disk where the rotational velocity of the gas is highest. In 2/3 of the objects, the higher-ionization UV lines and Ly are strong, with broad, single-peaked profiles, which is a prediction of the accretion disk + wind model, in which a highly ionized radiatively accelerated accretion disk wind produces broad, single-peaked profiles with logarithmic wings (Murray & Chiang 1997).
Alternative models have been proposed for the origin of the double-peaked line emission, including: a bipolar outflow, binary black holes with separate broad line regions, an anisotropically illuminated spherical distribution of clouds, and bloated stars with cometary tails. These models have been progressively ruled out by inconsistencies with observational results and by basic physical arguments. Eracleous et al. (1997) were able to reject the binary supermassive black holes scenario favored by Gaskell (1983, 1996) for three double-peaked emitters (Arp 102B, 3C 390.3, 3C 332), based on long-term monitoring of their broad double-peaked Balmer lines (see also Halpern & Filippenko 1988). For 20 yr their line profiles showed no evidence for the systematic drift of the radial velocity of the peaks expected for a binary system. The stationary peaks also rule out the possibility that the broad peaks are associated with individual clouds or bloated stars, since the peaks would then move on the dynamical timescale of the broad line region, which is not observed. A collection of clouds on random orbits (Goad & Wanders 1996) is not physically plausible since the collisional timescale between clouds is on the order of a few dynamical times of the broad line region, not allowing the configuration of clouds to last long enough to produce the persistent double-peaked emission. In at least one double-peaked emitter, 3C 390.3, a bipolar outflow has been definitively ruled out by reverberation mapping, which showed no time lag between the response of the wings of the light-echo of the broad H, H line profiles, as well as the broad Ly and UV C IV line profiles, which would be indicative of a radial outflow (Dietrich et al. 1998; O’Brien et al. 1998; Shapavalova et al. 2001; Sergeev et al. 2002).
1.1. Demography of Double-Peaked Emitters
The first double-peaked emission line was discovered in the H profile of the broad-line radio galaxy (BLRG) 3C 390.3 (Lynds 1968; Burbidge & Burbidge 1971; Osterbrock, Koski, & Phillips 1975), and its large width and distinct red and blue peaks were attributed to motion in an accretion disk (Oke 1987; Perez et al. 1988). Subsequent discoveries of double-peaked H lines in the BLRGs Arp 102B and 3C 332 had profiles that were successfully modeled as emission from photoionized gas in the outer regions of a circular relativistic Keplerian accretion disk around a central black hole (Chen et al. 1989, Chen & Halpern 1989; Halpern 1990). Motivated by the fact that at that time the three known double-peaked emitters were hosted by BLRGs, Eracleous & Halpern (1994, 2003) conducted a spectroscopic survey of moderate redshift () radio-loud AGN, and discovered 21 new double-peaked broad emission lines (20% of the sample), of which 13 of the profiles could be fitted with a simple circular disk model. Careful starlight subtraction of ground-based spectra, and narrow-slit HST spectroscopy have revealed the presence of double-peaked emission lines in a large fraction of nearby low-ionization nuclear emission line regions (LINERs), the most common type of AGN, including NGC 1097, (Storchi-Bergmann et al. 1993), M 81 (Bower et al. 1996), NGC 4203 (Shields et al. 2000), NGC 4450 (Ho et al. 2000), and NGC 4579 (Barth et al. 2001). The Sloan Digital Sky Survey (SDSS; York 2000) spectroscopic AGN sample ( 0.332) detected 116 additional double-peaked emitters which made up 4% of the entire sample. Of these, 76% are radio-quiet, 12% are classified as LINERs, 40% fall in the parameter space of a circular accretion disk profile, and 60% require some form of asymmetry in the disk (Strateva et al. 2003).
1.2. Accretion Disk Model
The circular relativistic Keplerian accretion disk model from Chen & Halpern (1989) is described by the following parameters: , the inclination of the disk; and , the inner and outer radii of the line-emitting portion of the disk in units of gravitational radii (); , the emissivity power-law index (); and , the local broadening in km s-1 . The local broadening parameter is added to smooth out the peaks of the profile, which otherwise would be cuspy due to the sharp inner and outer boundary to the line-emitting region (see Chen et al. 1989). Another version of the disk model uses a continuous emissivity power law with a break radius, instead of local broadening, to match the smooth peaks of the profile. In this model, there is no outer boundary to the line-emitting region, but simply a characteristic break radius at which the slope of the power-law changes. The emissivity power-law index depends on the geometry of the continuum source. At radii much larger than the size of the continuum source, the flux illuminating the disk drops off as , and thus the emissivity, which is proportional to the illuminating flux (Collin-Souffrin & Dumont 1989), also has a power-law index, , equal to 3 (Chen & Halpern 1989). In the disk model, double-peaked emission lines will arise in the extreme case in which the line-emitting portion of the disk, , is relatively small (i.e., a ring), resulting in displaced broad peaks with a signature blueshifted peak higher than the redshifted peak due to Doppler boosting, and a gravitational redshift of the wings of the line. The disk model produces an excellent fit to the peaks and wings of the broad H and H lines, but there is often a central broad emission-line component at lower velocities that is not accounted for by the disk model. This excess emission may originate from the “standard” BLR associated with the more common single-peaked broad emission lines. Eracleous et al. (1995) adapted the circular accretion disk model to elliptical disks in order to fit the profiles of double-peaked emitters with a red peak stronger than the blue peak (not possible in a circular disk, in which the blue peak is always Doppler boosted to be stronger than the red peak). This model introduces eccentricity and phase angle parameters to the circular model described above, and then refers to the pericenter distance of the elliptical orbits.
The symmetric, and often logarithmic, profiles of broad single-peaked optical and UV emission lines in standard broad-line AGNs can be reproduced with many velocity fields and geometric configurations of the broad-line region (BLR), including both rotational and radial motion (see review by Mathews & Capriotti 1985). Because of this degeneracy, the kinematics and structure of the BLR remains enigmatic. Disks are a promising candidate for the BLR structure (Shields 1977), and they are also invoked to explain many other properties of AGNs. Reverberation experiments (see review by Peterson 2001) measure the light-crossing time of the BLR in nearby Seyfert 1 galaxies as 1–2 lt-weeks (e.g.,Maoz et al. 1990,1991; Netzer 1990), approximately the size expected for an accretion disk around a supermassive black hole. A photoionized accretion disk can produce “standard” single-peaked broad emission lines if either the disk is large (Rokaki et al. 1992; Jackson, Penston, & Perez 1991), is oriented face-on (Corbin 1997), or emits a wind (Murray & Chiang 1997). Given the frequency of “disk-like” emitters discovered in nearby galaxies, broad emission lines originating from the nuclear accretion disk may be a universal phenomenon in AGNs.
1.3. Testing Models with Long-Term Profile Variability
Spectroscopic monitoring of double-peaked emitters has revealed that a ubiquitous property of the double-peaked broad emission lines is variability of the profile shape on the timescale of months to years (Miller & Peterson 1990; Romano et al. 1998). This slow, systematic variability of the line profile is on the timescale of dynamical changes in an accretion disk, and has been shown to be unrelated to the shorter timescale variability ( days) seen in the overall flux in the line, due to reverberation of the variable ionizing continuum. Patterns in the variability of the broad Balmer lines are often a gradual change and reversal of the relative strengths of the blueshifted and redshifted peaks. Newman et al. (1997) successfully modeled the periodic oscillation in the relative heights of the blue and red peaks of the broad line in Arp 102B over 4 yr as an inhomogeneity, or bright spot, orbiting within the line-emitting accretion disk. From the orbital period of the bright spot (2.2 yr) and its velocity, they were able to solve for the mass of the black hole from the orbital radius of the spot (1.5 x 1016 cm) and the inclination angle determined from the profile fit. This yielded a central black hole mass of 2.2 x 10⁸ .
Periodic variability of the red and blue peak strengths has also been attributed to a precessing elliptical disk (NGC 1097: Storchi-Bergmann et al. 1995, 1997) a precessing single-armed spiral (3C 332, 3C 390.3: Gilbert et al. 1999; NGC 1097: Storchi-Bergmann et al. 2003), and a precessing warp in the disk. Elliptical disks and spiral waves have been detected in the accretion disks of cataclysmic variables (Steeghs, Harlaftis, & Horne 1997; Baptista & Catalan 2000), and a radiation induced warp has been detected in the large-scale disk of the AGN NGC 4258 (Maloney, Begelman, & Pringle 1996). Asymmetries in an AGN accretion disk, such as eccentricity, a spiral arm, or a warp, will be induced by the tidal effects of a binary companion in orbit around the primary black hole, or by the close passage of a massive star cluster (Chakrabarti & Wiita 1993, 1994). If the disk is self-gravitating, a spiral wave can emerge from a growing density perturbation, as is observed in the massive disks of young stellar objects (Adams, Ruden, & Shu 1989; Laughlin & Korchagin 1996). Elliptical disks have also been proposed to be a natural consequence of the tidal disruption of a star by a supermassive black hole, when the tidal disruption debris settles into bound eccentric orbits around the central black hole (e.g., Rees 1988; Syer & Clarke 1992). The tidal disruption event scenario is a favored interpretation of the dramatic, sudden appearance of double-peaked emission lines in several LINERs (NGC 1097, M 81) and the BLRG Pictor A (Halpern & Eracleous 1994; Sulentic et al. 1995). Storchi-Bergmann et al. (2003) successfully fitted the detailed variability of NGC 1097 with a logarithmic one-armed spiral with a pattern period physically consistent with the central black hole mass estimated from the - relation. Spiral waves are a physically desirable model. They can play an important role in accretion disks, because they provide a mechanism for transporting angular momentum outward in the disk, allowing the gas to flow inwards towards the central black hole.
Long-term profile variability is thus a useful tool for extracting information about the structure and dynamics of the accretion disk most likely producing the double-peaked emission lines. In this paper, we present up to two decade’s worth of spectroscopic observations of a sample of double-peaked emitters with the goal of testing the robustness of the accretion disk model, and models for physical processes in the accretion disk as well as alternative models outside the disk paradigm, by directly comparing the observed evolution of the line profiles with the model predictions. Confirming or ruling out any of these models brings significant progress in developing a model for the origin and motion of the broad-line gas in the “special case” of double-peaked emitters, as well as in the standard broad-line regions of normal AGNs.
2. Spectroscopic Monitoring Program
2.1. Observations
A long-term observing program was initiated in 1991 to systematically take moderate resolution (4–6 Å) optical spectra of 20 known double-peaked emitters, selected for having apparent magnitudes bright enough to be observed with 2 m class telescopes in a reasonable amount of exposure time. The majority of the galaxies in our monitoring program are BLRGs from the Eracleous & Halpern (1994, 2003) survey of moderate-redshift radio-loud AGNs. Included are objects with clearly double-peaked Balmer lines as well as objects whose Balmer lines are very asymmetric with a displaced broad peak and shoulders (e.g., 3C 227 and Mkn 668). The spectra were obtained with the Lick 3m, the KPNO 2.1m, the MDM 2.4m, the CTIO 1.5m telescope, and recently with the 9.2m Hobby-Eberly telescope. Here we present the monitoring of seven BLRGs: Arp 102B, 3C 390.3, 3C 332, PKS 0235+023, Mkn 668, 3C 227, and 3C 382. The remaining seven BLRGs are presented in Lewis & Eracleous (2006). The broad H profiles of 12 of the 14 BLRGs in our monitoring program have been successfully fit at one time with a circular or elliptical disk profile in the literature. Here we present an elliptical disk profile fit for Mkn 668, leaving only 3C 227 with a profile that is too complex to fit with a single disk component. Table 1 lists the BLRGs presented in this paper, along with their apparent visual magnitude, redshift, and Galactic reddening.
In order to sufficiently sample the long-term variability of the line profile, where significant changes typically occur on the timescale of months, when possible, 3–4 observations of the objects were taken per year. The log of spectroscopic observations for the objects is listed in Tables 2–8, including the telescope and exposure time. Figure 1 shows a histogram of the temporal spectroscopic coverage of the BLRGs presented in this paper.
2.2. Data Reduction
The spectra obtained before 1999 were reduced with standard IRAF routines for bias correction, flat fielding, sky subtraction, cosmic-ray rejection, and spectrum extraction. The calibration of one-dimensional spectra (wavelength calibration, atmospheric extinction and absorption band correction, and flux calibration) was carried out with custom-made programs developed by our group (described in Eracleous & Halpern 1994). Spectra obtained after 1999 were reduced with IDL routines written for our observing program, which include scaling and shifting of the atmospheric bands for optimal correction, and the removal of bad pixels based on outliers from the mean local spatial profile. Spectrophotometric standard stars (BD +174708, BD +262606, HD 19445, HD 84937: Oke & Gunn 1983; Fukugita et al. 1996) were observed to correct for atmospheric absorption features and for construction of the sensitivity function. The extraction window was chosen to include 90% or 95% of the total enclosed flux, depending on the dominance of galaxy starlight. For our study we isolated the broad H line, since it is the strongest double-peaked emission line, and its high signal-to-noise makes it possible to study complex profile variability in detail.
The continuum near the broad H line was modeled by the least-squares fit of the linear combination of a stellar template and a straight line (Eracleous & Halpern 1994). The stellar template was constructed from a scaled spectrum of a normal galaxy [NGC 4339 (E0), NGC 5576 (E3), NGC 7332 (S0 pec sp), NGC 7457 (SA(rs)0), or UGC 555 (S0/a)], which was chosen from the fit that gave the smoothest residuals at the strong Na I D stellar absorption feature near 5900 Å. Correct scaling of the stellar template is important for removal of the contribution of stellar absorption lines to the broad lines. However, the removal of H absorption may not be perfect, since Na I D and H could come from different stars, and there might be some gas-phase absorption in Na I D. The spectra were corrected for Galactic extinction, and shifted to their rest wavelengths using the mean redshift measured from parabolic fits to the peaks of the strong narrow emission lines in the spectrum.
In order to isolate the broad component of the H emission lines, the narrow emission lines superimposed on the broad H line (narrow H, [O I] 6300, 6363, [N II] 6548,6583, and [S II] 6716,6731) were fitted with Voigt profiles plus a quadratic function approximating the broad “continuum” below it and then subtracted from the spectrum. A Voigt profile fits the wings of the line profile more accurately than a single Gaussian. Due to the uncertainty in the shape of the broad line below the narrow lines, the following constraints were put on the Voigt profile fits: 1) the widths of the lines were fixed to the width of the isolated narrow [O I] 6300 line (or narrow H line for objects where [O I] is too weak), and 2) the [O I] and [N II] forbidden-line doublets were fixed to have a total intensity ratio of 3:1. In the case of Mkn 668, the multiple-Voigt profile fit to the H + [N II] narrow-line complex underestimates the flux in the narrow H line for some of the epochs. In order to improve the fits, an additional constraint for [N II]6583/H= 0.97 was added, in order to match the narrow-line ratios of the best-fit profiles. The continuum-subtracted spectra were then normalized by the flux in the narrow [O I] 6300 (or narrow H) line for relative flux calibration. The narrow emission lines are used for relative flux calibration since the light-crossing time of the narrow-line region is long( 102–103 yr), and thus the narrow-line fluxes should not vary on the timescale of the monitoring program. Absolute flux calibration is not critical to this study, since we are most concerned with measuring the changes in the shape of the line profile that reflect dynamical changes in the broad-line gas and not the absolute flux of the broad line in response to the continuum. Since the narrow-line region is predominantly unresolved in the spectra, the line ratios should be constant for all the observations, regardless of the slit-width or seeing conditions of each observation. The scatter in the narrow-line ratios therefore reflects the systematic error introduced by the narrow-line fitting, and is typically on the order of 10%. The velocity scale for the spectra shifted to their rest wavelengths was determined from the relativistic Doppler formula:
| (1) |
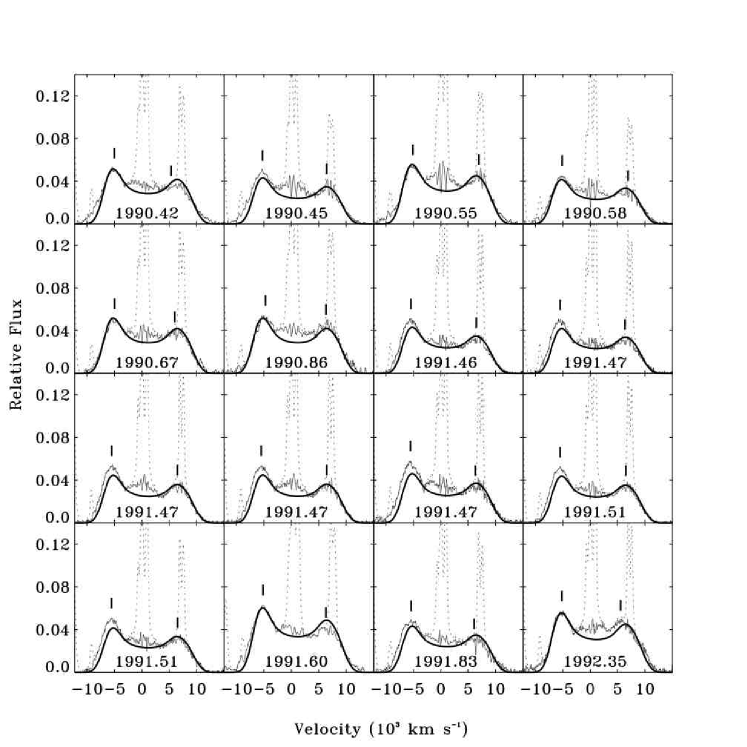
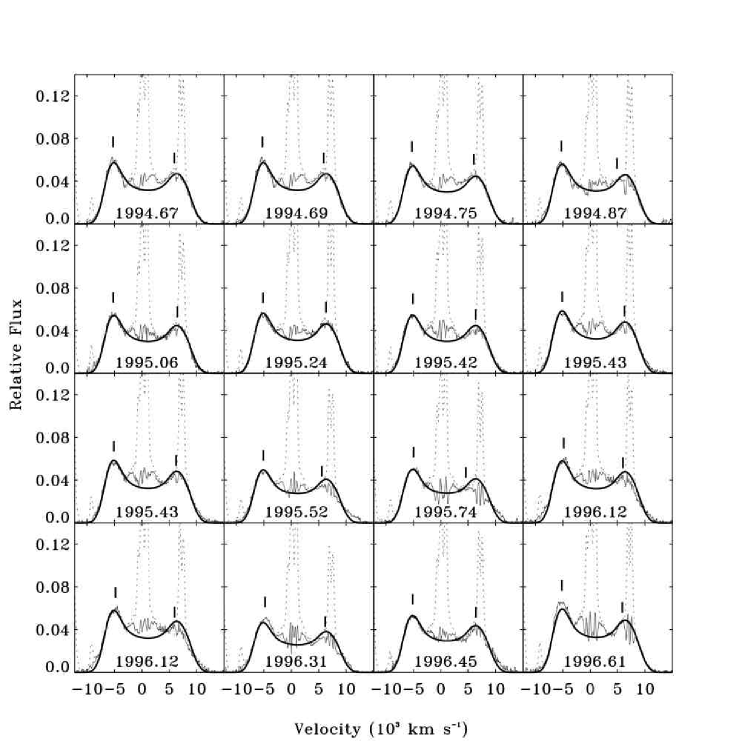
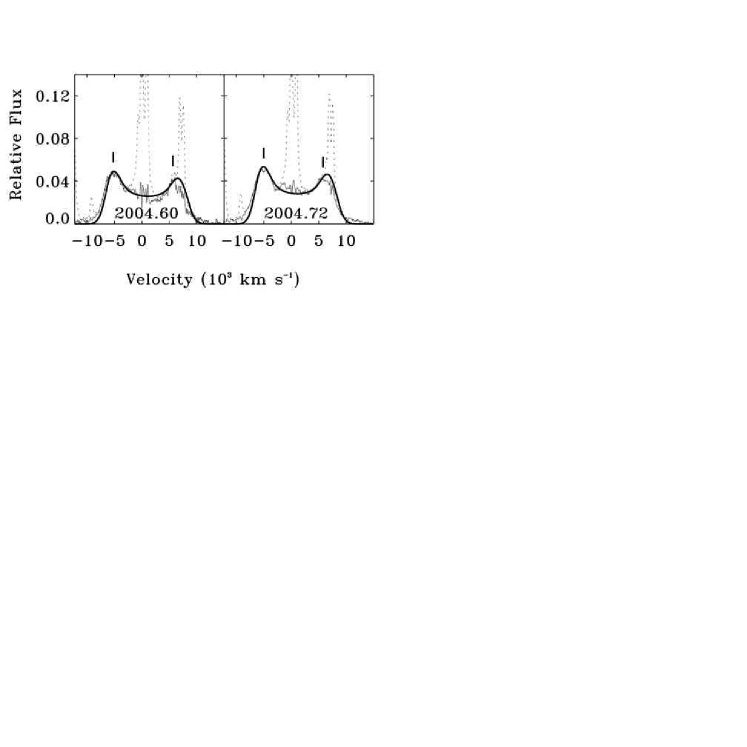
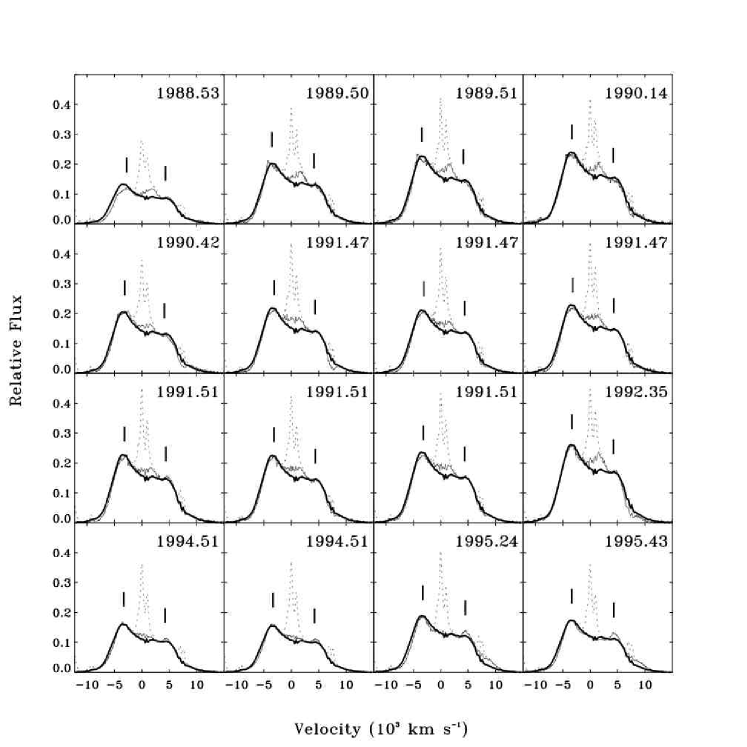
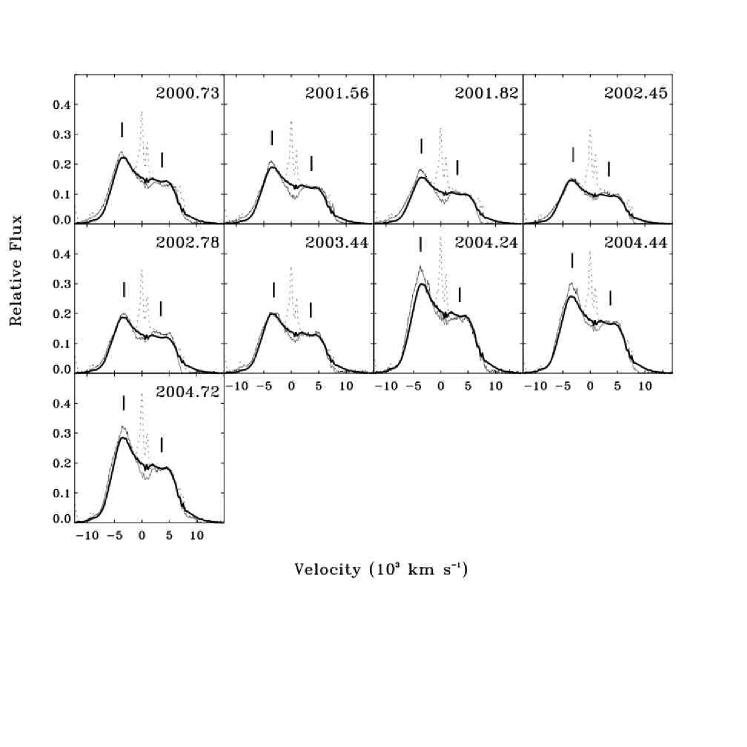
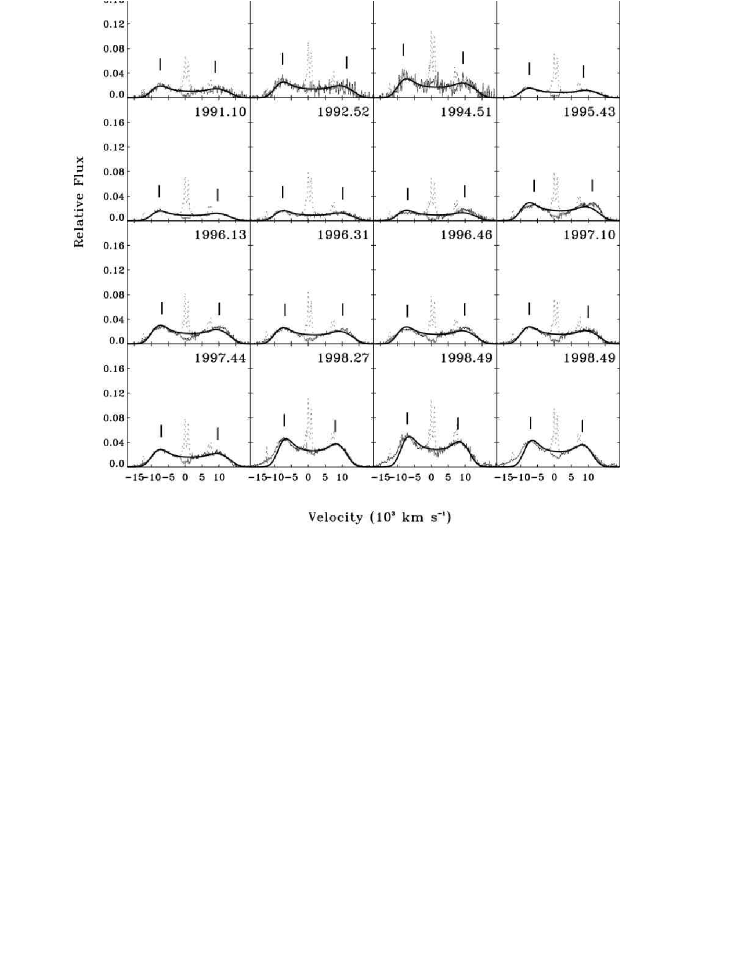
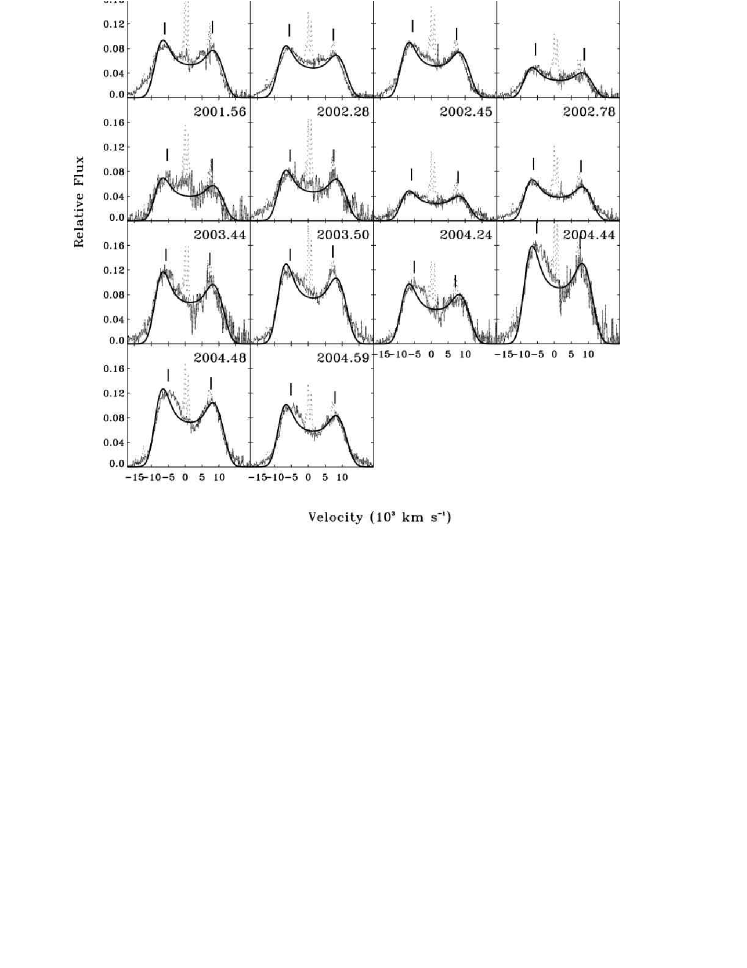
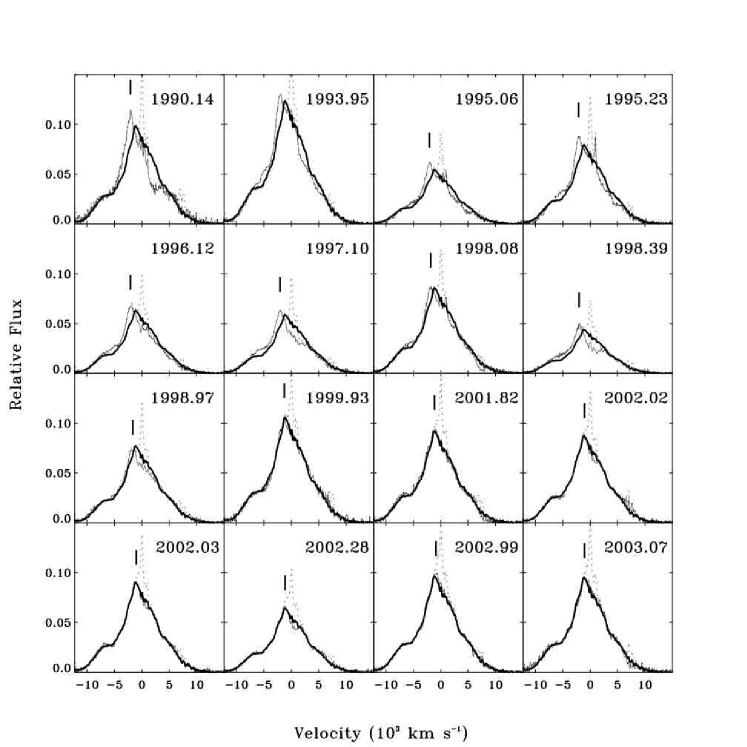
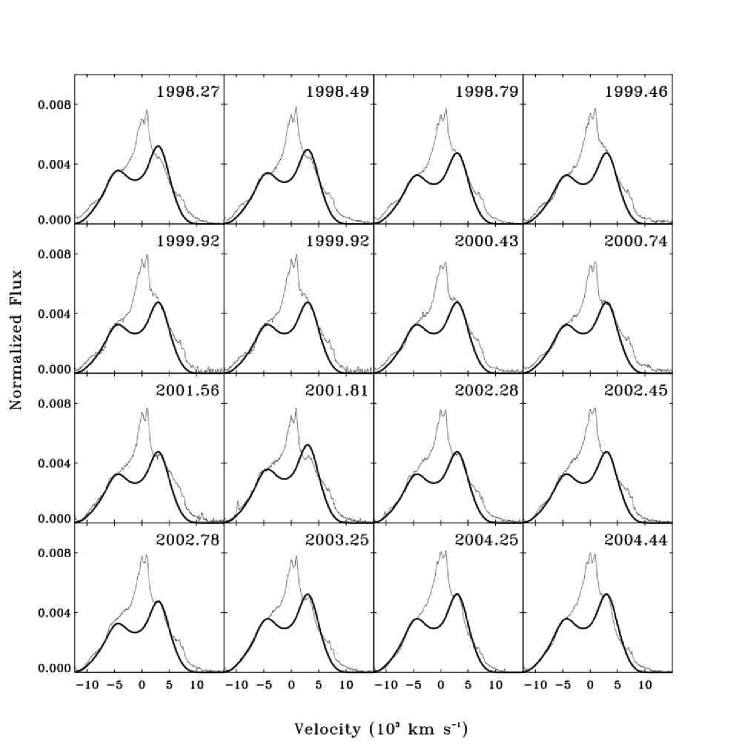
The narrow-line–subtracted, narrow-line–flux-calibrated broad H profiles of the objects for all the spectra in our monitoring program are shown in the Appendix. In the case of 3C 382, the [O I] 6300 narrow line was too weak to use as a template for line fitting and flux calibration, and the scatter in the narrow H+[N II] multiple-Voigt profile fit was too large to use the narrow H line as a reliable flux calibrator. Therefore, the profiles were neither narrow-line–subtracted nor flux-calibrated, and the profiles are shown normalized by the flux in the regions of the broad H line not contaminated by the narrow lines.
2.3. Characterization of Variability
We characterize in detail the variability of the line profiles on timescales longer than the light crossing time of the broad-line region ( weeks). Variability on such long timescales (months to years) is unlikely to be the result of reverberation of a variable ionizing continuum (cf. Blandford & McKee 1982; Peterson 1993). Rather, it is caused by changes in the structure, velocity field, or emissivity of the line-emitting gas. Simultaneously to changes in the line profile there may also be slow changes in the integrated flux of the broad lines caused by long-term variations in the flux of the ionizing continuum.
Mean and root mean square (rms) profiles were created from the broad H profiles normalized by their total broad-line flux. The profiles are normalized by the broad-line flux in order to remove the first-order multiplicative response of the profile shape due to changes in the line flux. The rms profile thus measures deviations of the shape of the profile from the mean profile shape. Sharp features occur in the rms spectra at the location of the narrow emission lines due to systematic errors in the narrow-line removal. The velocities of the red and blue peaks of the mean spectrum were measured from the flux-weighted centroid of the top 10% of the peaks. The red and blue peaks of the individual profiles were characterized by measuring the first three moments of the top 10% of the peak: , the average flux [(R), (B)]; , the flux-weighted velocity centroid [(R), (B)]; and when the signal-to-noise was sufficient, , the dispersion [(R), (B)]. The moments of the peaks were measured instead of using a Gaussian fit, in order to make no assumptions about the shape of the peaks, which are often sharp and asymmetric. Only the top 10% of the peaks were used to measure the moments of the peaks in order to avoid confusion with the neighboring broad profile shape. The wings of the profile were characterized by the full width at quarter-maximum (FWQM) and the shift at quarter-maximum (QMS) measured from the central velocity at quarter-maximum. The flux-weighted centroid at quarter-maximum (QMC), the total integrated flux, and the integrated flux in fixed velocity intervals were also measured. The statistical errors in the measurement of the average flux, centroid, and velocity dispersion of the peaks were calculated from the signal-to-noise in the continuum at a rest wavelength of 6900–6930 Å (this wavelength range was chosen so that it was covered by all the spectra in the study). The noise per pixel of the continuum in all the spectra is better than , which corresponds to a statistical error in the average flux and centroid of the peaks of less than 5%. Peak velocities and velocity dispersions are only given for peaks that do not have narrow lines superimposed on them, as the narrow-line subtraction is not accurate enough to reveal the true shape of the peak below it, and thus does not allow for a useful measure of velocity and width. The 1 error in measurements that include regions superimposed by the narrow lines, including the total broad-line flux, is calculated from adding in quadrature the 1 error in the flux of the least-squares Voigt profile fit and the systematic error in the relative flux calibration measured from the scatter in the narrow-line ratios (which dominates the error). In order to facilitate future studies of these objects, all of the measurements for the objects are reported in Tables 9 – 14.
3. Observed Trends
3.1. Arp 102B
The mean spectrum of Arp 102B (Figure 2a) has redshifted and blueshifted peaks with (R) = +5600 and (B) = 5200 km s-1, respectively. The rms spectrum (Figure 2b) indicates strong variability in the shape of the profile near the peaks of the mean spectrum, with the strongest variability in the wings of the profile. Figure 3 shows the a) flux calibrated relative to narrow [O I] 6300, b) FWQM, c) QMS, d) (R)/(B), e) QMC, f) (B), and g) (B) of the broad H line over the entire duration of the monitoring program. The (R)/(B) ratio is measured from the average flux in the velocity ranges corresponding to the top 10% of the red peak (+4900 to +6400 km s-1) and blue peak (4500 to 5900 km s-1) of the mean spectrum. Fortunately, the velocity range for the red peak does not overlap with the location of the narrow [S II] lines.
Flares in broad-line flux. – A rapid flare in the broad-line flux occurred in 1989, with a duration of 10 days, and an increase in flux of 35%. In addition, there was a year-long period of a high state in flux in 1998, during which a large amplitude flare occurred with a duration of 123 days, and an increase in flux of 60%. Both flares are also seen in the continuum flux near H, and thus are not the result of systematic effects in the relative flux calibration due to changes in seeing or slit width. The times of the flares and the high-state of flux are plotted with open circles in Figure 3. During both flares, the FWQM decreased to 1.65 104 km s-1 and the width of the blue peak narrowed to (B) = 400 km s-1 . During the rapid flare, the QMS and QMC shifted by 500 km s-1 , as a result of a sudden decrease in the strength of the red wing during the flare.
Systematic variations in FWQM. – The FWQM varies in a step-like manner, with a rapid increase from 1.67 104 to 1.80 104 km s-1 from 1988.71 to 1989.50, and a drop to 1.75 104 km s-1 in 1993, and then a drop to 1.67 104 km s-1 in 1998. The changes in the FWQM reflect systematic changes in the wings of the profile. Along with changes in the width of the profile, the QMS also shifts from a mean of +1000 km s-1 to a mean of +600 km s-1 after 1997, revealing a weakening of the red wing relative to the blue wing.
Red peak higher than blue peak. – The shape of the profile in 1983 is quite distinct from the later spectra, with a strong, broad red peak and (R)/(B) close to 1. In fact, spectra of the broad H line reported by Miller & Peterson (1990) taken in 1982 have (R)/(B) 1.
Oscillation of (R)/(B). – (R)/(B) oscillates from 1991 to 1994, which was reported by Newman et al. (1997) (and measured from slightly different wavelength intervals), and this oscillation of (R)/(B) reappears in 1999. The least-squares fit of the (R)/(B) ratio to a sine curve with weights set to 1/ for the times of oscillation from 1990 – 1994 and 1999 – 2005 results in a period of 2.073 0.018 and 2.010 0.006 yr, respectively. Our period for the first oscillation is within the errors of Newman et al.’s (1997) measurement of 2.16 0.07 yr. The oscillation of (R)/(B) is also evident in the QMC, which has the same pattern of oscillation. During the oscillation of (R)/(B), the blue peak has a minimum velocity during a maximum of (R)/(B) in 1990.86 (when the blue peak is weak), and a maximum velocity during a minimum of (R)/(B) in 1991.47 (when the blue peak is strong). The width of the blue peak spikes during the (R)/(B) oscillation at times when the very top of the blue peak appears to be suppressed in strength, and does not always occur during a maximum of (R)/(B).
Systematic drift of the blue peak velocity. – The velocity of the blue peak varies by a maximum amplitude of 500 km s-1 from the mean. The velocity systematically decreases from 1994.87 to 1996.31, from 5300 to 4800 km s-1, and then increases back to 5300 km s-1 in 1996.69.
Systematic narrowing of the blue peak. – The width of the blue peak systematically narrows to a minimum of 400 km s-1 from 1994.46 to 1994.75, when the shape of the blue peak is visibly sharper.
3.2. 3C 390.3
The mean spectrum of 3C 390.3 (Figure 4a) has a strong blue peak with (R) = 3300 km s-1 and a red peak on a flat shelf, with (R) = +4300 km s-1 . The rms profile (Figure 4b) shows five distinct regions of strong profile variability in the red central part of the profile, peaking at a velocity of +1300 km s-1 , near the velocities of the red peak and the blue peak of the mean profile, and in the wings of the profile. It should be noted that there is a spike in the rms profile at 2500 km s-1 that corresponds to the strong -band atmospheric absorption feature at 6870 Å, which is not always divided out perfectly by the atmospheric standard stars in the reduction of the spectra. Figure 5 shows the a) flux calibrated relative to narrow [O I] 6300, b) FWQM, c) QMS, d) (R)/(B), e) QMC, and f) (R)-(B) of the broad H line over the entire duration of the monitoring program. Figure 6 shows the a) (B), b) (R), c) (R), and d) (B) of the peaks of the profiles. The (R)/(B) ratio is measured from the average flux in the velocity ranges corresponding to the top 10% of the red peak (+3300 to +5900 km s-1) and blue peak (1700 to 4500 km s-1) of the mean spectrum. Figure 7 shows the integrated flux in the five coherent variable regions of the profile determined from the rms spectrum, relative to the total flux of the broad line: the blue wing (4500 to 12,300 km s-1), blue peak (1700 to 4500 km s-1), central peak (1700 to +3300 km s-1), red peak (+3300 to +5900 km s-1), and red wing (+5900 to +15,000 km s-1). The dramatic changes in the shape of the profile are also demonstrated in the individual profiles plotted in comparison with the mean profile scaled to the total flux of the line (see Appendix).
Figure 8 shows (B)/(R) defined by Veilleux & Zheng (1991) (hereafter VZ91) and the velocity of the blue peak over 40 yr, with data points from 1974 to 1990 from VZ91 shown with open circles, and data from our monitoring program shown with filled circles. The definition of (R) from VZ91 is actually centered on the red central peak located at +1800 km s-1 , and (B) includes the blue peak and blue wing of the profile. The quasi-periodic oscillation that they reported does not continue after 1990, and the (B)/(R) ratio continues to rise due to the decreasing strength of the central peak (see Figure 7). The linear decrease of the velocity of the blue peak from 4700 km s-1 in 1968 to 3200 km s-1 in 1988 was reported by Gaskell (1996), and used to fit a double-line spectroscopic binary model with a period of 300 yr and a binary mass of 6.6 x 10⁹ . The linear trend in the blue peak velocity does not continue after 1988, and the velocity levels off at 3200 km s-1 , which was also noted by Shapovalova et al. (2001) from their monitoring of the blue peak velocity of the H profile from 1995 to 2000.
Shapovalova et al. (2001) reported an anticorrelation between the peak velocity separation in the H profile (measured from difference profiles, in which the minimum-activity average spectrum was subtracted from spectra not normalized by their broad-line flux) and the total broad line flux, as well as an anticorrelation with the flux measured in the continuum at 5125 Å. We do not see such a relationship between peak velocity separation and total flux in our monitoring of H; however we measure the peak velocities from the narrow-line–subtracted spectra, and have peak velocity separations that range from (6 – 8) 103 km s-1, while their measurements of (R)-(B) are in the range (8 – 15) 103 km s-1. It seems that their measurement of the peak velocity separation is affected when producing the difference profiles.
Fluctuation of (R)/(B). – A fluctuation of (R)/(B) is observed from 1994 to 1998 over 4 yr, with an amplitude of 0.11. During the maximum of (R)/(B) in 1996.12, the velocity of the blue peak drops by +600 km s-1 , and the width of the blue peak jumps by 90%. After the maximum of (R)/(B), the width of the blue peak steadily decreases, and the blue peak velocity increases.
Flattening of the red peak. – The dramatic changes in the width and velocity of the red peak starting in 1997 are a consequence of the shape of the red peak flattening and the red wing forming into a sharp shelf in 2000 (see individual spectra in the Appendix).
Blueward drift of QMS and QMC. – After reaching a peak velocity in 1995, the QMS and QMC drift by 1000 km s-1 , reflecting the increase in strength of the blue peak and blue wing of the profile relative to the red wing.
Transient sharp features in the blue peak. – Transient sharp spikes in the blue peak (shown in Figure 9) appear in 1989.50, persisting for 2 yr with a FWHM 750 km s-1 and a velocity of -4300 km s-1, and again in 1998.27 with a FWHM 700 km s-1 that drifts from 3000 to 2600 km s-1 over a period of 1.5 months. Although the velocity of the spike in 1998 is quite close to the location of the atmospheric -band feature at 2500 km s-1, it is a real feature that is also detected in Shapovalova et al. ’s (2001) monitoring of the H profile of 3C 390.3 taken with a different telescope from 1998.15 to 1998.54.
Stronger blue peak during high state of flux. – The total flux of the broad line is in a high state in 2004 and the profile has a stronger and sharper blue peak than in the mean profile. However, it also appears that the blue peak is getting systematically sharper and stronger after 2000 (Figure 42), thus this behavior may be unrelated to the increase in flux.
3.3. 3C 332
The mean spectrum of 3C 332 (Figure 10a) has well-separated red and blue peaks with (R) = +8300 km s-1 and (B) = 6400 km s-1, respectively. The rms spectrum (Figure 10a) is strongest in the red wing, and also shows profile variability in the blue wing. Figure 11 shows the a) flux calibrated relative to narrow H, b) FWHM, c) HMS, d) (R)/(B), e) HMC, and f) (R)–(B) of the broad H line over the entire duration of the monitoring program. Figure 12 shows the velocity of the red and blue peaks of the profiles. The width, shift, and centroid is measured at half-maximum for this object, since the quarter-maximum is often located too far out in the wings of the spectrum to be measured reliably. The (R)/(B) ratio is measured from the average flux in the velocity ranges corresponding to the top 10% of the red peak (+7200 to +10,000 km s-1) and blue peak (5300 to 8000 km s-1) of the mean spectrum.
Maximum in (R)/(B). – (R)/(B) rises to a maximum in 1995.43, at which point the velocity of the blue peak shifts to a lower velocity, and the velocity of the red peak shifts to a higher velocity. During this maximum, the HMC rises to a maximum red velocity of +2500 km s-1 , and then returns back to +500 km s-1 in 1998, where it remains constant.
Changes in profile shape during high state of flux. – The FWHM and (R)–(B) begin to decrease when the flux increases in 1998. Figure 13 shows strong negative correlations between flux and the peak velocity separation, FWHM, and the integrated flux in the red wing (+10,000 to +12,800 km s-1 ) and the blue wing (8000 to 10,800 km s-1 ), normalized by the total flux. These negative correlations indicate that at higher fluxes, the peaks shift closer together, and the wings of the profile are weaker. There also appears to be a bluer HMS during the high-state of flux, indicating a weakening of the red wing relative to the blue wing.
3.4. PKS 0235+023
The mean spectrum of PKS 0235+023 (Figure 14a) has a narrow blue peak with (B) = 4700 km s-1 , and red peak with (R) = +2700 km s-1 . The rms profile (Figure 14b) shows variability in the shape of the profile blueward of the blue peak, and redward of the red peak of the mean spectrum. Figure 15 shows the a) flux calibrated relative to narrow H, b) FWQM, c) QMS, d) (R)/(B), e) QMC, and f) (B) of the broad H line over the entire duration of the monitoring program. The (R)/(B) ratio is defined from the integrated flux in the regions of maximum variability in the rms spectrum near the red peak (+2300 to +5200 km s-1 ) and blue peak (3900 to 6900 km s-1 ) of the mean spectrum.
Dramatic change in profile shape after 1991. – The drop in (R)/(B) by 50%, the drift in the velocity of the blue peak by +500 km s-1 , and the drift in velocity of the QMS and QMC by 2000 km s-1 , reveal a dramatic change in the profile shape between the 1991 profile and the profiles after 1996, when the entire profile appears to get skewed towards the blue.
Linear increase of (B). – The blue peak velocity increases roughly linearly from 3600 km s-1 in 1991 to 5000 km s-1 in 2005.
Minimum in FWQM. – The minimum in the FWQM of the profile from 1998–1999 is the consequence of a stronger blue peak as well as an almost complete disappearance of the red peak and red wing of the profile.
3.5. Mkn 668
The mean profile of Mkn 668 (Figure 16a) has a strong central red peak with (R) = +1700 km s-1 , and a broad base with a blue shelf. The rms spectrum (Figure 16b) shows strong variability redward and blueward of the central red peak of the mean profile. Figure 17 shows the a) flux calibrated relative to narrow H, b) FWQM, c) QMS, d) (R)/(B), e) QMC, and f) (R) of the broad H line over the entire duration of the monitoring program. The (R)/(B) ratio is measured from the integrated flux in the regions of strong variability measured by the rms spectrum, redward of the central peak (+3200 to +5600 km s-1 ) and blueward of the central peak (800 to 3200 km s-1 ) of the mean profile.
Fluctuation of (R)/(B). – The (R)/(B) ratio fluctuates, with a maximum of 2.5 in 1990.42, decreasing to a minimum of 1.5 from 1996 to 2001, and then increasing to a maximum of 2.3 in 2002. These changes in (R)/(B) are reflective of the dramatic changes in the shape and peak velocity of the central peak of the profile. The velocity of the central peak shifts from a maximum of +2500 km s-1 during the maximum of (R)/(B), and to a minimum of +1700 km s-1 during the minimum of (R)/(B), while the shape of the profile changes from a skewed to a more symmetric shape.
Dramatic changes in (R). – The historical velocity curve of the central red peak is shown in Figure 18 with data points in 1974 from Osterbrock & Cohen (1979), in 1982 from Gaskell (1983), and data points from Marziani et al. (1993) from 1985 to 1991 measured from the H profile. The central peak was at a maximum velocity of +2700 km s-1 from 1974 to1982, before shifting to a lower velocity of +1800 km s-1 in 1985. When the peak shifts to smaller velocities, the peak velocity measurement of the H profile is affected by systematic errors in the narrow-line subtraction. Due to the uncertainty in the exact shape of the broad-line underneath the narrow H+[N II] narrow-line complex, upper limits are shown for our measurement of (R) when the measured velocity is within the velocities of the narrow lines.
3.6. 3C 227
The mean profile of 3C 227 (Figure 19a) has a strong central blue peak with (B) = 1500 km s-1 , and a broad base with a red and blue shelf. The rms profile reveals a strong and narrow region of variability on the blue side of the central peak, with a FWHM 2200 km s-1 , and strong variability redward of the central peak, as well as some variability in the shape of the blue and red shelf of the profile. Figure 20 shows the a) flux calibrated relative to narrow H, b) FWQM, c) QMS, d) (R)/(B), e) QMC, and f) (B) of the broad H line over the entire duration of the monitoring program. The (R)/(B) ratio is measured from the integrated flux in the regions of strong variability measured by the rms spectrum redward of the central peak (+1700 to +3400 km s-1 ) and blueward of the central peak (1200 to 4400 km s-1 ) of the mean spectrum.
Excess feature in the blue peak. – The (R)/(B) ratio increases monotonically from 1990 to 2000, revealing an excess feature in the central blue peak that fades away. The historical velocity curve for 3C 227 (Figure 21), which includes data points in 1974 from Osterbrock, Koski & Phillips (1976), and in 1982 from Gaskell (1983), indicates that the excess in the central blue peak persisted from 1974 to 1998. The QMS and QMC increase by +800 km s-1 between 1995 and 2000, also a result of the fading away of the blue feature.
3.7. 3C 382
The mean profile of 3C 382 (Figure 22a) has a red peak and a blue shoulder that are superimposed by the H+[N II] narrow-lines. The mean and rms profiles are measured without the narrow emission lines subtracted from the spectrum, because of the large errors in fitting the weak [O I] 6300 narrow line and the crowded H+[N II] narrow-line complex. The rms profile (Figure 22b) shows variability in the shape of the red wing, as well as a narrow region of profile variability at the velocity of the red peak of the mean profile, and in the far blue wing. Figure 23 shows the integrated flux in the regions of maximum variability measured by the rms spectrum, relative to the total integrated flux of the line, avoiding regions superimposed by narrow lines, near the red peak (+2100 to +3800 km s-1 ), the red wing (+4400 to +6200, +8000 to +15,000 km s-1 ), and the blue wing (7500 to 11,300 km s-1 ) of the mean spectrum, over the entire duration of the monitoring program. (R)/(tot) drops by 15% in 1994 to 1995, and then returns back to its mean value in 1997. During the drop in (R)/(tot), the normalized flux in the red wing increases by 25%, and then steadily decreases. After this jump in (RW)/(tot), there is a sudden increase in (BW)/(tot) in 1998 by 40%, after which the normalized flux in the blue wing steadily decreases. After 2002, while the normalized flux in the red and blue wing is decreasing, the normalized flux in the red peak increases.
Fluctuation of (RW)/(BW).– The one cycle of fluctuation in the (RW)/(BW) ratio between 1994 and 2000, is a result of the sharp increase in the relative strength of the red wing in 1995 followed by an increase in the blue wing in 1998. This fluctuation of (RW)/(BW) does not repeat during the 16 yr of our spectroscopic monitoring program, and thus if this trend is periodic, its timescale is 20 yr.
4. Comparison with Models
4.1. Arp 102B
4.1.1 Circular Disk
The characteristic timescale of the (R)/(B) oscillation in Arp 102B ( 2 yr), is on a much shorter timescale than the slow, step-like variations in the FWQM (see Figure 3). In order to decouple the oscillation of the peaks of the profile from the slower, systematic changes in the wings, the step-like variation in the FWQM of the profiles was successfully modeled by changing the inner and outer radii of the best-fit circular disk model from 1990–1994 (, , , , km s-1). Figure 24 shows the three model disk profiles that fit the mean FWQMs of the profiles plotted with solid lines in Figure 3b. The step-like variations of the inner and outer radius (from = 400 and = 700, to = 325 and = 825, to = 300 and = 825) of the disk are either a result of changes in the emissivity of the disk, perhaps due to changes in the illumination, or changes in the structure of the accretion flow itself. The radial structure of the accretion disk evolves on the viscous timescale, , where is the dynamical time, ( 0.1) is the Shakura -Sunyaev viscosity parameter (Shakura & Sunyaev 1973), and is the sound speed. This timescale is several orders of magnitude larger than the time over which the apparent radii of the disk change ( 10 yr); thus the structure of the disk cannot be varying fast enough to cause the changes in the radii of the line-emitting region of the disk. If illumination is the driver for the changes in radii, then it follows that since the broad-line flux does not correlate well with the changes in radii, it may be that the geometry, not the flux, of the continuum source is changing the emissivity profile of the disk.
The profiles were fitted with one of the three model disk profiles with the closest FWQM, by scaling the model to minimize the sum of the squares of the errors from the model (least-squares fit). Regions of the profile contaminated by the narrow lines were not used in the fit. The scaled model disk profile for each spectrum is shown in blue in the spectra in the Appendix. During times of the oscillation of (R)/(B) the profiles were fitted with a model disk profile, allowing for a Gaussian excess above the disk profile. Our method is similar to that of Newman et al. (1997) for modeling the profiles with a disk plus a Gaussian, except that we keep our disk profile fixed at any given time, and allow the Gaussian to vary, while Newman et al. (1997) allowed both components to vary, by allowing the inner and outer radii of the disk model to change. Figure 25 plots the peak velocity of the Gaussian excesses during the oscillations of (R)/(B) as a function of time. The velocity of the excesses are well constrained when they have a velocity near the peaks of the profile. However, there are large uncertainties when the excesses are located within the velocities of the narrow H+[N II] complex, since the shape of the broad line underneath the subtracted narrow lines is not well constrained due to errors in the narrow-line subtraction. The FWHM of the Gaussians fits from 1991 to 1994 are 4000 km s-1, while the Gaussians are narrower from 1999 to 2003 with a FWHM of 2000 km s-1, and narrow even further to 1000 km s-1 in 2004. The most natural explanation for an excess that periodically oscillates between the red and blue sides of the profile is rotation.
4.1.2 Orbiting Bright Spot?
Newman et al. (1997) fitted the first episode of the (R)/(B) oscillation from 1991 to 1995 with a bright spot at a radius of 455 rg, with an angular width of 8 (FWHM = 2000 km s-1), a radial width of 5 rg and an orbital period of 2.2 yr. Newman et al. (1997) determined the radius of the bright spot from the peak velocity of the Gaussian fit to the excess in the blue peak in the 1991 June 17–20 spectra. If the bright spot is assumed to be at a phase angle () of 270 in the disk (when the bright spot is at its maximum blue radial velocity), the gravitational radius of the bright spot can be calculated from the relativistic Doppler factor, , which in the weak-field approximation is
| (2) |
where is the inclination determined from the disk fit, and the observed velocity is then
| (3) |
The radius, period, and phase, = ), of the bright spot for each time of oscillation of (R)/(B) is determined from a least-squares fit of the observed velocity curve of the Gaussian excesses to the velocity curve of a bright spot in the disk (eq. [3]) , with weights set to 1/. The resulting radii for the first and second episode of the oscillation are 427 5 and 757 4 respectively, and periods of 2.247 0.003 and 2.031 0.001 yr, with quoted errors equal to 1 . The quoted errors are the standard deviation of the best-fit parameters for the model velocity curve and do not reflect systematic errors from the assumption that the data behave like the model. Combining the orbital periods of the bright spots with their radius in units of , a dynamical measurement of the central black hole can be made. Using the complete form of Kepler’s third law for a circular orbit,
| (4) |
this yields central black hole masses of 2.60 0.05 and 1.00 0.01 108 . Our measurement of the black hole mass from the first oscillating bright spot is consistent with Newman et al. ’s (1997) measurement; however, it is discouraging that modeling the second episode of the (R)/(B) oscillation with an orbiting bright spot yields a discrepant black hole mass. An independent estimate of Arp 102B’s central black hole mass was made by Lewis & Eracleous (2006) from the measured stellar velocity dispersion (Barth et al. 2002), and the correlation between the velocity dispersion and the mass of the central black hole (Tremaine et al. 2002). Including the uncertainty in the slope of the - relation, they determined a central black hole mass of () . It may be that a single orbiting bright spot is not a correct interpretation of the Gaussian excesses, and the excesses may be the consequence of a more complex configuration of emissivity enhancements orbiting in the disk. The transient nature of the oscillations suggests a time-dependent configuration. One mechanism to produce transient bright spots in the disk is spiral shocks induced by tidal perturbations. Chakrabarti & Wiita (1993) conducted two-dimensional hydrodynamical simulations to investigate the tidal effects on an AGN accretion disk by passing massive perturbers ranging from Mpert/= 10-3 – 10-1. Stellar-mass perturbers, with Mpert/ 10-5, were not included in the simulation due to limitations in their grid resolution. The simulations revealed density waves in the disk that steepened into spiral arms and knotty structures of increased density, temperature, and emissivity, that formed, fragmented, and reformed. The lifetimes of these features was longer than the orbital period in the inner regions of the disk, and during their lifetime, they propagated outward in the disk. This scenario may be a better physical model for the “bright spot” in Arp 102B, which appears for two orbital periods with a radius of 427 and then reappears several orbital periods later, further out in the disk at a radius of 757 .
4.1.3 Collection of Orbiting Clouds in a Disk?
An alternative model that predicts an oscillation of (R)/(B) is not a single orbiting bright spot, but rather a disk-like distribution of clouds in nearly Keplerian orbits, with randomly distributed clouds having enhanced emissivity (Sergeev et al. 2000, hereafter S00). Monte Carlo simulations by S00 of clouds with a distribution of emissivities produce times of sinusoidal variation of the red and blue peaks, as well as a sinusoidal variation of the central portion of the profile with half the period of the (R)/(B) variation (since an orbiting cloud will pass through the center twice per orbit). Contrary to this, S00’s measurement of the central-to-total flux ratio in their spectra of H from 1992 to 1995 had a sinusoidal variation with the same period within the errors to that of the (R)/(B) oscillation. In order to explain this discrepancy with the predictions of the model, they postulated that the line emission originates in the face of the cloud illuminated by the central continuum source. Thus, if the disk is edge-on, clouds traversing in front of the continuum source will have their emitting face hidden from the line of sight, and their contribution to the line flux is seen to traverse the central portion of the profile only once per orbit.
Figure 26 shows the red, blue, and central flux ratios defined by S00, measured for the spectra in our monitoring program. Plotted with solid lines are the best-fit sine curves for their data set from 1992 to 1995. These curves are extended with dotted lines over the baseline of our observing program. It should be noted that these flux ratios include regions superimposed by narrow lines, and thus are subject to systematic errors introduced by the narrow-line subtraction, and typical error bars are shown. Our data fit their model for all the ratios from 1991 to 1994 [during the first oscillation of (R)/(B)], and follow reasonably well for (R)/(tot), (B)/(tot), and (R)/(B) during the later oscillation of (R)/(B) between 1999 and 2004. Contrary to their model, the (C)/(tot) ratio appears to stop oscillating after 2001, although the error bars in the (C)/(tot) ratio are too large to make a convincing argument either way.
S00 simulated the residuals from the mean normalized profile with a collection of 1500 clouds with an internal velocity dispersion resulting in a FWHM of 2000 km s-1. Their observed residuals from the scaled mean profile show enhancements traversing from the red to the blue side of the profile only, with no tracks from the blue to the red side. They again attribute this to the phase effects that explain the equal periods of (C)/(tot) and (R)/(B). Due to the uncertainty in the narrow-line subtraction in the center of the profile, as well as the unknown nature and variability of the central broad component of the profile not accounted for by the disk-fit (see §1), it is not clear whether a reliable detection of tracks traversing through the central part of the profile is possible. Our measurement of (C)/(tot) and the residuals from the disk profile do not show definitive evidence for phase effects, and thus it seems that the edge-on configuration does not seem necessary, in either the cloud model or the bright spot model (in which the bright spot is also expected to traverse the center twice per orbit). In general the cloud model is problematic, because the clouds must have large internal velocity dispersions and a large covering factor, which would lead to dissipation of the clouds or destruction by collisions on the timescale of decades (S00), unless there was a mechanism to produce new clouds on this timescale. Thus, without the necessity for phase effects, the orbiting cloud model seems less compelling than emissivity enhancements orbiting in an accretion disk.
4.1.4 Precessing Spiral Arm, Eccentric Disk, or Warp?
The bright spot model is not the only variation of the disk model that can produce an oscillation in (R)/(B) and an excess above the disk profile that shifts from one peak to the other periodically. A precessing eccentric disk, and a disk with a precessing spiral arm or warp, will have periodic changes of (R)/(B). In the eccentric disk model, the precession of the disk causes a sinusoidal variation of (R)/(B) as well as a sinusoidal variation of the peak velocities with the same period, with a minimum blue peak velocity during the minimum of (R)/(B) and a minimum red peak velocity during the maximum of (R)/(B) (for emissivity power-law index 3; see Lewis et al. 2004). The lack of a shift in the velocity of the peaks on the same timescale as the (R)/(B) oscillation in our data does not support this model. Most importantly, the timescale of the precession of the disk is determined by either the general relativistic advance of pericenter or the tidal effects of a binary companion, and is on the timescale of a few centuries for a 108 M☉ black hole (Eracleous et al. 1995). The 2 yr period of the (R)/(B) oscillation is much too short to be associated with a precessing disk or a precessing warp (see Storchi-Bergmann et al. 1997, eq. [4]), and its transience could not be associated with a persistent phenomenon.
The timescale of the (R)/(B) oscillation due to a precessing spiral arm is determined by the pattern precession period, which is typically an order of magnitude longer than the dynamical time, and less than the sound-crossing time (see discussion in Storchi Bergmann et al. 2003, and references therein). For a 108 M☉ black hole and an inner radius of 300 rg, that translates to a period between 1 and 20 yr (using eqs. [5] and [6] in Storchi-Bergmann et al. 2003). The 2 yr period of the (R)/(B) oscillation is within the range of plausible periods for a spiral arm; however, another consequence of a spiral arm are changes in the velocity and width of the peaks of the profile as the arm precesses. For a one-armed spiral that spans the entire radial extent of the line-emitting disk, during the minima of (R)/(B) the blue peak narrows and is at a maximum velocity, while during the maxima of (R)/(B) the red peak narrows and is at a maximum velocity (see Gilbert et al. 1999, Storchi-Bergmann et al. 2003, and Lewis et al. 2004 for examples). In our data, the width of the blue peak does not appear to narrow during minima of the (R)/(B) oscillation, nor does the velocity of the blue peak increase, except during the minimum of (R)/(B) in 1991.4. Thus, with the only spiral-like behavior being the periodic variation of (R)/(B), there are no compelling reasons to favor a spiral arm over a bright spot or other configuration of emissivity enhancements orbiting in the disk.
4.1.5 Reverberation of Flares in the Continuum?
The change in shape of the line profile during the small amplitude, rapid flare in 1989 July (Figure 2.13), is on a short-enough timescale to be the result of light travel time delays of the reverberation of the variable ionizing continuum. Using the black hole mass estimated from two independent methods: the bright spot model and the stellar velocity dispersion (Lewis & Eracleous 2006) which both yield a mass of 1 x 10⁸ M☉, and the outer radius of the best-fit disk profile in 1989 of 825 rg, the estimated light-travel time across the broad-line region is 5 days. A flare in the continuum with a duration on the order of the light-crossing time and much greater than the recombination time [, where is the electron density and is the case B recombination coefficient], can cause a detectable light echo to propogate across the profile (Peterson 1988). A light echo from such a flare is expected to produce spikes in the profile that drift from higher to lower velocities as it propagates outward in the disk (Stella 1990). During the flare in 1989, the line profile has a dramatically weaker red wing (Figure 27), and a narrower and stronger blue peak. The flare in 1998 occurs over a much longer timescale than the light-crossing time, and appears to have the same changes in the profile shape, namely a narrower red wing and stronger blue peak. Thus light-travel time effects are unlikely to be causing the dramatic changes in the profile shape during both flares.
During a flare, the increase in central continuum emission can temporarily illuminate the regions further out in the disk, increasing the contribution of emission from lower velocities. Increasing the outer radius of the circular disk model mainly broadens the peaks of the profile and shifts them to lower velocities but does not significantly affect the wings of the profile. Alternatively, the rapid flare could temporarily fully ionize the inner regions of the disk, causing an increase in the effective inner radius of the line-emitting portion of the disk or a flatter emissivity law at small radii. The result is a decrease in the strength of the wings, a shift of the peaks to lower velocities, and an increase in (R)/(B) (shown in Figure 24b). The decrease of (R)/(B) during the flares is not compatible with this scenario. In general, the decrease in (R)/(B) and in the FWQM cannot be modeled by increasing the central continuum illumination of a circular disk.
4.1.6 Gravitational Lensing?
Gravitational lensing can amplify a broad emission-line if the Einstein radius of the microlens is of a comparable size to the accretion disk producing the line emission. An interesting consequence of this, is that the profile can be amplified asymmetrically if the lens is off-center. Popovic et al. (2001) calculated two scenarios in which a microlens could produce sinusoidal variations in (R)/(B) similar to those observed in Arp 102B: (1) a supermassive binary companion at a distance of 0.3–1pc, which takes a few years to transit in front of the disk, but has an orbital period of 1000 yr; (2) a 1 star in an intervening galaxy (1/20th the distance of Arp 102B) with a relative velocity of 200 km s-1 . The important difference between these scenarios is the frequency with which the lensing events would occur. In the supermassive binary case, the lens should only transit in front of the disk once every 1000 yr, and thus only one period of the (R)/(B) sinusoidal variation should be observed during the entirety of our monitoring program. For the stellar-mass microlens case, the lensing transit events would randomly cause one period of an oscillation of (R)/(B) during the transit, with a frequency depending on the density of microlenses in the intervening galaxy. The multiple consecutive periods of the (R)/(B) oscillation observed after 1999 rule out a transiting scenario for the source of the oscillation. However, microlensing could be a mechanism to amplify the line profile asymmetrically and cause a flare of broad-line flux. This could be a possible explanation of the stronger blue peak of the profiles during the flares, but the decrease in flux of the red wing during the flares is not consistent with this picture, nor is the coincidence of both flares having a stronger blue peak, which in the gravitational lens model, should be a random consequence of the alignment of the microlens with respect to the disk.
4.1.7 Drift of Peaks due to Changing Outer Radius?
During the systematic drift of the blue peak velocity from 5300 to 4800 km s-1 and back to 5300 km s-1 again from 1995 to 1996, it is difficult to determine whether the velocity of the red peak is also shifting, because of the [S II] narrow lines superimposed on the red peak. In the circular disk model, the peak velocities will shift when the outer radius of the disk increases. If both of the peaks were drifting to lower velocities, then this could be modeled as an increase in the outer radius of the line emitting portion of the disk, which causes the peak separation to decrease. Figure 28 shows the spectra during the drift of the blue peak from 1995 to 1996 in comparison to the change in the profile shape caused by an increase in outer radius from 825 to 1300 . Although the shift in the blue peak velocity in the model matches the data, the shift of the red peak and broadening of both peaks in the model do not. This drift in the blue peak velocity occurs during a time of low (R)/(B). In general, there appears to be a trend towards a lower blue peak velocity when the blue peak is stronger, as is the case during flares in the broad-line flux.
4.2. 3C 390.3
4.2.1 Binary Broad-Line Region?
Eracleous et al. (1997) created yearly averaged velocity curves of the red and blue peaks of 3C 390.3 through 1996 and found that the red peak velocities were not consistent with the motion of a spectroscopic binary, and the best-fit model yielded a lower limit on the binary mass of 2.6 , larger than any known central black hole mass, and over 2 orders of magnitude larger than the black hole mass inferred from the stellar velocity dispersion, = 5 (Lewis & Eracleous 2006). Eracleous et al. (1997) noted that the velocity of the red and blue peaks are highly sensitive to changes in the shape of the peaks, which is evident in our spectra of the transient sharp features in the blue peak in 1989 and 1998 and in the flattening of the shape of the red peak from 1997 onwards, and occur on much shorter timescales than that predicted by an orbiting binary model. The reverberation mapping results for 3C 390.3 (see §1) also contradict the binary broad-line region scenario for the source of the displaced red and blue peaks of the profile, since no lag is detected in the response of the red and blue peaks, which would be expected if they were produced by a binary separated by 1.5 pc, as is determined from the best-fit binary model from Eracleous et al. (1997). It is also noteworthy that the widths of the two peaks of the H line are narrower than their separation, which is opposite from what one expects for a binary broad-line region governed by Kepler’s laws (M. V. Penston 1998, private communication; see footnote 3 in Chen et al. 1989).
4.2.2 Bipolar Outflow or Orbiting Bright Spot?
In general, it is difficult to fit the low (R)/(B), narrow FWQM, and strong central component of the broad H profile of 3C 390.3 with a simple circular disk. The best-fitting disk model to the broad H line by Eracleous & Halpern (1994) in a spectrum obtained on 1988 July 9 successfully fits the wings of the profile but underestimates the strength of the blue peak. Even more difficult, is reconciling the circular disk model with the 1976 and 1980 H profiles reported in Zheng et al. (1991), in which (R)/(B) changed from 0.8 to 1.5, indicating a stronger red peak than the blue peak in 1980. Zheng et al. (1991) modeled the two epochs of the H profile with an edge-on (non-relativistic) circular disk plus a bright spot with an orbital period of 10.4 yr, and also with a double-stream outflow. In the bipolar outflow model, the changes in (R)/(B) are due to variations of the relative intensity of the ionizing continuum illuminating the two cones, or due to changes in orientation of the cones, perhaps resulting from a precession of the rotation axis caused by its misalignment with the axis of the accretion disk. However, the theoretical timescale for the alignment of the disk (and hence the outflow axis) is much too long, 10 yr, to account for the timescales observed (Natarajan & Pringle 1998; Natarajan & Armitage 1999). Regular periodicity of (R)/(B) on the timescale of 10 yr is not evident in our monitoring data, ruling out the possibility of regularly precessing jets. The bipolar jet model is disfavored by reverberation mapping campaigns of 3C 390.3 starting in 1992, which show no lag between the response of the red side of the profile compared to the blue side in the H and H lines, which would be observed in the case of radial motion (Dietrich et al. 1998; Shapovalova et al. 2001; Sergeev et al. 2002). Thus, a bipolar outflow, if present from 1976 to 1980, must have disappeared by 1992 and would not be able to explain the fluctuation of (R)/(B) from 1994 to 1998. The mass of the central black hole can be estimated by combining the light crossing time of the broad-line region of 20 days (Dietrich et al. 1998) with the best-fit outer radius of the accretion disk model fit of 1300 from Eracleous & Halpern (1994), yielding a black hole mass of 3 x 10⁸ , which is in relatively good agreement with the black hole mass derived from the stellar velocity dispersion. For a central black hole mass of 3 x 10⁸ , and an inner radius of 380 , this translates to orbital periods ranging from 2 to 14 yr. The two episodes of an oscillation of (R)/(B) in 1976 to 1980, and 1994 to 1998, have periods that are both within the range of orbital periods in the disk and could be attributed to transient emissivity enhancements orbiting in the disk.
4.2.3 Precessing Eccentric Disk, Spiral Arm, or Warp?
The transient and irregular nature of the (R)/(B) oscillations disfavors a precessing eccentric disk, for which the period of the oscillation does not change, and the oscillation persists for longer than one cycle. Similary to Arp 102B, the estimated mass of the central black hole also implies a disk precession timescale of at least a few centuries, which is not compatible with the periods of the (R)/(B) transient oscillations. Gilbert et al. (1999) found the best-fit pattern period for a spiral arm to produce the oscillation in (R)/(B) between 1974 and 1998 to be greater than 25 yr. Although the spiral-arm model reproduces the sparsely sampled trend of (R)/(B) to oscillate from 0.8 in 1976 to 1.5 in 1980 and then back to 0.7 after 1990, it does not match the profile shapes in detail. A spiral arm precessing with this period would predict a subsequent rise to a maximum in (R)/(B) of 1.5 in 2005, which is not consistent with the relatively constant (R)/(B) ratio of 0.6 after 2000. Thus, any regular, periodic phenomena such as precessing spiral arms, eccentric disks, and warps are not able to reproduce the irregular changes in (R)/(B), as well as the extreme changes in the shape of the wings of the profile and the central red component. For any of the above scenarios to be viable, the perturbation must have a life time comparable to the pattern precession.
4.2.4 Binary Companion with Shared Accretion Disk?
The smooth changes in the red and blue wings and the central component have a large amplitude, and occur on a timescale of 5 yr. The normalized flux in the blue wing increases monotonically by 50% from 1995 to 2001, while the normalized flux in the red wing decreases by 65% from 1998 to 2002, and the flux in the normalized central red component decreases by 25% from 1993 to 1998. Since a complete cycle of variation is not observed in the normalized flux of any of these regions, it is not yet possible to determine if these changes are in fact periodic or even if they repeat. If they do repeat, the recurrence time would be 10 yr. A two-armed spiral does produce a peak in the central part of the profile, which could then drift toward the blue peak (Chakrabarti & Wiita 1993, 1994). However, such a spiral pattern would also produce dramatic changes in the velocities and intensities of the red and blue peaks as the central peak drifts, which are not observed. The physical mechanism producing the observed dramatic variability must change the shape of the high-velocity wings of the profile, and the central red component, without similarly affecting the lower velocity gas that produces the peaks of the profile. One possible scenario in which changes would occur only in the high-velocity wings of the profile, is an orbiting binary companion with a common circumbinary accretion disk with the central black hole. The orbital motion of the companion perturbs the disk, and creates a non-axisymmetric instability that causes enhanced accretion in the inner regions of the disk close to the companion. In addition, the binary will excite spiral waves in the inner parts of the circumbinary disk (Artymowicz & Lubow 1996; Armitage & Natarajan 2002). Both phenomena will affect the wings of the profile. For a binary separation less than the inner radius of the line-emitting portion of the disk, D 380 , and a total binary mass of 3 x 10⁸ , this would imply a binary separation of 0.005 pc, and an orbital period of 2.2 yr. The orbital period of the secondary is too short to produce the 10 yr characteristic periods of the variability observed in the wings of the profile. Regardless of this, the stability of such a binary configuration is unlikely, since at such a small separation, the expected time for coalescence of the binary due to gravitational radiation is short, 5 104 yr (Lightman et al. 1979).
4.2.5 Orbiting Features in the Disk?
The lifetimes of the relatively stationary narrow features in the blue peak constrain whether they can be orbiting within the disk. The sharp spike that appears in 1989.50, and persists for 2 yr at the same velocity, has a lifetime of at least 15% of an orbital period in the disk. If in orbital motion in the disk, the velocity of the feature would have been expected to drift by at least 2000 km s-1 during its lifetime. The feature that appears in 1998.27 drifts by 400 km s-1 over 1.5 months and has a lifetime that is short enough to be only 1% of an orbital period in the disk, and thus its drift of 400 km s-1 could be consistent with orbital motion. Another possibility is that the sharp features in the line profiles are shocks that propagate through the disk slowly (at the speed of sound). Thus they can cool and dissipate quickly before their apparent radial velocity changes significantly.
4.3. 3C 332
4.3.1 Changes in the Emissivity of a Circular Disk?
The decrease in FWHM and peak velocity separation in the profiles of 3C 332 during the increase in broad-line flux is easily accounted for by the disk model. When a disk is illuminated by a brighter central continuum source, regions farther out in the disk are photoionized, increasing the outer radius of the line-emitting portion of the disk. The increase in continuum flux can also fully ionize the inner regions of the disk, effectively causing an increase in the inner radius of the disk. The increase in inner and outer radius both cause lower velocity material to contribute more to the emission line, thus weakening the wings, and shifting the velocities of the peaks of the profile to lower velocities. A disk interpretation was also offered for the increase in peak velocity separation with decreasing broad-line flux in the double-peaked H profile of the LINER galaxy NGC 1097 (Storchi-Bergmann et al. 2003). By decreasing the inner radius of their disk model from 1300 to 450 , they could reproduce the drift in peaks of the H profile with the dimming broad-line flux. The decrease in inner radius was interpreted as a change in emissivity of the line-emitting gas, such that when the central continuum flux decreased, the region of maximum line emission shifted towards the inner regions of the disk.
Figure 29 shows examples of the broad H profiles with the model disk fit for a low-state ( = 190, = 540) and high-state ( = 260, = 620). Both disks have = 36, = 1600 km s-1 , and = 3. The spectra in the Appendix show the least-squares scaled circular disk models in comparison with the profiles. Spectra before 1998 were fitted with the low-state model disk, and after 1998 with the high-state model disk. The disk profiles match well the decrease in FWHM and peak velocity separation, but the high-state profile appears to underestimate the flux in the very far blue wing and overestimate the flux in the red wing from 1998 to 2001. Beginning in 2004 there also appears to be an excess in the blue side of the profile, near 4000 km s-1 , that is not accounted for by the disk model profile.
4.3.2 Precessing Spiral Arm?
The rise and fall of (R)/(B) from 1990 to 1998 was modeled by Gilbert et al. (1999) as a one-armed spiral emissivity enhancement with a pattern period of 14 yr. Although this model reproduces the behavior of (R)/(B) from 1990 to 1998, it does not match the historical (R)/(B) measurements in 1976 and 1978, and predicts a minimum in (R)/(B) in 2002, which is clearly not consistent with our continued monitoring of (R)/(B), which shows it to be nearly constant [(R)/(B) 0.9] for over 8 yr after 1997 (Figure 11). Thus the oscillation in (R)/(B) does not repeat, nor does it appear to be sinusoidal in shape.
The maximum in (R)/(B) in 1995 can be attributed to a transient excess in the red wing at +12,250 km s-1 with a FWHM 3500 km s-1 , and a maximum strength of 40% of the red peak. The excess in the red wing appears to drift to +10,800 km s-1 in 20 months. This excess may be related to the excess in the blue wing in 1999.46 with a width of 5000 km s-1 and a peak velocity of -11,900 km s-1 ; this could indicate a feature rotating with the disk that only completes one orbit before fading away in 2002. The maximum red velocity of the excess of +12,250 km s-1 at an assumed phase angle of 90 and an inclination of the disk of 36, corresponds to a bright spot at a radius of 280 . The excess in the blue wing appears to persist for longer than expected for an orbiting feature, and the excess near -4000 km s-1 does not occur when the bright spot would be expected to be traversing the central part of the profile.
4.4. PKS 0235+023
4.4.1 Circular Disk?
The broad H profile of PKS 0235+023 in 1991 is well fitted with a circular accretion disk model with km s-1 , and (Eracleous & Halpern 1994). The scaled disk model is shown in comparison with the profiles in the spectra in the Appendix. For all the spectra after 1991, the blue peak is shifted to a higher velocity, and the strength of the peak has increased in comparison to the disk model. In contrast, the red peak appears to have decreased in strength (and in some cases completely disappeared), and the red wing does not extend to very high velocities. Even if the centroid of the entire disk profile is shifted blueward, the circular disk model is not a good fit to the profiles after 1991.
4.5. Mkn 668
4.5.1 Binary Broad-Line Region?
The systematic drift of the central red peak of Mkn 668 could be interpreted as the result of the orbital motion of binary supermassive black holes with separate broad-line regions, in which the central peak is emission from the broad-line region of one of the orbiting black holes. Although the central red peak repeatedly drifts by 900 km s-1 from 1982 to 1985, and then by +900 km s-1 from 1985 to 1989, and then again by 1000 km s-1 from 1989 to 1995, the velocity of the peak remains +1700 km s-1 from 1995 to 2004. The velocity curve does not have a regular periodic shape, and the peak velocity never passes through zero velocity, and thus in the case of a binary, the velocity of its center of mass would not be coincident with the velocity of the host galaxy. Thus the shift of the red peak is not consistent with orbital motion of a binary broad-line region.
4.5.2 Radiatively Accelerated Outflow?
Marziani et al. (1993) reported a positive correlation between the peak velocity and the total broad-line flux for their spectra from 1985 to 1991. They then modeled the profiles as emission from a radiatively accelerated biconical outflow of clouds, in which the positive correlation between the peak velocity and the continuum flux is a consequence of radiative acceleration, and the asymmetry of the profile is attributed to self-absorption in the Balmer line or dust absorption from the backsides of the clouds in the outflow. Although from 1989 to 1996 the peak velocity and total broad-line flux decrease monotonically, we find that after 2000 this correlation breaks down. During a high state of broad-line flux in 2001–2002, during which the flux increases by a factor of 6, the central peak remains at a minimum peak velocity of +1700 km s-1 . Thus the large-amplitude changes of the velocity of the peak are irregular, and are unrelated to the changes in the broad-line flux. The radiatively accelerated outflow model is thus no longer observationally motivated.
4.5.3 Elliptical Accretion Disk with an Added Perturbation?
Figure 30 shows that the shift in the red central peak can be modeled as a Gaussian excess at a peak velocity of +3300 km s-1 and a FWHM 2000 km s-1 in 1990–1995 that drifts to a peak velocity of 1800 km s-1 in 1996–2000, and then back to a peak velocity of +4400 km s-1 in 2003. We were able to fit the non-varying portion of the profile with an eccentric disk, with km s-1 , , and (shown in blue in Figure 30). The maximum radial velocity of the excess and the inclination of the disk fit can be used to determine the radius of the excess in gravitational radii. The maximum redshifted radial velocity for a disk with an inclination of and an eccentricity of 0.6 occurs at a phase angle of the excess of (determined from the Doppler factor of an eccentric disk from equation 15 in Eracleous et al. 1995). Thus, for a maximum red radial velocity of +3300 km s-1 , this corresponds to a radius of 2125 . The maximum blueshifted radial velocity for an excess at this radius would then occur at and is -4300 km s-1 . The observed time for the peak to shift from the maximum red velocity to a maximum blue velocity corresponds to an orbital period 12 yr. This model yields a central black hole mass from equation 4 of 1.2 x 10⁸ . The velocity curve of a feature orbiting in the eccentric disk at a radius of 2125 is shown in comparison with the peak velocities of the Gaussian fits to the excess above the model disk profile in Figure 31. The period of the velocity curve has been fixed to 12 yr. It is clear that the observed blue velocity of the feature does not match the amplitude of the model velocity curve, and when the excess returns to the red side of the disk, the radial velocity is too large. In general, the velocity of the excesses appears step-like, and not smooth, as would be expected for projected orbital motion. The historical velocity curve suggests that there was an excess in the red side of the central peak from 1974 to 1982. This would be consistent with an excess that oscillates, non-sinusoidally, from one side of the peak to another with a period of 12–16 yr.
4.6. 3C 227
4.6.1 Orbiting Bright Spot?
The complex profile of 3C 227 cannot be modeled with a single disk component (circular or elliptical), since the profile has a low-velocity blue peak as well as a high-velocity blue shelf. The changes in the shape of the profile from 1990–1996 to 1999–2004 can be modeled as a sum of two Gaussians, one with a peak velocity of 2400 km s-1 and a FWHM 1500 km s-1 plus a Gaussian at a velocity of 5000 km s-1 and a FWHM 2500 km s-1 , The two Gaussians drift to the red side of the profile to peak velocities of +1900 and +4800 km s-1 , respectively, from 1990 to 2000 (Figure 32). Since the feature is present in the blue peak starting in 1974, this would imply a lifetime of the feature in the blue peak of 14 yr. If the feature were orbiting from the blue side of the profile to the red side, then the time it takes for it to complete half an orbit, 5 yr, is inconsistent with its persistence in the blue peak from 1974 to 1990. Thus, although the feature appears to drift across the profile, this drift is not consistent with rotation.
4.7. 3C 382: Elliptical Accretion Disk?
The broad H profile of 3C 382 was successfully modeled with an elliptical disk by Eracleous et al. (1995), with km s-1 , , and . This disk profile scaled to the total broad line flux is shown in comparison with the observed profiles in the spectra in the Appendix. Although the disk model fits very well for most of the observations, the drop in the red peak of the profile in 1994–1995, with no corresponding change in the blue peak, is not behavior easily produced with a disk. An orbiting emissivity enhancement in the disk that increases the strength of the red peak would be expected to traverse the profile and subsequently increase the strength of the blue peak. It is possible that the perturbation moves slowly in the azimuthal direction, and dissipates before it can affect the other peak. This may also be the case for the transient bumps that only appear in the far blue wing. However, the large amplitude increase in the red wing that subsequently occurs in the blue wing may be the consequence of an orbiting feature in the inner region of the disk, such as a bright spot or spiral arm. However, the excesses in the wings do not appear to traverse the lower velocity portions of the profile, which is not consistent with rotation. The relative constancy of the central part of the profile well fitted by the elliptical disk profile can be used to place a lower limit to the black hole mass, since the lack of precession of the elliptical disk profile over 15 yr of the monitoring program implies .
5. Summary and Discussion
The (R)/(B) oscillation in Arp 102B that occurred from 1991 to 1995, recurs in 1999 to 2004 with the same period. The period of the oscillations is on the dynamical timescale, and is much shorter than the precession period of a spiral arm, eccentric disk, or warp. Modeling the recurring oscillation as a single transient bright spot yields discrepant central black hole mass estimates. Thus, the excess in the profile that drifts from one side to the other may be the result of a more complex, and non-stable configuration of emissivity enhancements such as transient shocks induced by tidal perturbations. We do not find strong evidence for phase effects in the residuals of the line profiles during the oscillation of the emissivity enhancements from one side of the profile to the other, and therefore we disfavor the configuration of a collection of clouds orbiting in a disk proposed by S00. The relatively slow changes in the wings of the profile can be reproduced by changing the inner and outer radii of the line-emitting portion of the disk. In the self-consistent photoionized accretion disk model of Chen & Halpern (1989), the inner radius of the line-emitting portion of the accretion disk is determined by the boundary between the thin disk and the elevated structure illuminating the outer portions of the disk in the form of an ion torus or a radiatively inefficient accretion flow (RIAF; see Narayan et al. 1998). The outer radius is determined by the radius at which the disk is no longer stable to self-gravity, and the disk fragments. It is interesting that both of these radii are sensitive to the accretion rate. The timescale for changes in the accretion rate is on the viscous timescale. This timescale is orders of magnitude longer than the timescale of the observed variations in the radii of the disk. Thus changes in the accretion rate cannot be physically driving the changes in radii.
The successful fit of an eccentric disk to the non-variable portion of the profile of Mkn 668 makes it tempting to attribute its oscillation of (R)/(B) to an orbiting emissivity enhancement. The velocity curve of the residuals from the disk profile model are not consistent with the velocity curve predicted for a feature orbiting in the outskirts of the disk. The historical velocity curve indicates that the oscillation of (R)/(B) and the central peak velocity is erratic, and not a regular phenomenon. We find that the correlation between total broad-line flux and peak velocity reported by Marziani et al. (1993) is not compatible with the high state profiles observed in later spectra, during which the peak velocity remained at a minimum. Thus, the radiatively accelerated outflow model for the source of the double-peaked emission line is no longer observationally motivated. An orbiting binary is also ruled out because of the irregularity of the peak velocity curve, and the fact that the radial velocity of the central peak never crosses zero velocity, requiring the velocity of the center of mass of the binary to not be coincident with that of the host nucleus. The sharp decrease of the velocity of the blue peak of 3C 227 appears to be caused by an excess feature in the blue peak that traverses from one side of the profile to the other. The inferred orbital period of the feature of 10 yr, however, is inconsistent with the persistence of the feature in the blue peak for over 15 yr before drifting to the red side of the profile.
The decrease in FWHM and peak velocity separation of the profile shape of 3C 332 during its high-state of broad-line flux is well accounted for by the circular disk model, and is similar to the behavior reported in NGC 1097, for which the peak velocity separation increased during a low-state in broad-line flux. Arp 102B, on the other hand, demonstrates a peculiar, asymmetric response to flares in the broad-line flux, that are not compatible with a simple response of the disk to a changing illumination. The repeated tendency of the blue H peak to be stronger and narrower during high-states of flux also makes a random asymmetric gravitational lensing event an unlikely explanation.
Sharp features that appear in the blue peak of the broad H profiles of Arp 102B and 3C 390.3 are narrow ( 1000 km s-1 ), and persist for months to years. The relatively stationary velocities of the features are inconsistent with orbital motion within the disk, and require a well-organized velocity field. Stellar collisions with the accretion disk are expected to be frequent (several per day) and should produce a shock in the disk that can emit X-ray emission (Nayakshin et al. 2004), as well as remove a narrow plume of material. The expelled gas could produce the transient narrow features observed in the profiles, although the rate of such events is not consistent with the persistence of features over months and years. The appearance of the features preferentially in the blue peak of the profiles suggest that their blueshift may be a signature of an outflow. This would be expected from stellar collisions, since we would preferentially see the plumes raised over the surface of the disk.
3C 390.3 displays a large amplitude of profile variability, with five coherent regions of the profile that appear to vary on the timescale of decades, and with no clear periodic correlation between each other. Even more difficult to model is the sharpening of the blue peak, and the dramatic flattening of the red peak and decrease in the red wing to produce a sharp shelf after 1995. Although a circular disk model provides a reasonable fit to the line profile in 1988, the subsequent changes in the profile shape make an acceptable fit to a circular disk model rather difficult. The excellent circular disk fit to PKS 0235+023 in 1991 also breaks down for subsequent spectra, in which the shape of the profile changes drastically. Similarly, although an elliptical disk model provides an excellent fit for many of the profiles of 3C 382 during the monitoring program, the variability of the profile reveals inconsistencies with this simple disk model. The extreme variability seen in the red and blue wings is never detected in the lower velocity peaks of the profile, and although the red peak does show variability, the relative flux of the blue peak remains unchanged.
6. Conclusions
Of all the models discussed in the literature, the photoionized accretion disk is the most robust model for the origin of the double-peaked Balmer emission lines. The disk model provides an excellent fit to the line profiles with relatively few free parameters, and successfully predicts the observed properties of the UV emission lines. The accretion disk model is also compatible with the spatial scales of the broad line region measured from reverberation mapping experiments.
Variability adds an extra dimension to discerning the structure and kinematics of the broad-line gas, and probes the structure of the accretion disk, the most likely source of the line emission. Several models for physical processes in the accretion disk have been proposed to explain the ubiquitous profile variability of double-peaked emitters, including precessing eccentric disks and spiral arms, and orbiting bright spots. Individual spectra of the H profiles of six of the seven objects in this study are successfully fitted by line emission from a circular or elliptical accretion disk, however the variability of their line profiles reveals behavior that is not always consistent with the model predictions. There is no persistent, regular variability observed in the objects that would require a precessing elliptical disk, one-armed spiral, or warp. Although the timescale of the oscillation in the relative flux of the peaks of the profiles in many objects appears to occur on the orbital timescales estimated from the disk model fits to the profiles, the velocity curves of the residuals from the model profiles are often not consistent with the projected orbital motion of a bright spot. In many of the objects, longer-timescale systematic variability is seen in the wings of the profile that appears to be uncorrelated with the variability of the lower velocity regions of the profile may reflect changes in the emissivity of the inner accretion flow. The negative correlation between peak velocity separation and total broad-line flux observed in 3C 332 is well accounted for by the disk model, although the asymmetric response of the profile during high-states of flux in Arp 102B, and possibly 3C 390.3, is problematic. We find that, although the accretion disk remains the most favorable model for the origin of the double-peaked emission lines, most of the models for physical processes in the accretion disk, previously used in the literature to explain the variability of the profiles, break down when the baseline of spectroscopic monitoring is extended.
Our results suggest that future efforts to model the variability of double-peaked emission lines should explore more sophisticated models. More specifically, models in which the perturbations have short life times, as well as finite onset and decay times (on the order of a few dynamical times, months) are highly desirable. Another family of models that warrant careful consideration are “stochastic models.” In such models the observed variability is due to the collective effect of an ensemble of perturbations, such as shocks in the disk or spiral arms that are not continuous but rather are comprised of discrete segments.
A promising method to probe the structure and kinematics of the broad-line region is two-dimensional reverberation mapping. By measuring the time delay of the response of the broad emission line region to the ionizing continuum as a function of velocity, high fidelity velocity delay maps can be constructed to discriminate between different geometries and velocity fields for the broad-line gas (Horne et al. 2004). This method requires high temporal resolution, high throughput, and long and homogenous monitoring, which would be possible with a future dedicated satellite mission with a UV/optical spectrophotometer. In the meantime, a less demanding but important experiment would be to monitor a few double-peaked emitters on timescales shorter than the dynamical time (e.g. sampling every 1–2 weeks). Such observations could be carried out with 2–4m ground-based telescopes would probe phenomena such as the development and propagation of shocks in the disk. We have, in fact, seen evidence of such phenomena in our observations (see, e.g., §3.2 and Figure 9) but we were not able to follow them closely and study them in detail. Continued spectroscopic monitoring of double-peaked emitters will continue to provide challenges to our current understanding of the nature of the broad-line region in double-peaked emitters and AGNs in general.
References
- Adams et al. (1989) Adams, F. C. , Ruden, S. P. , & Shu, F. H. 1989, ApJ, 347, 959
- Armitage & Natarajan (2002) Armitage, J. E. & Natarajan, P. 2002, ApJ, 567, L9
- (3) Artymowicz, P. & Lubow, S. H. 1996, ApJ, 467, L77
- Baptista & Catalan (2000) Baptista, R. , Catalan, M. S. 2000, ApJ, 539
- Barth et al. (2001) Barth, A. J. , Ho, L. C. , Filippenko, A. V. , Rix, H. , & Sargent, W. L. W. 2001, ApJ, 546, 205
- Barth et al. (2002) Barth, A. J. , Ho, L. C. , & Sargent, W. L. W. 2002, AJ, 124, 2607
- Blandford & McKee (1982) Blandford, R. D. & McKee, C. F. 1982, ApJ, 255, 419
- Bower et al. (1996) Bower, G. A. , Wilson, A. S. , Heckman, T. M. , Magorrian, & Richstone, D. O. 1996, AJ, 111, 1901
- (9) Burbridge, E. M. & Burbgridge, G. R. 1971, ApJ, 163, L21
- Chakrabarti & Wiita (1993) Chakrabarti, S. & Wiita, P. J. 1993, ApJ, 411, 602
- Chakrabarti & Wiita (1994) Chakrabarti, S. & Wiita, P. J. 1994, ApJ, 434, 518
- Chen & Halpern (1989) Chen, K. & Halpern, J. P. 1989, ApJ, 344, 115
- Chen et al. (1989) Chen, K. , Halpern, J. P. , & Filippenko, A. V. 1989, ApJ, 339, 742
- (14) Collin-Souffrin, S. & Dumont, A. M. 1989, A&A, 213, 29
- Corbin (1997) Corbin, M. 1997, ApJ, 485, 517
- Davidson & Netzer (1979) Davidson, K. , & Netzer, H. 1979, Rev. Modern. Phys, 51, 715
- Dietrich et al. (1998) Dietrich, M. , et al. 1998, ApJS, 115, 185
- Dumont & Collin-Souffrin (1990a) Dumont, A. M. , & Collin-Souffrin, S. 1990a, Astr. Ap., 229, 302
- Dumont & Collin-Souffrin (1990b) Dumont, A. M. , & Collin-Souffrin, S. 1990b, Astr. Ap., 229, 313
- Dumont & Collin-Souffrin (1990c) Dumont, A. M. , & Collin-Souffrin, S. 1990c, Astr. Ap. Suppl. , 83, 71
- Eracleous & Halpern (1994) Eracleous, M. & Halpern, J. P. 1994, ApJS, 90, 1
- Eracleous & Halpern (2003) Eracleous, M. & Halpern, J. P. 2003, 599, 886
- Eracleous et al. (1997) Eracleous, M. , Halpern, J. P. , Gilbert, A. M. , Newman, J. A. & Filippenko, A. V. 1997, ApJ, 490, 21
- Eracleous et al. (1995) Eracleous, M. , Livio, M. , Halpern, J. P., & Storchi-Bergmann, T. 1995, ApJ, 438, 610
- Eracleous et al. (2004) Eracleous, M. , Halpern, J. P. , Storchi-Bergmann, T. , Filippenko, A. V. , Wilson, A. S. , & Livio, M. 2004, in IAU Symp. 222, The Interplay of Black Holes, Stars, and ISM in Galactic Nuclei, ed. T. Storchi-Bergmann, L. C. Ho, & H. R. Schmitt (Cambridge: Cambridge Univ. Press), 29
- Fukugita et al. (1996) Fukugita, M. , Ichikawa, T. , Gunn, J. E. , Doi, M. , Shimasaku, K. , & Schneider, D. P. 1996, ApJ, 111, 1748
- Gaskell (1983) Gaskell, C. M. 1983, in Quasars and Gravitational Lenses, Proc. 24th Liege Astrophysical Colloq. (Leige: Institut d’Astrophysique, Univ. Liege), 473
- Gaskell (1996) Gaskell, C. M. 1996, ApJ, 464, L107
- Gilbert et al. (1999) Gilbert, A. M. , Eracleous, M. , Filippenko, A. V. , & Halpern, J. P. 1999, in ASP Conf. Ser. 175: Structure and Kinematics of Quasar Broad Line Regions, ed. Gaskell, C. M. , Brandt, W. ,N. , Dietrich, M. , Dultzin-Hacyan, D. , & Eracleous, M. (San Francisco: ASP), 189
- Goad & Wanders (1996) Goad, M. & Wanders, I. 1996, ApJ, 469, 113
- Halpern (1990) Halpern, J. P. 1990, ApJ, 365, L51
- Halpern & Eracleous (1994) Halpern, J. P. & Eracleous, M. 1994, 433, L17
- Halpern et al. (1996) Halpern, J. P. , Eracleous, M. , Filippenko, A. V. , & Chen, K. 1996, ApJ, 464, 704
- Halpern & Filippenko (1988) Halpern, J. P. & Filippenko, J. P. 1988, Nature, 331, 46
- Ho et al. (2000) Ho, L. C. , Rudnick, G. , Rix, H. , Shields, J. C. , McIntosh, D. H. , Filippenko, A. V. , Sargent, W. L. W. , & Eracleous, M. 2000, ApJ, 541, 120
- Horne & Marsh (1986) Horne, K. & Marsh, T. R. 1986, MNRAS, 218, 761
- Horne et al. (2004) Horne, K. , Peterson, B. M. , Collier, S. J. , & Netzer, H. 2004, PASP, 116, 465
- Jackson et al. (1991) Jackson, N. , Penston, M. V. , & Perez, E. 1991, MNRAS, 248, 577
- Laughlin & Korchagin (1996) Laughlin, G. & Korchagin, V. 1996, ApJ, 460, 855
- Lewis et al. (2004) Lewis, K. , Eracleous, M. , Halpern, J. P. , & Storchi-Bergmann, T. 2004, in IAU Conf. 222, The Interplay of Black Holes, Stars, and ISM in Galactic Nuclei, ed. T. Storchi-Bergmann, L. C. Ho, & H. R. Schmitt (Cambridge: Cambridge Univ. Press), 107
- Lewis & Eracleous (2006) Lewis, K. & Eracleous, M. 2006, ApJ, in press (astro-ph/0601398)
- Lightman et al. (1979) Lightman, A. P. , Press, W. H. , Price, R. H. , & Teukolsky, S. A. 1979, Problem Book in Relativity and Gravitation (Princeton: Princeton Univ. Press)
- (43) Lynds, C. R. 1968, AJ, 73, 888
- Maloney et al. (1996) Maloney, P. R. , Begelman, M. C. , & Pringle, J. E. 1996, 472, 582
- Maoz et al. (1990) Maoz, D, et al. 1990, ApJ, 351, 75
- Maoz et al. (1991) Maoz, D. et al. 1991, ApJ, 367, 493
- Marziani et al. (1993) Marziani, P. , Sulentic, J. W. , Calvani, M. , Perez, E. , Moles, M. , & Penston, M. V. 1993, ApJ, 410, 56
- Mathews & Capriotti (1985) Mathews, W. G. & Capriotti, E. R. 1985, in Astrophysics of Active Galaxies and Quasi-Stellar Objects, ec. J. S. Miller (Mill Valley: University Science Books), p. 185
- Miller & Peterson (1990) Miller, J. S. & Peterson, B. M. 1990, ApJ, 361, 98
- Murray & Chiang (1997) Murray, N. & Chiang, J. 1997, ApJ, 474, 91
- (51) Narayan, R., Mahadevan, R., & Quataert, E. 1998, in The Theory of Black Hole Accretion Disks, ed. M. A. Abramowicz, G. Björnsson, & J. E. Pringle (Cambridge: Cambridge Univ. Press), 148
- (52) Natarajan, P. & Armitage, J. E. 1998, MNRAS, 309, 961
- (53) Natarajan, P. & Pringle, J. E. 1998, ApJ, 506, L97
- Nayakshin et al. (2004) Nayakshin, S. , Cuadra, J. , & Sunyaev, R. 2004, A&A, 413, 173
- Netzer (1978) Netzer, H. 1978, ApJ, 219, 822
- Newman et al. (1997) Newman, J. A. , Eracleous, M. , Filippenko, A. V. , & Halpern, J. P. 1997, ApJ, 485, 570
- O’Brien et al. (1998) O’Brien, P. et al. 1998, ApJ, 509, 163
- Oke (1987) Oke, J. B. 1987, in Superliminal Radio Sources, ed. Zensus, A. J. & Pearson, T. J. (Cambridge, UK: Cambridge University Press), 267
- (59) Oke, J. B. & Gunn, J. E. 1983, ApJ, 266, 713
- Osterbrock & Cohen (1979) Osterbrock, D. E. & Cohen, R. 1979, MNRAS, 187, 61
- Osterbrock, Koski, & Phillips (1975) Osterbrock, D. E. , Koski, A. T. , & Phillips, M. M. 1975, ApJ, 197, L41
- Osterbrock, Koski, & Phillips (1976) Osterbrock, D. E. , Koski, A. T. , & Phillips, M. M. 1976, ApJ, 206, 898
- Perez et al. (1988) Perez, E. , Mediavilla, E. , Penston, M. V. , Tadhunter, C. & Moles, M. 1988, MNRAS, 230, 353
- Peterson (1993) Peterson, B. M. 1993, PASP, 105, 247
- Peterson (1998) Peterson, B. M. 1998, PASP, 100, 18
- Peterson (2001) Peterson, B. M. 2001, in Advanced Lectures on the Starburst-AGN Connection, ed. I. Aretxaga, D. Kunth, & R. Mujica (Singapore: World Scientific), 3
- Popovic et al. (2001) Popovic, L. C. , Mediavilla, E. G. , & Munoz, J. A. 2001, A&A, 378, 295
- Rees (1988) Rees, M. 1988, Nature, 333, 523
- Rokaki et al. (1992) Rokaki, E. , Boisson, C. , & Collin-Souffrin, S. 1992, Astr. Ap., 253, 57
- (70) Romano, P., Marzianii, P., & Dultzin-Hacyan, D. 1998, ApJ, 495, 222
- Shakura & Sunyaev (1973) Shakura, N. I., & Sunyaev, R. A. 1973, A&A, 24, 337
- Shapovalova et al. (2001) Shapovalova, A. I. , et al. (2001), A&A, 376, 775
- Sergeev et al. (2000) Sergeev, S. G. , Pronik, V. I. , & Sergeeva, E. A. 2000, A&A, 356, 41
- Sergeev et al. (2002) Sergeev, S. G. , Pronik, V. I. , Peterson, B. M. , Sergeeva, E. A. , & Zheng, W. 2002, ApJ, 576, 660
- (75) Shields, G. A. 1977, ApJ, 18, L119
- Shields et al. (2000) Shields, J. C. , Rix, H. , McIntosh, D. H. , Ho, L. C. , Rudnick, G. , Filippenko, A. V. , Sargent, W. L. W. & Sarzi, M. 2000, ApJ, 534, L27
- Steeghs et al. (1997) Steeghs, D. , Harlaftis, E. T. , & Horne, K. 1997, MNRAS, 290, L28
- Stella (1990) Stella, L. 1990, Nature, 344,747
- Storchi-Bergmann et al. (1993) Storchi-Bergmann, T. , Baldwin, J. A. , & Wilson, A. S. 1993, ApJ, 410, L11
- Storchi-Bergmann et al. (1995) Storchi-Bergmann, T. , Eracleous, M. , Livio, M. , Wilson, A. S. , Filippenko, A. V. , & Halpern, J. P. 1995, ApJ, 443, 617
- Storchi-Bergmann et al. (1997) Storchi-Bergmann, T. , Eracleous, M., Ruiz, M. T. , Livio, M. , Wilson, A. S. , & FIlippenko, A. V. 1997, ApJ, 489, 87
- Storchi-Bergmann et al. (2003) Storchi-Bergmann, T. et al. 2003, ApJ, 598, 956
- Strateva et al. (2003) Strateva, I. V. et al. 2003, AJ, 126, 1720
- Tremaine et al. (2002) Tremaine, et al. 2002, ApJ, 574, 740
- Veilleux & Zheng (1991) Veilleux, S. & Zheng, W. 1991, ApJ, 377, 89
- York et al. (2000) York, D. G. 2000, AJ, 120, 1579
- Zheng et al. (1991) Zheng, W. , Veilleux, S. , & Grandi, S. A. 1991, ApJ, 381, 418
| Object | mV | z | E(B-V)aaGalactic reddening in magnitudes from Schlegel et al. (1998). |
|---|---|---|---|
| Arp 102B | 14.8 | 0.024 | 0.024 |
| 3C 390.3 | 15.4 | 0.056 | 0.071 |
| 3C 332 | 17.3 | 0.151 | 0.024 |
| PKS 0235+023 | 17.1 | 0.209 | 0.033 |
| Mkn 668 | 15.4 | 0.077 | 0.018 |
| 3C 227 | 16.3 | 0.086 | 0.026 |
| 3C 382 | 15.4 | 0.059 | 0.070 |
| UT Date | Exp Time | Telescope |
|---|---|---|
| (sec) | ||
| 1983 Jun 06 | … | Palomar 5m |
| 1983 Jun 21 | … | Palomar 5m |
| 1985 Jun 28 | … | Palomar 5m |
| 1986 Jul 13 | 3000 | Lick 3m |
| 1987 May 04 | 1000 | Lick 3m |
| 1987 Aug 08 | 1300 | Lick 3m |
| 1988 Jun 30 | … | Lick 3m |
| 1988 Jul 17 | … | Lick 3m |
| 1988 Sep 15 | … | Lick 3m |
| 1989 Apr 27 | 900 | Lick 3m |
| 1989 May 30 | … | Lick 3m |
| 1989 Jul 01 | 3600 | KPNO 2.1m |
| 1989 Jul 05 | 835 | KPNO 2.1m |
| 1989 Jul 10 | 900 | Lick 3m |
| 1990 Feb 23 | 5400 | KPNO 2.1m |
| 1990 May 01 | … | Lick 3m |
| 1990 Jun 14 | … | Lick 3m |
| 1990 Jul 17 | 1800 | Lick 3m |
| 1990 Jul 30 | … | Lick 3m |
| 1990 Aug 30 | 1800 | Lick 3m |
| 1990 Nov 11 | 1800 | Lick 3m |
| 1991 Jun 17 | 9790 | KPNO 2.1m |
| 1991 Jun 18 | 1897 | KPNO 2.1m |
| 1991 Jun 19 | 7200 | KPNO 2.1m |
| 1991 Jun 20 | 7200 | KPNO 2.1m |
| 1991 Jul 03 | 7200 | KPNO 2.1m |
| 1991 Jul 04 | 4950 | KPNO 2.1m |
| 1991 Aug 05 | 1500 | Lick 3m |
| 1991 Oct 31 | 1800 | Lick 3m |
| 1992 May 06 | 7200 | KPNO 2.1m |
| 1992 Oct 03 | 1800 | Lick 3m |
| 1992 Nov 19 | 1200 | Lick 3m |
| 1993 Apr 14 | 900 | Lick 3m |
| 1993 May 16 | 3600 | KPNO 2.1m |
| 1993 Jun 28 | 900 | Lick 3m |
| 1993 Jul 28 | 2100 | Lick 3m |
| 1993 Sep 10 | 3000 | Lick 3m |
| 1993 Sep 25 | 1800 | Lick 3m |
| 1993 Oct 22 | 1800 | Lick 3m |
| 1993 Nov 08 | 3000 | Lick 3m |
| 1994 Apr 18 | 1200 | Lick 3m |
| 1994 Jun 16 | 2700 | Lick 3m |
| 1994 Jul 04 | 3600 | KPNO 2.1m |
| 1994 Jul 05 | 3600 | KPNO 2.1m |
| 1994 Jul 15 | 3000 | Lick 3m |
| 1994 Aug 04 | 3600 | Lick 3m |
| 1994 Sep 03 | 3600 | Lick 3m |
| 1994 Oct 01 | 4800 | Lick 3m |
| 1994 Nov 12 | 3600 | Lick 3m |
| 1995 Jan 23 | 1800 | KPNO 2.1m |
| 1995 Mar 25 | 1500 | Lick 3m |
| 1996 Jun 02 | 3600 | KPNO 2.1m |
| 1995 Jun 03 | 3600 | KPNO 2.1m |
| 1995 Jun 04 | 3600 | KPNO 2.1m |
| 1995 Sep 26 | 1800 | Lick 3m |
| 1996 Feb 13 | 3200 | KPNO 2.1m |
| 1996 Apr 22 | 2400 | Lick 3m |
| 1996 Jun 13 | 1711 | KPNO 2.1m |
| 1996 Aug 10 | … | Lick 3m |
| 1996 Sep 10 | … | Lick 3m |
| 1996 Oct 10 | 2400 | Lick 3m |
| 1997 Feb 06 | 2700 | KPNO 2.1m |
| 1997 Jun 08 | 3600 | KPNO 2.1m |
| 1997 Aug 04 | … | Lick 3m |
| 1997 Sep 06 | … | Lick 3m |
| 1997 Sep 27 | 3600 | KPNO 2.1m |
| 1998 Jan 28 | 3000 | KPNO 2.1m |
| 1998 Apr 08 | 2700 | MDM 2.4m |
| 1998 May 19 | 3000 | KPNO 2.1m |
| 1998 Jun 27 | 3000 | MDM 2.4m |
| 1998 Jul 23 | … | Lick 3m |
| 1998 Sep 21 | … | Lick 3m |
| 1998 Oct 15 | 3000 | KPNO 2.1m |
| 1999 Jun 18 | 2000 | MDM 2.4m |
| 1999 Sep 12 | 2400 | MDM 2.4m |
| 2000 Jun 03 | 3000 | KPNO 2.1m |
| 2000 Sep 25 | 3600 | KPNO 2.1m |
| 2001 Jan 24 | 1500 | MDM 2.4m |
| 2001 Jul 20 | 3600 | KPNO 2.1m |
| 2001 Sep 20 | … | Lick 3m |
| 2001 Oct 23 | 2700 | KPNO 2.1m |
| 2002 Jan 08 | 1690 | MDM 2.4m |
| 2002 Mar 07 | … | Lick 3m |
| 2002 Apr 13 | 2700 | MDM 2.4m |
| 2002 Jun 03 | 300 | HET 9.2m |
| 2002 Jun 12 | 3600 | KPNO 2.1m |
| 2002 Oct 09 | 3600 | KPNO 2.1m |
| 2003 Jun 08 | 3590 | MDM 2.4m |
| 2004 Mar 29 | 2700 | MDM 2.4m |
| 2004 Jun 10 | 2700 | MDM 2.4m |
| 2004 Jun 22 | 300 | HET 9.2m |
| 2004 Aug 05 | 300 | HET 9.2m |
| 2004 Sep 21 | 2700 | MDM 2.4m |
| UT Date | Exp Time | Telescope |
|---|---|---|
| (sec) | ||
| 1988 Jul 9 | 1200 | KPNO 4m |
| 1989 Jul 01 | 1800 | KPNO 2.1m |
| 1989 Jul 02 | 1500 | KPNO 2.1m |
| 1990 Feb 22 | 1800 | KPNO 2.1m |
| 1990 May 30 | 2400 | KPNO 2.1m |
| 1991 Jun 18 | 3600 | KPNO 2.1m |
| 1991 Jun 20 | 3600 | KPNO 2.1m |
| 1991 Jun 21 | 3600 | KPNO 2.1m |
| 1991 Jul 03 | 3600 | KPNO 2.1m |
| 1991 Jul 04 | 3600 | KPNO 2.1m |
| 1991 Jul 05 | 5000 | KPNO 2.1m |
| 1992 May 06 | 2700 | KPNO 2.1m |
| 1994 Jul 03 | 2700 | KPNO 2.1m |
| 1994 Jul 05 | 3600 | KPNO 2.1m |
| 1995 Mar 25 | 3000 | KPNO 2.1m |
| 1995 Jun 04 | 3000 | KPNO 2.1m |
| 1995 Jun 05 | 3600 | KPNO 2.1m |
| 1996 Feb 15 | 3000 | KPNO 2.1m |
| 1996 Apr 21 | 1200 | Lick 3m |
| 1996 Jun 14 | 1831 | KPNO 2.1m |
| 1996 Oct 10 | 1800 | Lick 3m |
| 1997 Feb 06 | 1800 | KPNO 2.1m |
| 1997 Jun 08 | 2700 | KPNO 2.1m |
| 1997 Sep 28 | 2700 | KPNO 2.1m |
| 1998 Apr 08 | 1200 | MDM 2.4m |
| 1998 May 20 | 2540 | KPNO 2.1m |
| 1998 Jun 27 | 1800 | MDM 2.4m |
| 1998 Oct 14 | 2700 | KPNO 2.1m |
| 1999 Jun 18 | 1800 | MDM 2.4m |
| 1999 Sep 11 | 1200 | MDM 2.4m |
| 1999 Dec 02 | 1800 | KPNO 2.1m |
| 2000 Mar 16 | 3000 | MDM 1.3m |
| 2000 Jun 03 | 2400 | KPNO 2.1m |
| 2000 Sep 24 | 3000 | KPNO 2.1m |
| 2001 Jul 23 | 3600 | KPNO 2.1m |
| 2001 Oct 24 | 2700 | KPNO 2.1m |
| 2002 Jun 12 | 3000 | KPNO 2.1m |
| 2002 Oct 10 | 3000 | KPNO 2.1m |
| 2003 Jun 08 | 1800 | MDM 2.4m |
| 2004 Mar 28 | 1800 | MDM 2.4m |
| 2004 Jun 10 | 1800 | MDM 2.4m |
| 2004 Sep 21 | 1800 | MDM 2.4m |
| UT Date | Exp Time | Telescope |
|---|---|---|
| (sec) | ||
| 1990 May 28 | 2700 | KPNO 2.1m |
| 1990 May 30 | 2400 | KPNO 2.1m |
| 1990 Jun 12 | 2700 | Lick 3m |
| 1991 Feb 04 | 3000 | KPNO 2.1m |
| 1991 Feb 05 | 3000 | KPNO 2.1m |
| 1992 Jul 07 | 3200 | KPNO 2.1m |
| 1994 Jul 05 | 3600 | KPNO 2.1m |
| 1995 Jun 04 | 3600 | KPNO 2.1m |
| 1996 Feb 16 | 3600 | KPNO 2.1m |
| 1996 Apr 21 | 1800 | Lick 3m |
| 1996 Jun 15 | 3600 | KPNO 2.1m |
| 1997 Feb 07 | 3600 | KPNO 2.1m |
| 1997 Jun 09 | 3600 | KPNO 2.1m |
| 1998 Apr 09 | 3600 | MDM 2.4m |
| 1998 Jun 27 | 3600 | MDM 2.4m |
| 1998 Jun 28 | 3600 | MDM 2.4m |
| 1999 Jun 15 | 6000 | KPNO 2.1m |
| 2000 Jun 05 | 3600 | KPNO 2.1m |
| 2000 Sep 26 | 3600 | KPNO 2.1m |
| 2001 Jul 21 | 3600 | KPNO 2.1m |
| 2001 Jul 22 | 1008 | KPNO 2.1m |
| 2002 Apr 12 | 3600 | MDM 2.4m |
| 2002 Jun 14 | 3600 | KPNO 2.1m |
| 2002 Oct 11 | 3600 | KPNO 2.1m |
| 2003 Jun 07 | 4800 | MDM 2.4m |
| 2003 Jul 01 | 600 | HET 9.2m |
| 2004 Mar 28 | 6423 | MDM 2.4m |
| 2004 Jun 09 | 7200 | MDM 2.4m |
| 2004 Jun 22 | 600 | HET 9.2m |
| 2004 Aug 04 | 600 | HET 9.2m |
| UT Date | Exp Time | Telescope |
|---|---|---|
| (sec) | ||
| 1991 Feb 05 | 1800 | KPNO 2.1m |
| 1996 Oct 11 | 2400 | Lick 3m |
| 1997 Sep 29 | 3600 | KPNO 2.1m |
| 1998 Oct 13 | 3600 | KPNO 2.1m |
| 1999 Sep 13 | 3600 | MDM 2.4m |
| 1999 Dec 04 | 3600 | KPNO 2.1m |
| 2001 Jan 24 | 6000 | MDM 2.4m |
| 2001 Oct 25 | 7200 | KPNO 2.1m |
| 2002 Jan 08 | 3000 | MDM 2.4m |
| 2002 Jan 09 | 3600 | MDM 2.4m |
| 2002 Oct 11 | 3600 | KPNO 2.1m |
| 2002 Dec 28 | 900 | HET 9.2m |
| 2003 Oct 23 | 1800 | HET 9.2m |
| 2003 Dec 20 | 900 | HET 9.2m |
| 2004 Sep 09 | 1800 | HET 9.2m |
| 2004 Dec 13 | 900 | HET 9.2m |
| UT Date | Exp Time | Telescope |
|---|---|---|
| (sec) | ||
| 1989 Jul 03 | 1800 | KPNO 2.1m |
| 1990 Feb 22 | 1800 | KPNO 2.1m |
| 1990 May 30 | 2400 | KPNO 2.1m |
| 1995 Jan 21 | 1691 | KPNO 2.1m |
| 1995 Mar 25 | 3600 | KPNO 2.1m |
| 1995 Jun 04 | 3600 | KPNO 2.1m |
| 1996 Feb 14 | 3200 | KPNO 2.1m |
| 1997 Feb 07 | 2700 | KPNO 2.1m |
| 1997 Jun 09 | 2700 | KPNO 2.1m |
| 1998 Jan 29 | 3600 | KPNO 2.1m |
| 1998 Apr 08 | 1800 | MDM 2.4m |
| 1998 May 19 | 2700 | KPNO 2.1m |
| 1998 Jun 27 | 2000 | MDM 2.4m |
| 1999 Jun 15 | 2700 | KPNO 2.1m |
| 2000 Jun 03 | 2000 | KPNO 2.1m |
| 2001 Jan 24 | 1800 | MDM 2.4m |
| 2001 Jul 21 | 3000 | KPNO 2.1m |
| 2002 Jan 08 | 1800 | MDM 2.4m |
| 2003 Jan 26 | 4400 | MDM 1.3m |
| 2004 Mar 29 | 1800 | MDM 2.4m |
| 2004 Jun 09 | 1800 | MDM 2.4m |
| UT Date | Exp Time | Telescope |
|---|---|---|
| (sec) | ||
| 1990 Feb 22 | 7200 | KPNO 2.1m |
| 1993 Dec 13 | 1500 | KPNO 2.1m |
| 1995 Jan 23 | 3600 | KPNO 2.1m |
| 1995 Mar 24 | 3600 | KPNO 2.1m |
| 1996 Feb 15 | 3200 | KPNO 2.1m |
| 1997 Feb 06 | 3600 | KPNO 2.1m |
| 1998 Jan 29 | 3600 | KPNO 2.1m |
| 1998 May 20 | 2700 | KPNO 2.1m |
| 1998 Dec 20 | 2400 | MDM 2.4m |
| 1999 Dec 04 | 3600 | KPNO 2.1m |
| 2001 Jan 24 | 4800 | MDM 2.4m |
| 2002 Jan 08 | 2700 | MDM 2.4m |
| 2002 Jan 11 | 2700 | MDM 2.4m |
| 2002 Apr 12 | 2400 | MDM 2.4m |
| 2002 Dec 27 | 300 | HET 9.2m |
| 2003 Jan 26 | 4800 | MDM 1.3m |
| 2003 Apr 05 | 300 | HET 9.2m |
| 2003 Oct 31 | 300 | HET 9.2m |
| 2003 Dec 22 | 300 | HET 9.2m |
| 2004 Mar 28 | 2700 | MDM 2.4m |
| UT Date | Exp Time | Telescope |
|---|---|---|
| (sec) | ||
| 1989 Jul 02 | 1500 | KPNO 2.1m |
| 1989 Jul 04 | 1800 | KPNO 2.1m |
| 1989 Jul 05 | 1200 | KPNO 2.1m |
| 1990 May 30 | 2400 | KPNO 2.1m |
| 1991 Jun 18 | 3600 | KPNO 2.1m |
| 1991 Jun 20 | 3600 | KPNO 2.1m |
| 1991 Jun 21 | 3600 | KPNO 2.1m |
| 1994 Jul 05 | 2100 | KPNO 2.1m |
| 1995 Jun 05 | 1800 | KPNO 2.1m |
| 1996 Apr 21 | 1200 | Lick 3m |
| 1996 Apr 21 | 1200 | Lick 3m |
| 1996 Jun 14 | 442 | KPNO 2.1m |
| 1996 Oct 10 | 900 | Lick 3m |
| 1997 Mar 21 | 600 | MDM 2.4m |
| 1997 Jun 08 | 1200 | KPNO 2.1m |
| 1997 Sep 29 | 1800 | KPNO 2.1m |
| 1998 Apr 08 | 900 | MDM 2.4m |
| 1998 Jun 27 | 1200 | MDM 2.4m |
| 1998 Oct 15 | 1800 | KPNO 2.1m |
| 1999 Jun 15 | 1200 | KPNO 2.1m |
| 1999 Sep 11 | 900 | MDM 2.4m |
| 1999 Dec 03 | 1800 | KPNO 2.1m |
| 2000 Jun 04 | 1500 | KPNO 2.1m |
| 2000 Sep 25 | 1800 | KPNO 2.1m |
| 2001 Jul 21 | 1800 | KPNO 2.1m |
| 2001 Oct 23 | 1200 | KPNO 2.1m |
| 2002 Apr 12 | 1200 | MDM 2.4m |
| 2002 Jun 03 | 300 | HET 9.2m |
| 2002 Jun 13 | 2100 | KPNO 2.1m |
| 2002 Oct 10 | 1800 | KPNO 2.1m |
| 2003 Apr 01 | 300 | HET 9.2m |
| 2003 Jun 07 | 3600 | MDM 2.4m |
| 2004 Mar 29 | 1200 | MDM 2.4m |
| 2004 Jun 09 | 1200 | MDM 2.4m |
| 2004 Jun 25 | 300 | HET 9.2m |
| 2004 Sep 09 | 150 | HET 9.2m |
| UT Date | Flux | V(B) | P(B) | F(R)/F(B) | FWQM | QMS | QMC |
|---|---|---|---|---|---|---|---|
| (1) | (2) | (3) | (4) | (5) | (6) | (7) | (8) |
| 1983 Jun 06 | 21.00.6 | 5.0 | 0.0690.002 | 0.98 | 16.9 | 0.9 | 0.9 |
| 1983 Jun 21 | 21.00.6 | 5.0 | 0.0690.002 | 0.98 | 16.9 | 0.9 | 0.9 |
| 1985 Jun 28 | 16.60.6 | 4.8 | 0.0590.002 | 0.80 | 17.2 | 0.7 | 0.4 |
| 1986 Jul 13 | 19.10.8 | 5.2 | 0.0790.003 | 0.72 | 16.4 | 0.9 | 0.4 |
| 1987 May 04 | 231 | 4.8 | 0.0870.005 | 0.76 | 16.5 | 0.9 | 0.4 |
| 1987 Aug 08 | 20.30.8 | 4.9 | 0.0770.003 | 0.72 | 16.8 | 1.0 | 0.4 |
| 1988 Jun 30 | 13.80.7 | 5.4 | 0.0600.003 | 0.70 | 16.3 | 0.8 | 0.1 |
| 1988 Jul 17 | 13.90.9 | 5.2 | 0.0560.004 | 0.70 | 16.6 | 0.7 | 0.1 |
| 1988 Sep 15 | 16.00.7 | 5.3 | 0.0650.003 | 0.71 | 16.6 | 0.7 | 0.1 |
| 1989 Apr 27 | 17.10.9 | 5.0 | 0.0680.004 | 0.74 | 17.2 | 1.2 | 0.7 |
| 1989 May 30 | 14.70.7 | 5.3 | 0.0570.003 | 0.74 | 18.0 | 1.2 | 0.7 |
| 1989 Jul 01 | 14.40.7 | 5.2 | 0.0560.003 | 0.74 | 17.8 | 1.3 | 0.7 |
| 1989 Jul 05 | 19.80.6 | 5.2 | 0.0850.003 | 0.68 | 16.3 | 0.8 | 0.2 |
| 1989 Jul 10 | 182 | 5.2 | 0.0680.007 | 0.73 | 18.3 | 1.1 | 0.6 |
| 1990 Feb 23 | 14.80.6 | 5.3 | 0.0520.002 | 0.70 | 18.3 | 1.0 | 0.5 |
| 1990 May 01 | 13.70.6 | 5.0 | 0.0450.002 | 0.72 | 19.0 | 0.8 | 0.3 |
| 1990 May 30 | 15.10.9 | 5.0 | 0.0510.003 | 0.70 | 19.0 | 0.8 | 0.3 |
| 1990 Jun 14 | 13.80.8 | 5.3 | 0.0490.003 | 0.64 | 18.8 | 0.7 | 0.1 |
| 1990 Jul 17 | 171 | 5.1 | 0.0540.003 | 0.74 | 18.7 | 1.2 | 0.8 |
| 1990 Jul 30 | 12.40.7 | 5.1 | 0.0440.003 | 0.65 | 18.5 | 1.1 | 0.4 |
| 1990 Aug 30 | 14.70.7 | 5.0 | 0.0500.002 | 0.75 | 18.3 | 1.0 | 0.6 |
| 1990 Nov 11 | 161 | 4.7 | 0.0530.003 | 0.84 | 17.6 | 1.0 | 0.8 |
| 1991 Jun 17 | 12.50.5 | 5.4 | 0.0500.002 | 0.62 | 17.9 | 0.7 | 0.0 |
| 1991 Jun 18 | 13.60.5 | 5.5 | 0.0530.002 | 0.64 | 18.2 | 0.9 | 0.1 |
| 1991 Jun 19 | 13.80.5 | 5.5 | 0.0530.002 | 0.64 | 18.2 | 0.9 | 0.1 |
| 1991 Jun 20 | 14.60.6 | 5.5 | 0.0570.002 | 0.60 | 18.3 | 0.7 | 0.1 |
| 1991 Jul 03 | 12.90.5 | 5.5 | 0.0510.002 | 0.64 | 18.0 | 0.7 | 0.0 |
| 1991 Jul 04 | 12.40.5 | 5.5 | 0.0500.002 | 0.61 | 18.2 | 0.8 | 0.0 |
| 1991 Aug 05 | 16.90.5 | 5.2 | 0.0620.002 | 0.66 | 18.6 | 1.0 | 0.3 |
| 1991 Oct 31 | 12.90.7 | 5.4 | 0.0470.002 | 0.63 | 17.7 | 0.4 | 0.2 |
| 1992 May 06 | 17.00.8 | 5.2 | 0.0560.003 | 0.85 | 19.0 | 1.4 | 0.9 |
| 1992 Oct 03 | 13.00.6 | 5.2 | 0.0480.002 | 0.83 | 17.9 | 1.0 | 0.7 |
| 1992 Nov 19 | 151 | 5.1 | 0.0480.003 | 0.84 | 18.6 | 1.0 | 0.7 |
| 1993 Apr 14 | 14.00.7 | 5.1 | 0.0540.003 | 0.63 | 17.2 | 0.9 | 0.1 |
| 1993 May 16 | 13.90.8 | 5.0 | 0.0510.003 | 0.69 | 17.3 | 1.1 | 0.4 |
| 1993 Jun 28 | 16.40.6 | 5.0 | 0.0590.002 | 0.74 | 17.4 | 0.9 | 0.4 |
| 1993 Jul 28 | 14.90.7 | 5.1 | 0.0590.003 | 0.65 | 17.4 | 0.9 | 0.2 |
| 1993 Sep 10 | 15.70.6 | 5.2 | 0.0620.002 | 0.64 | 17.4 | 0.8 | 0.1 |
| 1993 Sep 25 | 18.20.8 | 5.1 | 0.0730.003 | 0.66 | 17.4 | 0.8 | 0.1 |
| 1993 Oct 22 | 15.10.6 | 5.2 | 0.0620.002 | 0.67 | 17.5 | 0.7 | 0.3 |
| 1993 Nov 08 | 15.40.6 | 5.3 | 0.0600.002 | 0.65 | 17.7 | 1.0 | 0.3 |
| 1994 Apr 18 | 14.10.6 | 5.1 | 0.0560.002 | 0.76 | 17.4 | 1.2 | 0.9 |
| 1994 Jun 16 | 17.30.7 | 5.3 | 0.0680.003 | 0.79 | 17.6 | 1.3 | 0.9 |
| 1994 Jul 04 | 15.10.6 | 5.4 | 0.0590.002 | 0.80 | 17.4 | 1.2 | 0.9 |
| 1994 Jul 05 | 15.80.6 | 5.4 | 0.0590.002 | 0.85 | 17.4 | 1.1 | 0.9 |
| 1994 Jul 15 | 16.20.8 | 5.3 | 0.0610.003 | 0.83 | 17.5 | 1.2 | 0.9 |
| 1994 Aug 04 | 18.70.7 | 5.3 | 0.0680.003 | 0.86 | 17.3 | 1.0 | 0.9 |
| 1994 Sep 03 | 15.90.8 | 5.3 | 0.0620.003 | 0.78 | 17.1 | 1.0 | 0.7 |
| 1994 Sep 08 | 15.90.8 | 5.3 | 0.0620.003 | 0.78 | 17.1 | 1.0 | 0.7 |
| 1994 Oct 01 | 15.30.7 | 5.3 | 0.0580.002 | 0.82 | 17.4 | 1.1 | 0.8 |
| 1994 Nov 12 | 14.50.9 | 5.3 | 0.0580.004 | 0.71 | 17.3 | 0.9 | 0.5 |
| 1995 Jan 23 | 14.80.6 | 5.2 | 0.0560.002 | 0.72 | 16.9 | 0.8 | 0.5 |
| 1995 Mar 25 | 15.30.7 | 5.2 | 0.0560.003 | 0.82 | 17.4 | 1.2 | 0.9 |
| 1995 Jun 02 | 15.20.6 | 5.1 | 0.0550.002 | 0.71 | 17.6 | 1.0 | 0.5 |
| 1995 Jun 03 | 16.50.5 | 5.1 | 0.0570.002 | 0.75 | 17.7 | 1.1 | 0.7 |
| 1995 Jun 04 | 16.50.5 | 5.1 | 0.0570.002 | 0.75 | 17.7 | 1.1 | 0.7 |
| 1995 Jul 06 | 13.40.8 | 5.1 | 0.0480.003 | 0.72 | 18.0 | 1.1 | 0.4 |
| 1995 Sep 26 | 12.70.7 | 5.0 | 0.0510.003 | 0.64 | 17.6 | 1.2 | 0.3 |
| 1996 Feb 13 | 16.30.6 | 4.8 | 0.0600.002 | 0.70 | 17.4 | 0.7 | 0.3 |
| 1996 Apr 22 | 12.80.3 | 4.8 | 0.0510.001 | 0.64 | 17.7 | 1.2 | 0.4 |
| 1996 Jun 13 | 14.20.8 | 5.1 | 0.0530.003 | 0.74 | 17.8 | 1.3 | 0.7 |
| 1996 Aug 10 | 171 | 5.2 | 0.0660.004 | 0.69 | 17.4 | 1.1 | 0.4 |
| 1996 Sep 10 | 13.40.6 | 5.3 | 0.0590.003 | 0.62 | 17.4 | 1.0 | 0.2 |
| 1996 Oct 10 | 14.30.7 | 5.3 | 0.0600.003 | 0.64 | 16.9 | 0.9 | 0.3 |
| 1997 Feb 06 | 12.70.6 | 5.3 | 0.0560.003 | 0.65 | 17.1 | 0.5 | 0.1 |
| 1997 Jun 08 | 14.10.6 | 5.2 | 0.0550.002 | 0.69 | 17.9 | 0.8 | 0.3 |
| 1997 Aug 04 | 15.20.8 | 5.3 | 0.0620.003 | 0.65 | 17.2 | 0.5 | 0.0 |
| 1997 Sep 06 | 161 | 5.3 | 0.0660.005 | 0.64 | 16.6 | 0.6 | 0.1 |
| 1997 Sep 27 | 18.50.7 | 5.3 | 0.0700.003 | 0.78 | 16.7 | 0.7 | 0.3 |
| 1998 Jan 28 | 211 | 5.0 | 0.0790.005 | 0.85 | 16.7 | 0.9 | 0.6 |
| 1998 Apr 08 | 21.00.9 | 5.1 | 0.0830.004 | 0.73 | 16.4 | 0.7 | 0.2 |
| 1998 May 19 | 19.80.6 | 5.2 | 0.0850.003 | 0.68 | 16.3 | 0.8 | 0.2 |
| 1998 Jun 27 | 312 | 5.2 | 0.1410.007 | 0.70 | 15.9 | 0.7 | 0.2 |
| 1998 Jul 23 | 232 | 4.8 | 0.0980.006 | 0.67 | 16.0 | 0.7 | 0.1 |
| 1998 Sep 21 | 17.70.8 | 4.9 | 0.0780.004 | 0.58 | 15.8 | 0.5 | 0.4 |
| 1998 Oct 15 | 23.30.8 | 4.9 | 0.0920.003 | 0.68 | 16.4 | 0.7 | 0.1 |
| 1999 Jun 18 | 17.00.7 | 5.1 | 0.0750.003 | 0.67 | 15.7 | 0.4 | 0.1 |
| 1999 Sep 12 | 17.00.6 | 5.0 | 0.0770.003 | 0.62 | 15.9 | 0.4 | 0.3 |
| 2000 Jun 03 | 16.80.7 | 5.0 | 0.0670.003 | 0.77 | 16.8 | 1.0 | 0.5 |
| 2000 Sep 25 | 15.50.8 | 5.1 | 0.0610.003 | 0.83 | 16.9 | 0.8 | 0.5 |
| 2001 Jan 24 | 14.60.8 | 5.0 | 0.0600.003 | 0.75 | 16.3 | 0.6 | 0.2 |
| 2001 Jul 20 | 13.30.7 | 5.0 | 0.0560.003 | 0.72 | 16.0 | 0.5 | 0.0 |
| 2001 Sep 20 | 14.10.7 | 5.1 | 0.0580.003 | 0.61 | 16.5 | 0.4 | 0.3 |
| 2001 Oct 23 | 13.50.5 | 5.0 | 0.0520.002 | 0.68 | 16.7 | 0.4 | 0.1 |
| 2002 Jan 08 | 13.80.7 | 5.0 | 0.0580.003 | 0.68 | 16.4 | 0.5 | 0.0 |
| 2002 Mar 07 | 13.90.8 | 4.9 | 0.0560.003 | 0.64 | 16.6 | 0.6 | 0.1 |
| 2002 Apr 13 | 16.10.6 | 5.0 | 0.0600.002 | 0.75 | 17.1 | 0.5 | 0.1 |
| 2002 Jun 03 | 131 | 5.1 | 0.0500.004 | 0.78 | 17.1 | 0.7 | 0.3 |
| 2002 Jun 12 | 15.80.7 | 5.0 | 0.0580.003 | 0.86 | 16.5 | 0.7 | 0.5 |
| 2002 Oct 09 | 13.10.6 | 5.0 | 0.0510.002 | 0.78 | 16.4 | 0.6 | 0.1 |
| 2003 Jun 08 | 15.50.7 | 5.2 | 0.0630.003 | 0.70 | 16.4 | 0.8 | 0.3 |
| 2004 Mar 29 | 121 | 5.1 | 0.0490.004 | 0.71 | 16.4 | 0.6 | 0.1 |
| 2004 Jun 10 | 14.00.7 | 5.1 | 0.0580.003 | 0.72 | 16.1 | 0.6 | 0.1 |
| 2004 Jun 22 | 11.50.7 | 5.1 | 0.0470.003 | 0.76 | 16.2 | 0.5 | 0.0 |
| 2004 Aug 05 | 11.80.7 | 5.2 | 0.0480.003 | 0.82 | 15.8 | 0.2 | 0.1 |
| 2004 Sep 21 | 13.80.6 | 5.0 | 0.0510.002 | 0.82 | 16.9 | 0.4 | 0.1 |
Note. — Col. (1): Date of observation. Col. (2): Flux of broad H relative to [O I] with 1 errors. Col. (3): Flux-weighted velocity centroid of top 10% of blue peak in units of 103 km s-1. Col. (4): Average flux in top 10% of blue peak relative to [O I] with 1 errors. Col. (5): Ratio of average flux in fixed velocity intervals corresponding to the top 10% of the red peak and blue peak in the mean profile. Col. (6): Full width at quarter-maximum in units of km s-1. Col. (7): Quarter-maximum shift measured from central velocity at quarter maximum in units of km s-1. Col. (8): Flux-weighted centroid at quarter-maximum in units of km s-1
| UT Date | Flux | V(R) | V(B) | P(R) | P(B) | F(R)/F(B) | FWQM | QMS | QMC |
|---|---|---|---|---|---|---|---|---|---|
| (1) | (2) | (3) | (4) | (5) | (6) | (7) | (8) | (9) | (10) |
| 1988 Jul 9 | 293 | 4.3 | 2.8 | 0.090.01 | 0.120.01 | 0.77 | 13.9 | 0.8 | 0.5 |
| 1989 Jul 01 | 451 | 4.1 | 3.6 | 0.1360.003 | 0.2070.005 | 0.63 | 13.5 | 0.4 | 0.1 |
| 1989 Jul 02 | 501 | 4.1 | 3.5 | 0.1500.003 | 0.2240.005 | 0.63 | 13.3 | 0.3 | 0.1 |
| 1990 Feb 22 | 534 | 4.2 | 3.4 | 0.160.01 | 0.230.02 | 0.63 | 13.3 | 0.1 | 0.2 |
| 1990 May 30 | 451 | 4.1 | 3.2 | 0.1340.003 | 0.2110.005 | 0.59 | 13.0 | 0.2 | 0.2 |
| 1991 Jun 18 | 482 | 4.3 | 3.1 | 0.1470.007 | 0.210.01 | 0.68 | 13.1 | 0.1 | 0.1 |
| 1991 Jun 20 | 471 | 4.4 | 3.1 | 0.1430.003 | 0.2080.005 | 0.68 | 13.4 | 0.3 | 0.0 |
| 1991 Jun 21 | 512 | 4.3 | 3.2 | 0.1520.007 | 0.220.01 | 0.67 | 13.5 | 0.4 | 0.0 |
| 1991 Jul 03 | 502 | 4.4 | 3.2 | 0.1560.007 | 0.220.01 | 0.70 | 13.4 | 0.5 | 0.1 |
| 1991 Jul 04 | 503 | 4.3 | 3.2 | 0.1480.008 | 0.220.01 | 0.67 | 13.3 | 0.3 | 0.0 |
| 1991 Jul 05 | 523 | 4.4 | 3.2 | 0.1560.008 | 0.230.01 | 0.68 | 13.5 | 0.3 | 0.0 |
| 1992 May 06 | 585 | 4.2 | 3.4 | 0.180.01 | 0.260.02 | 0.68 | 13.0 | 0.1 | 0.2 |
| 1994 Jul 03 | 352 | 4.2 | 3.3 | 0.1150.007 | 0.170.01 | 0.68 | 13.4 | 0.5 | 0.0 |
| 1994 Jul 05 | 342 | 4.2 | 3.4 | 0.1130.005 | 0.1670.007 | 0.69 | 13.4 | 0.5 | 0.1 |
| 1995 Mar 25 | 423 | 4.4 | 3.3 | 0.1410.009 | 0.190.01 | 0.74 | 14.5 | 1.1 | 0.5 |
| 1995 Jun 04 | 382 | 4.3 | 3.4 | 0.1340.005 | 0.1800.007 | 0.74 | 14.1 | 0.9 | 0.3 |
| 1995 Jun 05 | 422 | 4.2 | 3.3 | 0.1450.007 | 0.1900.009 | 0.76 | 14.3 | 1.0 | 0.4 |
| 1996 Feb 15 | 562 | 4.0 | 2.7 | 0.1930.008 | 0.2180.009 | 0.82 | 14.2 | 0.6 | 0.3 |
| 1996 Apr 21 | 471 | 4.0 | 2.9 | 0.1610.004 | 0.1920.005 | 0.78 | 13.6 | 0.3 | 0.0 |
| 1996 Oct 10 | 493 | 3.8 | 2.9 | 0.160.01 | 0.230.01 | 0.69 | 13.6 | 0.4 | 0.0 |
| 1997 Feb 06 | 474 | 3.3 | 3.0 | 0.140.01 | 0.220.02 | 0.61 | 13.3 | 0.3 | 0.2 |
| 1997 Jun 08 | 402 | 3.3 | 3.2 | 0.1170.006 | 0.190.01 | 0.60 | 14.3 | 0.7 | 0.0 |
| 1997 Sep 28 | 411 | 3.2 | 3.2 | 0.1210.003 | 0.1930.005 | 0.60 | 14.4 | 0.8 | 0.0 |
| 1998 Apr 08 | 431 | 3.6 | 3.2 | 0.1240.003 | 0.1980.005 | 0.64 | 14.4 | 0.6 | 0.1 |
| 1998 May 20 | 496 | 3.6 | 3.1 | 0.150.02 | 0.220.03 | 0.66 | 14.7 | 0.8 | 0.0 |
| 1998 Jun 27 | 585 | 3.8 | 3.2 | 0.180.01 | 0.250.02 | 0.71 | 14.9 | 0.8 | 0.2 |
| 1998 Oct 14 | 514 | 3.2 | 3.4 | 0.140.01 | 0.240.02 | 0.58 | 14.7 | 0.6 | 0.2 |
| 1999 Jun 18 | 403 | 2.8 | 3.3 | 0.1180.009 | 0.200.02 | 0.53 | 14.9 | 0.7 | 0.2 |
| 1999 Sep 11 | 402 | 3.0 | 3.4 | 0.1100.006 | 0.190.01 | 0.54 | 14.9 | 0.5 | 0.3 |
| 1999 Dec 02 | 394 | 3.0 | 3.4 | 0.120.01 | 0.190.02 | 0.59 | 14.9 | 0.4 | 0.3 |
| 2000 Mar 16 | 464 | 3.7 | 3.4 | 0.140.01 | 0.220.02 | 0.65 | 15.1 | 0.4 | 0.2 |
| 2000 Jun 03 | 494 | 3.6 | 3.5 | 0.140.01 | 0.230.02 | 0.62 | 14.8 | 0.3 | 0.3 |
| 2000 Sep 24 | 492 | 3.7 | 3.6 | 0.1390.007 | 0.240.01 | 0.61 | 14.0 | 0.0 | 0.4 |
| 2001 Jul 23 | 423 | 3.7 | 3.5 | 0.1270.008 | 0.210.01 | 0.64 | 14.8 | 0.4 | 0.1 |
| 2001 Oct 24 | 342 | 3.0 | 3.5 | 0.1130.006 | 0.190.01 | 0.61 | 13.9 | 0.3 | 0.7 |
| 2002 Jun 12 | 322 | 3.4 | 3.1 | 0.1080.006 | 0.1570.009 | 0.69 | 14.3 | 0.1 | 0.3 |
| 2002 Oct 10 | 412 | 3.5 | 3.3 | 0.1420.008 | 0.210.01 | 0.70 | 13.5 | 0.1 | 0.3 |
| 2003 Jun 08 | 444 | 3.5 | 3.2 | 0.140.01 | 0.200.02 | 0.66 | 13.8 | 0.1 | 0.5 |
| 2004 Mar 28 | 668 | 3.4 | 3.7 | 0.190.02 | 0.360.04 | 0.56 | 13.3 | 0.1 | 0.7 |
| 2004 Jun 10 | 574 | 3.7 | 3.3 | 0.180.01 | 0.300.02 | 0.61 | 13.7 | 0.2 | 0.4 |
| 2004 Sep 21 | 635 | 3.6 | 3.3 | 0.190.01 | 0.330.03 | 0.61 | 13.8 | 0.1 | 0.5 |
Note. — Col. (1): Date of observation. Col. (2): Flux of broad H relative to [O I] with 1 errors. Col. (3-4): Flux-weighted velocity centroid of top 10% of the red peak and blue peak in units of 103 km s-1. Col. (5-6): Average flux in top 10% of the red peak and blue peak relative to [O I] with 1 errors. Col. (7): Ratio of average flux in fixed velocity intervals corresponding to the top 10% of the red peak and blue peak in the mean profile. Col. (8): Full width at quarter-maximum in units of km s-1. Col. (9): Quarter-maximum shift measured from central velocity at quarter maximum in units of km s-1. Col. (10): Flux-weighted centroid at quarter-maximum in units of km s-1
| UT Date | Flux | V(R) | V(B) | P(R) | P(B) | F(R)/F(B) | FWHM | HMS | HMC |
|---|---|---|---|---|---|---|---|---|---|
| (1) | (2) | (3) | (4) | (5) | (6) | (7) | (8) | (9) | (10) |
| 1990 May 28 | 6.80.4 | 8.9 | 7.4 | 0.0200.001 | 0.0240.001 | 0.64 | 21.8 | 1.3 | 0.6 |
| 1990 May 30 | 9.70.6 | 11.4 | 7.5 | 0.0270.002 | 0.0330.002 | 0.66 | 22.4 | 1.3 | 0.4 |
| 1990 Jun 12 | 12.10.4 | 9.4 | 8.3 | 0.0350.001 | 0.0480.002 | 0.68 | 20.2 | 0.9 | 0.2 |
| 1991 Feb 04 | 5.70.3 | 8.6 | 7.4 | 0.0120.001 | 0.0170.001 | 0.80 | 23.3 | 1.9 | 1.1 |
| 1991 Feb 05 | 5.90.3 | 9.6 | 7.6 | 0.0120.001 | 0.0180.001 | 0.72 | 22.6 | 1.5 | 0.8 |
| 1992 Jul 07 | 6.60.4 | 10.2 | 7.5 | 0.0140.001 | 0.0170.001 | 0.88 | 23.9 | 1.8 | 1.6 |
| 1994 Jul 05 | 6.40.4 | 9.9 | 7.0 | 0.0180.001 | 0.0130.001 | 1.20 | 23.7 | 1.8 | 2.6 |
| 1995 Jun 04 | 10.80.4 | 11.2 | 6.0 | 0.0280.001 | 0.0270.001 | 1.01 | 24.2 | 2.1 | 2.5 |
| 1996 Feb 16 | 11.10.4 | 10.1 | 6.9 | 0.0270.001 | 0.0280.001 | 0.90 | 24.0 | 1.6 | 1.8 |
| 1996 Apr 21 | 9.70.4 | 10.2 | 6.9 | 0.0260.001 | 0.0250.001 | 0.86 | 24.0 | 1.5 | 1.5 |
| 1996 Jun 15 | 10.20.4 | 9.8 | 7.1 | 0.0260.001 | 0.0240.001 | 1.01 | 24.5 | 1.6 | 2.0 |
| 1997 Feb 07 | 10.20.4 | 10.0 | 7.4 | 0.0220.001 | 0.0270.001 | 0.84 | 23.3 | 1.5 | 1.4 |
| 1997 Jun 09 | 10.40.4 | 9.6 | 7.1 | 0.0240.001 | 0.0280.001 | 0.80 | 22.8 | 1.2 | 1.0 |
| 1998 Apr 09 | 17.00.6 | 8.0 | 7.1 | 0.0360.001 | 0.0460.002 | 0.81 | 21.6 | 0.9 | 0.5 |
| 1998 Jun 27 | 18.50.7 | 7.9 | 7.1 | 0.0410.002 | 0.0490.002 | 0.83 | 21.7 | 0.8 | 0.4 |
| 1998 Jun 28 | 16.10.6 | 8.2 | 7.0 | 0.0360.001 | 0.0410.002 | 0.87 | 21.9 | 0.8 | 0.5 |
| 1999 Jun 15 | 362 | 8.1 | 6.0 | 0.0850.005 | 0.0830.005 | 0.90 | 20.6 | 0.5 | 0.3 |
| 2000 Jun 05 | 321 | 7.4 | 5.5 | 0.0720.003 | 0.0800.003 | 0.88 | 20.8 | 0.1 | 0.4 |
| 2000 Sep 26 | 33.40.6 | 7.5 | 5.6 | 0.0740.001 | 0.0860.002 | 0.85 | 20.0 | 0.6 | 0.3 |
| 2001 Jul 21 | 18.30.6 | 8.8 | 5.6 | 0.0410.001 | 0.0490.002 | 0.77 | 20.2 | 0.4 | 0.0 |
| 2001 Jul 22 | 26.40.8 | 8.0 | 5.3 | 0.0610.002 | 0.0770.002 | 0.76 | 19.7 | 0.6 | 0.1 |
| 2002 Apr 12 | 333 | 7.5 | 5.4 | 0.0760.006 | 0.0760.006 | 0.93 | 20.0 | 0.6 | 0.2 |
| 2002 Jun 14 | 18.90.6 | 7.9 | 5.8 | 0.0410.001 | 0.0450.002 | 0.88 | 20.7 | 0.6 | 0.3 |
| 2002 Oct 11 | 261 | 7.9 | 6.2 | 0.0590.002 | 0.0630.002 | 0.89 | 20.8 | 0.7 | 0.4 |
| 2003 Jun 07 | 434 | 7.3 | 5.7 | 0.110.01 | 0.120.01 | 0.81 | 21.1 | 0.2 | 0.1 |
| 2003 Jul 01 | 492 | 7.3 | 5.3 | 0.1200.005 | 0.1150.004 | 0.95 | 19.8 | 0.8 | 0.5 |
| 2004 Mar 28 | 353 | 7.1 | 5.0 | 0.0720.005 | 0.0950.007 | 0.79 | 20.0 | 1.2 | 0.6 |
| 2004 Jun 09 | 596 | 7.6 | 5.2 | 0.140.01 | 0.160.02 | 0.81 | 19.6 | 1.0 | 0.3 |
| 2004 Jun 22 | 462 | 7.6 | 5.0 | 0.1060.004 | 0.1190.005 | 0.91 | 20.0 | 1.1 | 0.7 |
| 2004 Aug 04 | 371 | 7.9 | 5.1 | 0.0830.003 | 0.0960.003 | 0.87 | 19.9 | 1.2 | 0.8 |
Note. — Col. (1): Date of observation. Col. (2): Flux of broad H relative to narrow H with 1 errors. Col. (3-4): Flux-weighted velocity centroid of top 10% of the red peak and blue peak in units of 103 km s-1. Col. (5-6): Average flux in top 10% of the red peak and blue peak relative to narrow H with 1 errors. Col. (7): Ratio of average flux in fixed velocity intervals corresponding to the top 10% of the red peak and blue peak in the mean profile. Col. (8): Full width at half-maximum in units of km s-1. Col. (9): Half-maximum shift measured from central velocity at half maximum in units of km s-1. Col. (10): Flux-weighted centroid at half-maximum in units of km s-1
| UT Date | Flux | V(B) | P(B) | F(R)/F(B) | FWQM | QMS | QMC |
|---|---|---|---|---|---|---|---|
| (1) | (2) | (3) | (4) | (5) | (6) | (7) | (8) |
| 1991 Feb 05 | 9.00.9 | 3.6 | 0.0340.003 | 1.37 | 14.7 | 0.3 | 0.2 |
| 1996 Oct 11 | 7.90.8 | 4.3 | 0.0300.003 | 0.70 | 14.6 | 1.3 | 1.3 |
| 1997 Sep 29 | 3.80.4 | 4.4 | 0.0200.002 | 0.52 | 13.5 | 1.5 | 2.1 |
| 1998 Oct 13 | 7.10.7 | 4.7 | 0.0420.004 | 0.52 | 12.0 | 1.0 | 1.7 |
| 1999 Sep 13 | 121 | 4.7 | 0.0590.006 | 0.56 | 12.9 | 1.0 | 1.5 |
| 1999 Dec 04 | 8.40.8 | 4.5 | 0.0460.004 | 0.67 | 13.5 | 0.1 | 0.9 |
| 2001 Jan 24 | 7.30.7 | 4.1 | 0.0360.003 | 0.67 | 13.4 | 0.8 | 1.4 |
| 2001 Oct 25 | 151 | 4.7 | 0.0660.006 | 0.71 | 13.8 | 0.7 | 1.2 |
| 2002 Jan 09 | 111 | 4.6 | 0.0520.005 | 0.70 | 14.5 | 0.4 | 1.1 |
| 2002 Oct 11 | 172 | 4.5 | 0.0660.006 | 0.77 | 14.7 | 0.7 | 1.0 |
| 2002 Dec 28 | 8.20.8 | 4.2 | 0.0360.003 | 0.75 | 14.4 | 1.0 | 1.4 |
| 2003 Oct 23 | 131 | 4.6 | 0.0510.005 | 0.76 | 15.7 | 1.5 | 1.5 |
| 2003 Dec 20 | 121 | 4.9 | 0.0460.004 | 0.74 | 15.2 | 1.6 | 1.5 |
| 2004 Sep 09 | 121 | 4.9 | 0.0540.005 | 0.72 | 14.3 | 1.1 | 1.4 |
| 2004 Dec 13 | 5.40.5 | 5.0 | 0.0280.003 | 0.68 | 13.8 | 1.3 | 1.7 |
Note. — Col. (1): Date of observation. Col. (2): Flux of broad H relative to narrow H with 1 errors. Col. (3): Flux-weighted velocity centroid of top 10% of blue peak in units of 103 km s-1. Col. (4): Average flux in top 10% of blue peak relative to narrow H with 1 errors. Col. (5): Ratio of integrated flux in fixed velocity intervals corresponding to the regions of variability in the red and blue sides of the rms profile. Col. (6): Full width at quarter-maximum in units of km s-1. Col. (7): Quarter-maximum shift measured from central velocity at quarter maximum in units of km s-1. Col. (8): Flux-weighted centroid at quarter-maximum in units of km s-1
| UT Date | Flux | V(R) | P(R) | F(R)/F(B) | FWQM | QMS | QMC |
|---|---|---|---|---|---|---|---|
| (1) | (2) | (3) | (4) | (5) | (6) | (7) | (8) |
| 1989 Jul 03 | 221 | 2.7 | 0.1210.006 | 2.16 | 11.6 | 0.5 | 0.4 |
| 1990 Feb 22 | 14.20.8 | 2.7 | 0.0900.005 | 2.48 | 11.0 | 0.3 | 0.6 |
| 1990 May 30 | 13.70.7 | 2.6 | 0.0890.005 | 2.50 | 10.8 | 0.3 | 0.6 |
| 1995 Jan 21 | 10.40.6 | 2.4 | 0.0620.003 | 1.59 | 11.0 | 0.5 | 0.2 |
| 1995 Mar 24 | 12.80.7 | 2.0 | 0.0700.004 | 1.65 | 11.0 | 0.1 | 0.4 |
| 1995 Jun 04 | 11.20.6 | 2.0 | 0.0600.003 | 1.53 | 11.2 | 0.4 | 0.2 |
| 1996 Feb 14 | 14.10.8 | 1.4 | 0.0770.004 | 1.48 | 11.2 | 0.6 | 0.0 |
| 1997 Feb 07 | 7.30.4 | 1.3 | 0.0410.002 | 1.48 | 11.7 | 0.4 | 0.0 |
| 1997 Jun 09 | 8.80.5 | 1.1 | 0.0520.003 | 1.48 | 10.8 | 0.5 | 0.0 |
| 1998 Jan 29 | 6.00.3 | 1.8 | 0.0340.002 | 1.46 | 11.0 | 0.3 | 0.1 |
| 1998 Apr 08 | 7.60.4 | 1.3 | 0.0400.002 | 1.40 | 11.6 | 0.4 | 0.1 |
| 1998 May 19 | 4.70.3 | 0.8 | 0.0240.001 | 1.46 | 11.8 | 0.0 | 0.2 |
| 1998 Jun 27 | 8.60.5 | 0.5 | 0.0480.003 | 1.41 | 10.9 | 0.3 | 0.1 |
| 1999 Jun 15 | 6.00.3 | 1.2 | 0.0340.002 | 1.44 | 11.2 | 0.3 | 0.1 |
| 2000 Jun 03 | 6.30.4 | 1.8 | 0.0310.002 | 1.48 | 12.2 | 0.2 | 0.1 |
| 2001 Jul 21 | 241 | 1.1 | 0.1300.007 | 1.81 | 11.4 | 0.3 | 0.2 |
| 2002 Jan 08 | 292 | 1.3 | 0.1540.008 | 2.17 | 11.9 | 0.0 | 0.5 |
| 2003 Jan 26 | 15.90.8 | 1.6 | 0.0880.005 | 2.30 | 12.6 | 0.3 | 0.8 |
| 2004 Mar 29 | 211 | 1.5 | 0.1110.006 | 2.25 | 12.1 | 0.1 | 0.5 |
| 2004 Jun 09 | 17.80.9 | 2.0 | 0.0930.005 | 2.34 | 12.4 | 0.1 | 0.5 |
Note. — Col. (1): Date of observation. Col. (2): Flux of broad H relative to narrow H with 1 errors. Col. (3): Flux-weighted velocity centroid of top 10% of red peak in units of 103 km s-1. Col. (4): Average flux in top 10% of red peak relative to narrow H with 1 errors. Col. (5): Ratio of integrated flux in fixed velocity intervals corresponding to regions of strong variability on the red and blue side determined from the rms proifle. Col. (6): Full width at quarter-maximum in units of km s-1. Col. (7): Quarter-maximum shift measured from central velocity at quarter maximum in units of km s-1. Col. (8): Flux-weighted centroid at quarter-maximum in units of km s-1
| UT Date | Flux | V(B) | P(B) | F(R)/F(B) | FWQM | QMS | QMC |
|---|---|---|---|---|---|---|---|
| (1) | (2) | (3) | (4) | (5) | (6) | (7) | (8) |
| 1990 Feb 22 | 17.80.8 | 2.1 | 0.1200.005 | 0.25 | 13.1 | 0.3 | 0.8 |
| 1993 Dec 13 | 221 | 2.0 | 0.1450.006 | 0.35 | 12.3 | 1.2 | 1.1 |
| 1995 Jan 23 | 9.80.5 | 2.1 | 0.0670.003 | 0.33 | 11.6 | 1.6 | 1.3 |
| 1995 Mar 24 | 14.30.6 | 2.1 | 0.0970.004 | 0.33 | 11.1 | 1.3 | 1.1 |
| 1996 Feb 15 | 11.40.5 | 2.1 | 0.0740.003 | 0.36 | 12.4 | 1.5 | 1.3 |
| 1997 Feb 06 | 10.60.5 | 2.1 | 0.0720.003 | 0.36 | 12.8 | 1.0 | 1.1 |
| 1998 Jan 29 | 15.50.7 | 1.8 | 0.0960.004 | 0.42 | 12.8 | 1.0 | 0.8 |
| 1998 May 20 | 7.90.4 | 2.0 | 0.0560.003 | 0.37 | 13.4 | 0.9 | 1.0 |
| 1998 Dec 20 | 14.00.6 | 1.6 | 0.0780.003 | 0.44 | 14.4 | 0.7 | 0.6 |
| 1999 Dec 04 | 19.10.8 | 1.3 | 0.1150.005 | 0.51 | 14.4 | 0.5 | 0.4 |
| 2001 Oct 25 | 16.60.7 | 1.1 | 0.1030.005 | 0.45 | 14.2 | 0.9 | 0.7 |
| 2002 Jan 08 | 15.80.7 | 1.1 | 0.0950.004 | 0.50 | 14.9 | 0.3 | 0.3 |
| 2002 Jan 11 | 16.30.7 | 1.0 | 0.0980.004 | 0.50 | 14.0 | 0.8 | 0.6 |
| 2002 Apr 12 | 11.60.5 | 1.1 | 0.0720.003 | 0.50 | 13.9 | 0.6 | 0.5 |
| 2002 Dec 27 | 17.40.8 | 0.9 | 0.1070.005 | 0.52 | 13.2 | 0.8 | 0.5 |
| 2003 Jan 26 | 17.20.7 | 1.1 | 0.1040.005 | 0.52 | 13.8 | 1.0 | 0.7 |
| 2003 Apr 05 | 15.20.7 | 0.9 | 0.0900.004 | 0.53 | 13.4 | 0.8 | 0.5 |
| 2003 Oct 31 | 10.90.5 | 0.6 | 0.0580.003 | 0.52 | 13.4 | 0.7 | 0.4 |
| 2003 Dec 22 | 11.50.5 | 1.2 | 0.0750.003 | 0.43 | 12.7 | 0.8 | 0.6 |
| 2004 Mar 28 | 11.10.5 | 0.9 | 0.0670.003 | 0.51 | 12.6 | 0.8 | 0.5 |
Note. — Col. (1): Date of observation. Col. (2): Flux of broad H relative to narrow H with 1 errors. Col. (3): Flux-weighted velocity centroid of top 10% of blue peak in units of 103 km s-1. Col. (4): Average flux in top 10% of blue peak relative to [O I] with 1 errors. Col. (5): Ratio of integrated flux in fixed velocity intervals corresponding to regions on the red and blue side of the profile corresponding to strong variations in the rms spectrum. Col. (6): Full width at quarter-maximum in units of km s-1. Col. (7): Quarter-maximum shift measured from central velocity at quarter maximum in units of km s-1. Col. (8): Flux-weighted centroid at quarter-maximum in units of km s-1


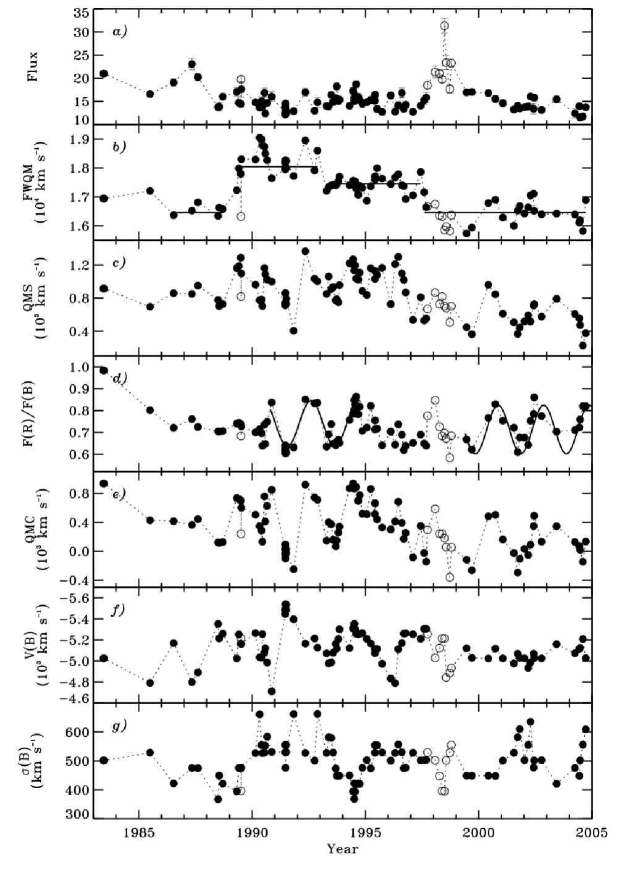


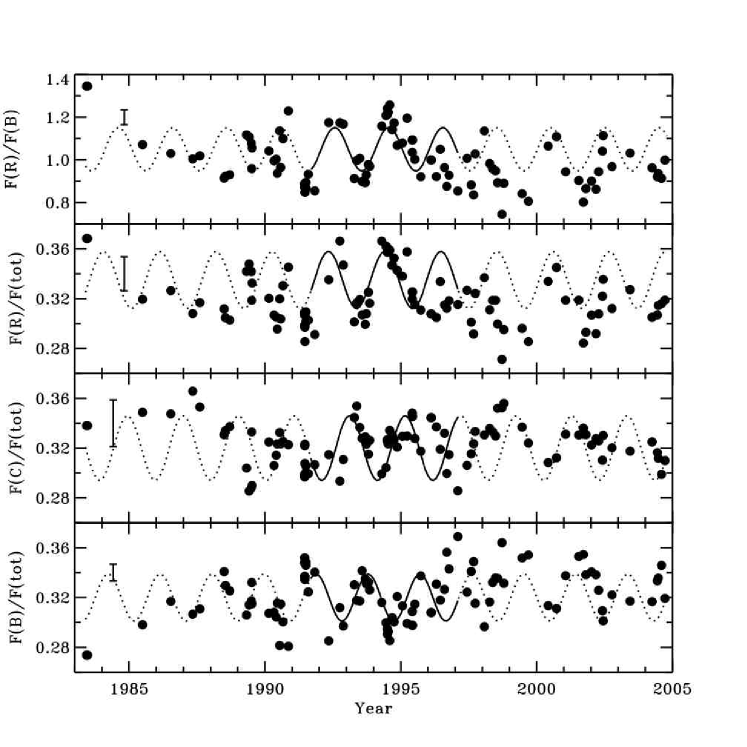
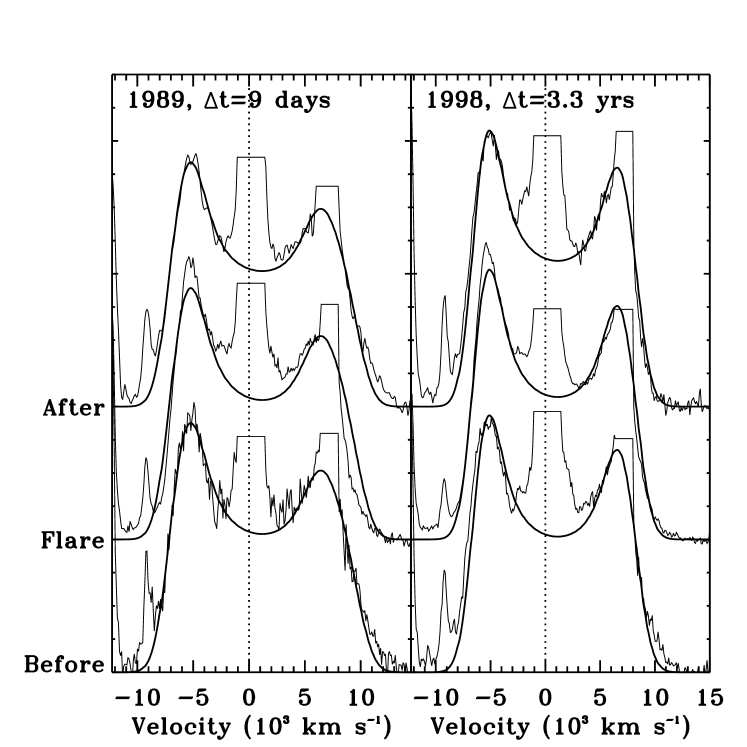


In this Appendix we present the narrow-line flux calibrated spectra of the H line profiles of the seven broad-line radio galaxies in our spectroscopic monitoring program (Figures 33–52). For all of the objects, except for 3C 382, the narrow H + [N II], [O I], and [S II] emission lines have been fitted and removed from the broad H line profiles. The subtracted narrow emission lines are shown with a dotted line, and a scaled model for the broad component of the H line is shown with a solid line. Tick marks indicate the flux-weighted velocity centroids of the peaks of the broad H profiles.