The Tully-Fisher relation of galaxies at in the DEEP2 survey
Abstract
Local and intermediate redshift () galaxy samples obey well correlated relations between the stellar population luminosity and maximal galaxy rotation that define the Tully-Fisher (TF) relation. Consensus is starting to be reached on the TF relation at , but work at significantly higher redshifts is even more challenging, and has been limited by small galaxy sample sizes, the intrinsic scatter of galaxy properties, and increasing observational uncertainties. We present here the TF measurements of 41 galaxies at relatively high redshift, spectroscopically observed with the Keck/DEIMOS instrument by the DEEP2 project, a survey which will eventually offer a large galaxy sample of the greatest depth and number yet achieved towards this purpose. The ’first-look’ sample analyzed here has a redshift range of with and an intrinsic magnitude range from of to (Vega). We find that compared to local fiducial samples, a brightening of magnitudes is observed, and consistent with passive evolutionary models.
keywords:
galaxies: evolution – galaxies: formation – galaxies: kinematics and dynamics – galaxies: spiral1 Introduction
The observed evolution of the Tully-Fisher relation (TF; Tully & Fisher, 1977) has the potential to provide considerable insight into how the properties of today’s galaxy population were established. In particular, this relation between the luminosity and rotation velocity of disk galaxies – probed through the total mass-to-light ratio of galaxies – reveals links between dark matter haloes and the stellar populations which form within them. This should ideally allow us to distinguish between the various proposed theories of galaxy formation and evolution.
In the hierarchical structure formation paradigm of cold dark matter (CDM), small galactic haloes () first condensed out at peaks in the near-uniform dark matter distribution. Eventually, through sufficient numbers of mergers, these sub-units accumulated to produce the massive haloes inhabited by the galaxies that dominate the stellar mass density from to the present. One possibility is that these first, small haloes were the sites of significant early star formation (Mo et al., 1998; Sommer-Larsen et al., 2003), and the resulting stellar mass subsequently accumulated through mergers (along with their dark matter haloes) into more massive galaxies without the need for substantial later star-formation. In this case, the growth of stellar mass in individual galaxies was driven primarily by mergers of already luminous sub-units, and hence the observed mass-to-light ratio should have been relatively steady over time, evolving only slowly due to the opposing actions of passive aging of the stellar populations and residual star-formation.
In contrast, there is some growing evidence that star formation was suppressed in smaller haloes at early times (Nelan et al., 2005). The suggested causes of this range from the increasing ultraviolet background (Wyithe & Loeb, 2006), the effects of star formation feedback (Springel et al., 2005) (particularly from the theoretically expected initial population of very-massive, zero-metallicity stars), or even AGN preferentially enhancing star formation in more massive haloes (Silk, 2005). Whichever mechanism is responsible, this implies that galaxies must have formed a substantial amount of their stellar mass afterwards, at later times, following the many mergers that assembled most of their dark matter haloes. This is somewhat reminiscent of the old monolithic collapse model for massive galaxy formation (Eggen et al., 1962), and implies substantial evolution in the mass-to-light ratio of galaxies – as stars form in the already assembled massive halo. This would also require more star formation per unit mass in smaller haloes than in more massive ones at later times, the so called ‘downsizing’ effect.
The relative order of mass assembly and star formation is cleary of significant interest. Therefore, examining evolution in the mass-to-light ratio of galaxies has been pursued as an important indicator of the galaxy formation mechanism. Such evolution is often probed through observed changes in fundamental scaling laws versus redshift, such as the Faber-Jackson and Kormendy relations for ellipticals (believed to be projections of a fundamental plane, Djorgovski & Davis, 1987). For spiral galaxies, the Tully-Fisher relation (TF) (Tully & Fisher, 1977) is the primary scaling law. Statistically well-populated TF diagrams over a range of redshifts should be able to test the various galaxy formation options through changes in the slope, intercept, and scatter of the fitted TF relation.
Tully-Fisher relations have been relatively well characterized for galaxies nearby, originally for distance indicator purposes (Pierce & Tully, 1992; Giovanelli et al., 1997; Dale et al., 2001), but recently in a more inclusive manner for assessing galaxy evolution, and to compare with higher redshift work (e.g., Kannappan et al., 2002). A number of studies have measured the TF relation at intermediate redshifts (–) and attempted to infer its evolution with cosmic time. However, a consensus on the TF relation evolution over the past Hubble time (out to ) has not yet been achieved, although very recent work such as Weiner et al. (2006) have greatly improved upon the few existing high redshift studies. Difficulty arises due to the relatively low numbers of galaxies typically used; the intrinsic scatter in the TF relation means that many tens of galaxies are needed per redshift bin for a reliable measurement, particularly to constrain the slope of the relation. The primary cause of discrepancies between studies appears to be differing selection criteria, and the manner in which these have been corrected for, if at all. The applied corrections can vary widely depending on the percieved aim of each particular study. In addition, the use of different local relations, TF fitting methods, and internal extinction corrections has complicated comparisons between studies.
As a result, various groups have identified significant evolution in the -band TF relation out to (e.g., Vogt et al., 1996, 1997; Rix et al., 1997; Simard & Pritchet, 1998; Barden et al., 2003; Böhm et al., 2004; Böhm & Ziegler, 2006; Nakamura et al., 2006), or state an upper limit (Bamford et al., 2006) on the evolution, while others find no evolution once selection effects have been accounted for (Simard & Pritchet, 1999; Vogt, 2001) or kinematically disturbed galaxies discarded (Flores et al., 2006). However, a consistent picture is begining to emerge, as these studies become more mature. One fairly certain aspect is that there has been rather little evolution in the intercept of the TF, ranging from no evolution to a modest brightening of mag at fixed rotation velocity by . This is much less than would be expected if the star formation rates of massive disk galaxies have evolved as strongly as is measured for the global star formation rate density of the universe (Bamford et al., 2006).
Constraining evolution in the TF slope is more difficult, though again any evolution is fairly modest. Any overall brightening of the TF that is observed appears to be mainly driven by low mass galaxies, as noticed by Bamford et al. (2006), identified as an additional population by Vogt (2001), and reflected in the TF slope change measured by Böhm et al. (2004); Böhm & Ziegler (2006). This is particularly the case when considered along with the observed lack of evolution in the -band and stellar mass TF relations found by Conselice et al. (2005), implying that while the stellar to total mass of galaxies stays roughly constant, the colour, and hence luminosity-weighted age or fraction of stars that have recently formed, has evolved, possibly with a dependence on galaxy mass. However, it is still unclear how much of this effect is actually due to differential luminosity evolution at a given rotation velocity, or a symptom of underestimating the rotation velocities for an increasing population of kinematically disturbed galaxies at higher redshifts.

Flores et al. (2006) use integral field spectroscopy to investigate this question, and also find that the -band, or stellar mass, TF relation has not evolved for a small sample of undisturbed disks out to , while galaxies with signs of kinematical disturbances are generally measured at low rotation velocities for their -band luminosity. In the -band, however, they show some evidence for a brightening of mag, and a tentative change of slope consistent with the studies of Böhm et al. (2004), even for undisturbed disks. Smith et al. (2004) find a consistent result from near-infrared integral field spectroscopy for a galaxy at .
A novel method in TF studies is the use of strong lensing by galaxy clusters to magnify distant galaxies (Swinbank et al., 2003). This enables the examination of galaxy rotation curves with resolution comparable to studies. Swinbank et al. (2006) use this technique to study six galaxies, four of which are found to have regular rotation curves. These are found to define an -band TF relation very similar to that found locally, and a -band TF with similar slope to the local relation, but offset to brighter magnitudes by – mag.
While such integral field work is important in providing a complete map of the galaxy velocity field (an improvement on the spatial losses accompanying the usual technique of long-slit spectroscopy) the number of galaxies observable with this method is rather limited by present instrumental capabilities. To measure rotation curves for a large sample of galaxies requires spatially-resolved multi-object spectroscopy, and currently the most efficient method is the use of slit-masks with individual slits tilted to align with the galaxy major axes. The DEIMOS optical spectrograph on Keck II (Faber et al., 2003) provides this capability, and a major project exploiting this instrument has been the DEEP2 project (Davis et al., 2004). This survey has undertaken spatially-resolved multi-slit spectroscopy of a large sample of galaxies colour selected to lie at . The red sensitivity of the instrument, coupled with its stability and lack of fringing, means that [OII] 3727 Å rotation curves can be traced cleanly throughout this redshift range.
As well as spectroscopy, in order to construct a TF relation at intermediate redshift one requires high quality imaging, to provide magnitudes and importantly for measuring the inclination angles of the targetted galaxies, needed to correct the rotation velocities for projection effects.
In this paper, we measure the rotation curves of galaxies at from the DR1 release of the DEEP2 spectroscopy, and use them to determine the evolution of the -band TF relation. In Section 2 we discuss the DEEP2 spectroscopy from Keck/DEIMOS, and the imaging from CFHT. In Section 3 we detail the fitting of galaxies in the imaging in order to derive inclinations, and the emission-line modelling to measure the rotation velocities. Section 4 presents our resulting Tully-Fisher relation and a comparison with previous work at low and high redshift. Our conclusions are in Section 5. In this paper all magnitudes are expressed based on Vega normalization, and throughout we adopt the standard ‘concordance’ cosmology of , , km s-1 Mpc-1.
2 Data sources and processing
In this work, we aim to compare the fitted TF parameters for our present sample with those for similar samples at intermediate and lower redshifts. The main uncertainties in constructing a TF relation usually arise from the galaxy rotation velocities. These are determined from the rotation curves, typically using the shapes of emission lines measured in the spatially-resolved two-dimensional spectroscopy. These velocities are then corrected for projection effects due to the inclination of the galactic disk, and misalignment of the slit from the major axis of the galaxy, both determined from morphological fits to the imaging data. Therefore, while the intrinsic scatter of the galaxies themselves place limits on the uncertainties of the fitted TF relation, galaxy imaging and spectroscopic data of high signal-to-noise and resolution should minimize the remaining fundamental sources of uncertainty (Kannappan et al., 2002). In particular, in this work we take advantage of the high spatial (/pixel) and wavelength resolution () of the DEEP2 survey, combined with the wide area imaging archive over the DEEP2 survey region from the CFHT CFH12K mosaic imager in the -band (corresponding to the rest-frame -band at ).
2.1 DEEP2 spectroscopy
We began our sample selection by examining the DEEP2 dataset for suitable galaxies for TF measurement. The DEEP2 spectroscopic observations were based on an optical imaging survey taken from 1999–2000 using the CFH12K mosaic camera (Cuillandre et al., 2001) in the bands to a depth of . Galaxy target selection and slitmask design were conducted using this imaging (which covered four fields composing a total of 3 deg2), with color cuts in & to optimize the selection of galxies in the redshift range – (Coil et al., 2004).
Although the DEEP2 project will eventually obtain DEIMOS spectroscopy for some 40,000 galaxies over the total area described above, the current data release contains galaxies over deg2. Of these, approximately 4300 have confident redshifts as measured by the DEEP2 pipeline software (), and we inspected these galaxies for strong emission lines at the expected position of [OII]3727Å in each spectrum. In this first (“1HS”) phase of the DEEP2 project, one hour spectroscopic integrations were obtained on each slitmask, containing about 85 objects per mask. Later phases of DEEP2 (“3HS”) will integrate on a smaller galaxy sample for hours. After being dispersed by the 1200/mm grating, the wavelength coverage is Å, so [OII]3727Å is detectable over , nearly the entire redshift range targeted by the colour-cuts. The spectra have a typical spectral resolution of determined by the slit size, sampled by Å pixels. The spatial pixel size is . Of the 4300 spectra, 388 were found to have strong [OII] emission in the aforementioned wavelength range, and suitable for measuring rotation velocities using the line fitting task with integrated single-line signal of .
The spectra were provided by the DEEP2 team in the DR1 public release111http://deep.berkeley.edu/DR1 as a fully reduced dataset, with catalogs and wavelength-calibrated multi-extension FITS 2d-spectra and 1d spectral extractions. We did little additional processing except that prior to the model fitting procedures described below, we took the additional step of rectifying the 2d spectra to have orthogonally aligned spatial and spectral axes, with constant pixel scale. This was carried out to correct spatial distortions and because the slits of the DEIMOS instrument can be tilted to accomodate the position angles of the selected galaxies (within , constrained by the CCD columns and desired spatial resolution). This results in a generally diagonal (or even curved) wavelength solution across the spatial rows. Using the DEEP2 wavelength solution at the given spatial center of each galaxy in the slit mask, the solution was reproduced in all rows, and the flux interpolated and rebinned to a constant dispersion of Å/pixel.
2.2 CFH12K imaging
With the sample of suitable spectra identified, we extracted images of the galaxies for measurement of the necessary shape parameters. Searching the CFHT archive for the three currently released DEEP2 spectroscopic fields (out of four total to be made public), we identified useful imaging exposures taken by the CFH12K instrument. The CFH12K camera has a platescale of /pixel, and covers a rectangular field of view using a array of 4K2K CCDs, for a total of square degrees per pointing. Two fields, “0230+0000” and “2330+0000”, had -band imaging which overlapped with most of the DEEP2 spectra where we identified strong [OII] emission. With a median redshift of for the galaxy sample used here (Figure 1), the choice of the -band allows the photometry to be easily converted to the -band rest-frame absolute magnitude commonly used for TF studies, with minimal -correction uncertainties.
The individual minute dithered imaging exposures in each field were combined using standard image reduction techniques, including the use of bad pixel masks and calibration frames (“master detrend” bias/dark/flat-field frames) identified for each camera run in the CFH12K archive. Cosmic ray rejection was implemented in addition to bad pixel masking and local sky subtraction during the median combining of the separate exposures. Finally, each reduced image was astrometrically corrected to the USNO-B1.0 catalog (Monet et al., 2003), using the WCSTools routines of D. Mink, which automatically update the appropriate header WCS information given a standard star catalog and chosen reference stars in the image of interest. This allowed automated extraction of the image of each galaxy selected this work, based on the J2000 RA/Dec positions given in the DEEP2 spectroscopic catalogs. At this point, 290 (out of 388) galaxies with strong [OII] flux were also covered by these two CFH12K imaging mosaics, and remained in the sample for further analysis.
3 Data Analysis
For the objects selected to have strong [OII] line emission in the DEIMOS spectroscopy, and with CFH12K -band images, we used the imaging to model the morphological parameters (giving the disk inclincation angle, , and position angle), and the spectroscopy to model the emission-line rotation curve (yielding ). We describe both of these below.
The TF relation also requires absolute magnitudes ( in this instance), and we determined these from the -band imaging, introducing a redshift-dependent -correction to match the restframe- with the observed- filter. Finally we corrected the absolute magnitude for intrinsic extinction in the disk galaxy, depending on inclination and luminosity.
3.1 Galaxy image and spectral profile fitting procedures
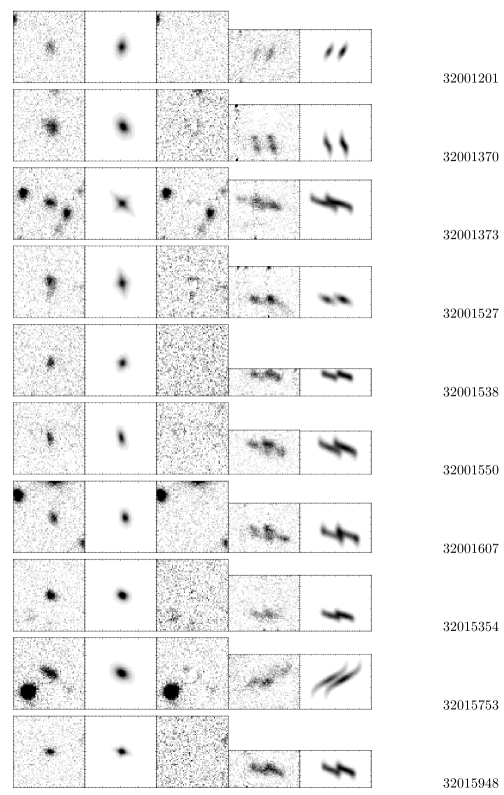
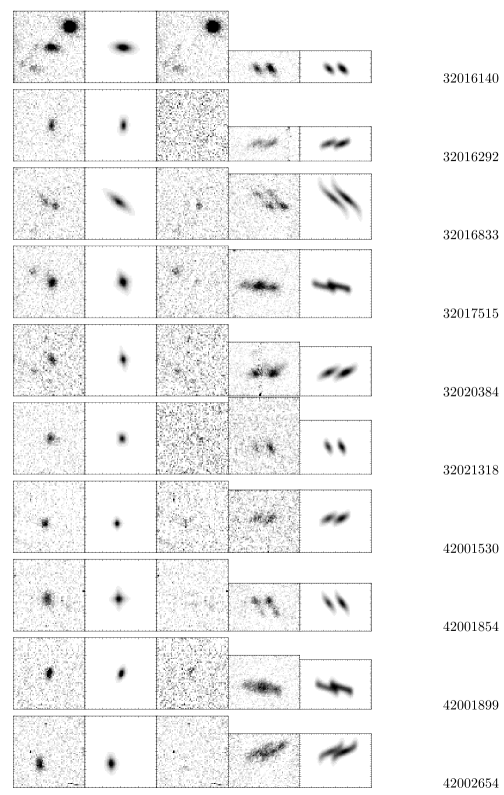
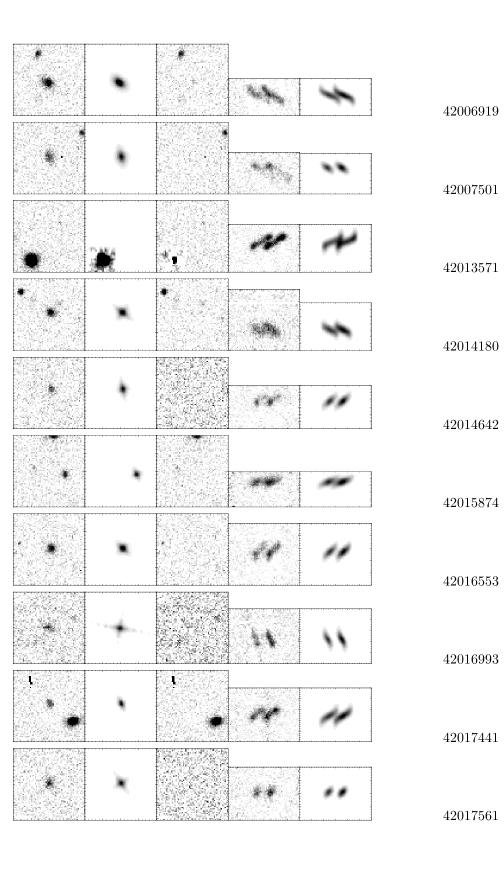
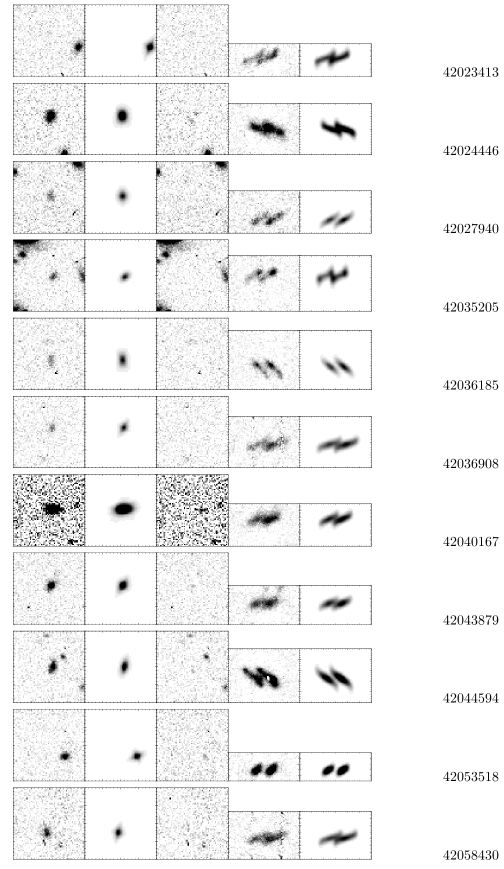
First, image shape modeling was carried out on each galaxy using the GALFIT program of Peng et al. (2002), in order to calculate the position angle (PA) and axial ratio values required in subsequent steps. For each galaxy, a pixel cutout () was made from the CFH12K image, preserving astrometric and flux information. A point spread function (PSF) was produced by stacking good point sources within each CFH12K array chip, resulting in a profile with a FWHM of 2.5 pixels ().
GALFIT convolves this PSF with a model galaxy image based on input initial parameter estimates (, position, effective radius, magnitude, axial ratio, position angle) and perturbs these parameters until the residuals of the model-subtracted image are minimized. The initial input parameters were determined by the SExtractor program (Bertin & Arnouts, 1996) on the galaxy images. An exponential disk profile was chosen as the desired galaxy model, and the program iterated to completion, returning each of the minimized input parameters with errors. Of the galaxies input to GALFIT, half returned acceptable fits, while the remaining galaxies generally failed to converge due to unsalvagable flux profiles (i.e., galaxies not well described by exponential disks, or unresolved in the image). Examples of galaxy profile fits, and the raw/subtracted CFH12K images are shown in Figure 2.
| Galaxy ID | RA | Dec | Redshift | Slit–Gal | Mask–Slit | ||||
|---|---|---|---|---|---|---|---|---|---|
| (J2000) | (J2000) | (Vega) | (Vega) | (km/s) | |||||
| 32001201 | 23:29:40.78 | –00:01:41.9 | 0.83580 | 7.4 | 28.0 | ||||
| 32001370 | 23:29:23.38 | –00:01:33.8 | 1.15568 | 13.4 | –16.4 | ||||
| 32001373 | 23:29:20.31 | –00:00:58.4 | 1.03207 | 12.5 | –30.0 | ||||
| 32001527 | 23:29:13.43 | –00:01:04.3 | 1.11611 | 9.6 | 6.8 | ||||
| 32001538 | 23:29:05.50 | –00:00:55.0 | 1.05244 | 14.8 | 30.0 | ||||
| 32001550 | 23:29:17.52 | –00:01:42.9 | 1.05390 | 14.9 | 0.0 | ||||
| 32001607 | 23:28:51.26 | –00:01:08.9 | 1.05507 | 4.2 | 9.8 | ||||
| 32015354 | 23:30:02.10 | +00:08:17.3 | 0.83198 | 0.0 | –30.0 | ||||
| 32015753 | 23:29:50.20 | +00:06:47.1 | 0.82388 | –0.7 | –30.0 | ||||
| 32015948 | 23:29:55.86 | +00:07:25.7 | 0.95589 | –16.1 | –30.0 | ||||
| 32016140 | 23:29:36.71 | +00:08:56.1 | 0.80110 | –25.4 | –30.0 | ||||
| 32016292 | 23:29:40.37 | +00:07:21.5 | 0.83904 | 4.0 | 26.7 | ||||
| 32016833 | 23:29:30.78 | +00:07:56.4 | 0.78703 | 6.1 | –30.0 | ||||
| 32017515 | 23:28:57.81 | +00:08:41.9 | 0.99842 | –21.6 | 30.0 | ||||
| 32020384 | 23:30:19.50 | +00:11:06.8 | 1.24909 | 29.3 | –13.2 | ||||
| 32021318 | 23:29:56.02 | +00:09:41.6 | 0.80140 | 20.8 | 0.0 | ||||
| 42001530 | 02:30:43.59 | +00:22:49.2 | 0.75225 | 24.0 | 0.0 | ||||
| 42001854 | 02:30:32.79 | +00:21:53.5 | 0.80186 | 7.0 | 18.5 | ||||
| 42001899 | 02:30:24.87 | +00:21:36.3 | 0.90477 | 18.2 | 30.0 | ||||
| 42002654 | 02:30:02.52 | +00:22:49.7 | 0.80614 | 2.6 | 20.7 | ||||
| 42006919 | 02:30:40.80 | +00:24:27.8 | 0.89347 | 7.1 | –30.0 | ||||
| 42007501 | 02:30:30.40 | +00:24:45.1 | 0.92616 | –4.4 | 18.3 | ||||
| 42013571 | 02:30:50.69 | +00:29:17.0 | 0.82416 | 12.2 | 3.4 | ||||
| 42014180 | 02:30:34.44 | +00:28:07.2 | 0.75354 | –25.6 | 0.0 | ||||
| 42014642 | 02:30:27.62 | +00:29:19.9 | 0.75022 | 16.1 | 0.0 | ||||
| 42015874 | 02:30:02.02 | +00:29:18.1 | 0.86724 | –14.6 | 17.4 | ||||
| 42016553 | 02:29:48.27 | +00:29:39.6 | 0.80765 | –18.9 | 0.0 | ||||
| 42016993 | 02:29:32.82 | +00:29:31.9 | 0.88262 | –23.0 | –30.0 | ||||
| 42017441 | 02:29:17.55 | +00:28:27.9 | 0.85701 | –0.8 | 4.2 | ||||
| 42017561 | 02:29:13.87 | +00:27:12.9 | 0.85383 | –6.1 | 0.0 | ||||
| 42023413 | 02:29:59.75 | +00:33:20.1 | 0.81719 | 20.1 | 30.0 | ||||
| 42024446 | 02:29:28.61 | +00:32:01.6 | 0.81243 | –3.6 | 30.0 | ||||
| 42027940 | 02:31:01.50 | +00:35:10.5 | 0.86831 | –2.4 | 30.0 | ||||
| 42035205 | 02:31:09.36 | +00:40:21.8 | 0.86450 | 14.4 | 7.7 | ||||
| 42036185 | 02:30:59.17 | +00:40:03.4 | 0.79288 | 25.3 | –30.0 | ||||
| 42036908 | 02:30:45.18 | +00:38:43.5 | 1.29168 | 1.1 | 0.0 | ||||
| 42040167 | 02:29:28.90 | +00:37:14.8 | 0.78000 | 26.5 | 30.0 | ||||
| 42043879 | 02:30:48.83 | +00:43:05.4 | 0.77335 | –6.0 | 11.1 | ||||
| 42044594 | 02:30:37.44 | +00:42:10.3 | 0.90493 | –1.5 | –12.2 | ||||
| 42053518 | 02:30:07.45 | +00:44:46.2 | 0.92744 | 9.8 | 30.0 | ||||
| 42058430 | 02:30:57.37 | +00:48:03.1 | 0.97522 | 17.0 | –30.0 |
The fitting of faint emission lines in order to extract reliable rotation velocities is a challenging task, and highlights the desirability of high resolution and high signal-to-noise 2-dimensional spectra in order to determine confident galaxy rotation curves. In order to extract as much information as possible from the emission lines, and to consistently model the effects of inclination, seeing, finite slit width and instrumental resolution, we employed an enhanced version of the ELFIT2PY routine developed by SPB (Bamford et al., 2005), which is based partly on the synthetic emission line fitting software of Simard & Pritchet (1998).
The software is given the galaxy inclination, seeing, instrumental spectral resolution, slit position angle misalignment with respect to the galaxy major axis, slit tilt in the mask, and produces synthetic emission lines by constructing model 2D galaxy flux and velocity profiles, assuming a set of parameters, and then mimicking the observations. ELFIT2PY uses the Metropolis searching algorithm to find the set of parameters which minimize the residuals between the synthetic and observed emission lines. The searched parameters are the rotation velocity, the emission flux scalelength (assuming an exponential disk), the turnover radius of the rotation curve, and the spatial and wavelength centres of the emission line. The use of more complicated flux profiles was attempted, but it was found that these generally could not be constrained. An intrinsic rotation curve of the form is assumed (Courteau, 1997), with (found to best reproduce the observed rotation curve shapes, though ill-constrained, and in agreement with Böhm et al. 2004), and where is the radius and is the turnover radius. Such an intrinsic rotation curve is necessary in this case, rather than the discontinuous form used previously with ELFIT2PY, in order to adquately fit the high resolution of the DEEP2 spectra. Note that the emission flux scalelength and the turnover radius of the intrinsic rotation curve were allowed to vary independently, which was frequently found to be necessary. The total flux in the line was measured by integrating the background- and continuum-subtracted image of the line, and held fixed for the fit, with a constant [OII] doublet ratio of . The background level was also fixed at zero.
In previous versions of ELFIT2PY, the chi-squared comparison between the synthetic and observed lines was done on a pixel by pixel basis in the spectra. However, some other groups (e.g., Böhm et al., 2004) first trace the synthetic and observed emission lines, by fitting the position of the line in each spatial row independently, and then compare these traces to produce a chi-squared value used to judge the goodness of fit. This has the advantage of removing one level of dependence on the assumed galaxy flux profile, though it still of course plays a role in the construction of the synthetic line. It also weights the fit to preferentially reproduce the observed rotation curve rather than the flux profile, which may be affected by discrete star-formation regions and asymmetries. However, this is at the cost of leaving the emission scalelength unconstrained, which must therefore by fixed relative to the rotation curve turnover radius. Therefore a hybrid approch was adopted to take advantage of the high resolution of the DEEP2 spectra (which allow a high quality trace of the emission line to be measured), while somewhat reducing the influence of asymmetries in the observed flux profile which are apparently more prevalent at the high redshifts of the current sample.
This hybrid method combined the chi-squared values from pixel-to-pixel comparisons of the synthetic and observed spectra, and those from comparisons of both the trace centres and FWHM of the synthetic and observed lines. The variation of the observed FWHM in each spatial row helps constrain the rotation curve as it is a measure of the gradient of the rotation curve at each spatial position. If the rotation velocity is increasing quickly with radius, the observed FWHM in that spatial row is higher. This combined chi-squared value was the quantity used by the Metropolis algorithm to determine the best-fitting parameters and their confidence intervals.
The traces were performed by fitting a double Gaussian function to each spatial row independently. The Gaussians had a fixed separation appropriate for the [OII] doublet at the redshift of the galaxy, and the same FWHM. Only the centre of the doublet, single line FWHM and amplitudes of the two components were allowed to vary. Fits were judged to be reliable if the Levenberg-Marquardt least-squares minimisation converged from the appropriately chosen initial parameters, if the errors on the best-fitting centre and amplitudes were sensible, and if the best-fitting FWHM was larger than the spectral resolution.
Note that the velocity convention in this work is to use the “half-velocity” term, which specifies the maximum absolute rotation velocity, of the asymptotic assumed intrinsic rotation curve, with respect to the center of the galaxy, rather than the velocity-width, , traditionally used to express the total velocity gradient measured across the entire galaxy. Examples of synthetic emission-line images, created using the best-fit parameters, appear in Figure 2.
The emission lines of the 290 galaxies selected thus far were inspected visually in more detail before fitting, and those with no sign of being spatially extended were rejected. Of the remaining galaxies, those with unsuccessful GALFIT measurements of their inclination and position angle were also rejected. Then, only galaxies with inclinations more than from face-on, and hence a reasonable component of the rotation velocity along the line-of-sight, were fit with ELFIT2PY. In addition, galaxies with a large misalignment angle () between their major axes and the slit were rejected, to avoid large and uncertain corrections for this effect. galaxies were thus remaining to be fit with ELFIT2PY.
In a number of cases, the best fitting parameters from ELFIT2PY indicated that the rotation velocity was unreliable, for example due to the emission flux profile being consistent with a point source, or the end of the reliably measurable emission line occuring at smaller radii than the best-fitting intrinsic rotation curve turnover radius. In order to remove such uncertain galaxies from the sample we imposed the following quality criteria.
If the scalelength of the fitted emission flux exponential disk profile is too small, then the fit is unlikely to be useful, and thus is rejected. The limit adopted is – the angle subtended by one pixel for a galaxy observed with a slit tilt of , the worst case we admit. This corresponds to – kpc for the redshifts of our objects. In order to also reject galaxies with uncertain emission scalelengths which are close this limit, we reject any galaxy for which the fit scalelength is consistent with being below at the level.
In order to consider how far out in each galaxy we measure the emission line to, we define the extent of the line as half of the spatial distance over which the line is reliably traced, after removing single ‘good’ points with no ‘good’ neighbours as spurious. If the extent is less than that one would expect for a point source given the seeing, which we take as then we reject that galaxy from further consideration.
Finally, we also consider whether the transition from the inner rotation curve slope to the flat region is observed with sufficient signal-to-noise. This is done by requiring that the radius at which the fit intrinsic rotation curve turns over is within the reliable extent of the line. Furthermore, in the case where the turnover is not observed, the turnover radius will be highly uncertain. To exclude such galaxies we require that the turnover radius is inconsistent with being beyond the line extent with at least confidence.
Following the application of these quality criteria, galaxies remained with reliable rotation velocity measurements.
3.2 Galaxy photometry, -correction, and extinction correction
In addition to the rotation velocity, the second input required for the TF relation is the galaxy absolute magnitude. In order to compare with other samples, while avoiding large -corrections to the photometry, we use the absolute magnitude in the rest-frame -band, , in the AB zero-point system. For our galaxies, with median a redshift of , this roughly corresponds to the observed-frame filter (centered at 8100 Å). For each galaxy of interest, the -band photometry was extracted from the DEEP2 photometric catalogs accompanying the spectroscopic dataset (Coil et al., 2004). These catalogs were produced using the IMCAT imaging and photometric reduction software of Kaiser et al. (1995), having been finally calibrated to the SDSS standard system. As an independent check on the -band photometry, we also verified magnitudes during our SExtractor and GALFIT proceedures.
| total scatter | intrinsic scatter | ||||
|---|---|---|---|---|---|
| mags (dex) | mags (dex) | ||||
| Free-fit | ) | ||||
| TP00 | |||||
| V01 |
Using synthetic template spectra of Sbc, Scd, and Im galaxy types (Bruzual & Charlot, 2003), appropriate for the range of disk galaxies with star formation and hence [OII] emission, we simulated flux through the rest-frame and redshifted filters. We applied the average resulting -correction and error to each galaxy according to its redshift.
Finally, we applied an inclination-dependent extinction correction to each galaxy. Historically, the corrections of Tully & Fouque (1985) and Tully et al. (1998) have been used most commonly, the latter incorporating an additional dependence on galaxy luminosity (or rotation velocity). We adopt the Tully et al. (1998) method, for comparison of our work to recent TF samples at similar and lower redshifts. The extinction is defined in Tully et al. (1998) to be:
with
where is the galaxy major-to-minor axial ratio. Table 1 displays all of the measured parameters of the galaxies in our sample.
4 The Tully-Fisher Relation
From the original catalog of galaxies with high quality redshifts in the DEEP2 DR1 data release, the aforementioned steps have reduced the sample significantly, specifically through inspection of the 2d spectra for [OII] emission (), imaging data overlap matching (), galaxy image profile modeling (), and suitable inclinations and slit misalignments for emission line modeling (). Following rejection of those galaxies for which we judge the measured rotation velocity to be unreliable, as described in section 3.1, we now have a useful sample of galaxies with full photometry, morphology and rotation information. The sample spans a redshift range of with and an intrinsic magnitude range of to .
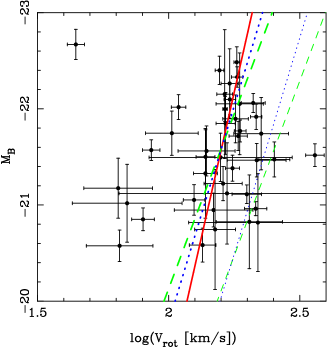
From this sample, we carried out several least-squares fittings to a straight line function: , where and are the intercept and slope of the TF relation, respectively. The slope and/or intercept value, and scatter width were minimized as the free parameters, and as in Bamford et al. (2006), we use weights of for each point, where , and is the intrinsic scatter of the TF relation. One data point was rejected by sigma-clipping, specifically object 32001370, due to its unusual position more than from the main sample. Three fits were then carried out – first, a free-fit of all parameters was allowed. Because this yielded a relatively poorly constrained slope, two subsequent fits were made with slope fixed to local reference samples, specifically those of Tully & Pierce (2000) or Verheijen (2001). Each of these comparison samples employed a version of the Tully et al. (1998) extinction correction, as is used for our sample here. Table 2 lists these fitted parameters, and Figure 4 displays the resulting TF distribution and fits.
These fitted parameters present several interesting aspects in comparison to the local fiducial TF relation. First, an overall brightening of mag is seen in this sample at compared to galaxies at present. This brightening is consistent with Böhm et al. (2004) who find an offset of , as well as Bamford et al. (2006), who find an offset of . The strength of the effect may be explained in part by a colour selection effect in the DEEP2 galaxy sample, which leads to observation of relatively younger stellar population galaxies (and in turn, decreased mass-to-light ratios). A larger sample from the full DEEP2 data may allow this colour-TF relation to be evaluated, as in Kannappan & Barton (2004). Also of interest is that the brightening of this sample compared to the local fiducial samples seems to be strongest at the bright end of the TF relation (). This is in contrast with the result of Böhm et al. (2004), in which little brightening ( mag) is found the relatively bright galaxies, but significant brightening found in the faint end galaxies ( mag, ).
Does this magnitude offset accord with the hierarchical picture, in which small galaxies with pre-formed stellar populations merge into progressively more massive systems, whose mass-to-light ratios change only slowly with the dimming of the passively evolving galaxies? We have calculated the possible contribution of such passive evolution to observed changes in high redshift galaxy luminosities and find that such dimming over time is consistent. Using Bruzual & Charlot exponential decay models, we find that young galaxies at (with luminosity-weighted ages of 3–5 Gyr) will have dimmed by mag over the 6.5 Gyr to . Hence we conclude that the observed brightening of the TF relation in this sample is consistent with pure luminosity evolution.
We additionally find that the amount of the brightening offset is within the intrinsic scatter of the sample, and comparable to the scatter found in the local reference populations discussed above. Because intrinsic scatter in the TF relation reflects variations in the mass-to-light ratio of individual galaxies, stellar mass fraction, and deviations from ordered rotation, these effects may be useful to separate in larger similar samples.
A few points are worth consideration in the future. First, it will be useful to examine whether TF samples are really dominated by disk galaxies, and the extent to which unidentified irregulars may be influencing and scattering the relation. This may be partially influenced by the selection of the present sample, which is based on the color cut producing the DEEP2 galaxies as well as the use of relatively bright galaxies in order to accomplish the spectral and spatial fitting tasks here. Also, while this and other TF studies examine the blue, star-formation dominated region of the galaxy spectrum, the redder portion of galaxy flux displays tighter correlation and may be more useful for detection of parameter evolution. The effects of momentarily bright star formation episodes (mostly influencing the restframe blue bands) could be mitigated. Such work (at for example) would benefit from or -band imaging, corresponding to band in the restframe, as has been demonstrated by Conselice et al. (2005). Finally, with future improvements in spectroscopic and imaging spatial resolution (such as with HST), it may be possible to more thoroughly separate the disk and bulge flux components of examined galaxies, and even address non-uniform star-forming mass regions.
5 Conclusions
The population of 41 reliable galaxies examined here is a significant addition to the existing sample at , with spectral resolution of allowing the determination of the TF parameters and their evolution. Our detection of a 1.5 mag brightening offset in the TF intercept compared to the present relation is consistent with the previous work of Böhm et al. (2004), Bamford et al. (2006), and the recent results of Weiner et al. (2006). We suggest that this is consistent with passive evolution of galactic sub-units that have already undergone star-formation prior to having assembled into the large galaxies we see today. This is in contrast to the scenario where significant new star formation is proposed to occur within the dark halos that assembled first.
Even if galaxies experience only short episodes of star formation activity, and then evolve passively without further mergers, we have demonstrated that changes in correlated parameters, such as in the TF relation, should be observable. As stellar populations age, their decreasing UV luminosities ought to be reflected through changes in galactic mass-to-light ratios; conversely, activity through mergers and rekindled stellar activity leaves similarly observable signatures.
In the future, it may be possible to separate larger samples of similar galaxies into redshift bins spanning the entire high redshift range of interest, in order to further quantify the evolution of the TF intercept. The DEEP2 survey provides a promising dataset to carry out such work, and to extend such studies towards examining the role of individual galaxy variations in the overall scatter of TF and similar relations. And while our and other concurrent studies are capable of revealing evolution of the TF linear fit intercept versus redshift, in principle, changes in the TF fit slope itself could also be probed more accurately than has yet been possible – perhaps revealing differences in useful observables such as star formation efficiency versus time.
Acknowledgments
We thank the DEEP2 collaboration for making available the high-quality data gathered over several years at the CFHT and Keck observatories. We also appreciate the comments and suggestions of the anonymous referee. KC acknowledges funding from a PPARC rolling grant, and AJB acknowledges a Philip Leverhulme Prize. The analysis pipeline used to reduce the DEIMOS data was developed at UC Berkeley with support from NSF grant AST-0071048.
References
- Barden et al. (2003) Barden M., Lehnert M. D., Tacconi L., Genzel R., White S., Franceschini A., 2003, astro-ph/0302392
- Bamford et al. (2005) Bamford, S. P., Milvang-Jensen, B., Aragón-Salamanca, A., & Simard, L. 2005, MNRAS, 361, 109
- Bamford et al. (2006) Bamford, S. P., Aragón-Salamanca, A., & Milvang-Jensen, B. 2006, MNRAS, 366, 308
- Bertin & Arnouts (1996) Bertin, E., & Arnouts, S. 1996, AAPS, 117, 393
- Böhm et al. (2003) Böhm, A., Ziegler, B. L., Fricke, K. J., & FDF Team, t. 2003, Ap& SS, 284, 689
- Böhm et al. (2004) Böhm, A., et al. 2004, AAP, 420, 97
- Böhm & Ziegler (2006) Böhm, A., & Ziegler, Bodo L. 2006, astro-ph/0611326
- Bruzual & Charlot (2003) Bruzual, G., & Charlot, S. 2003, MNRAS, 344, 1000
- Bundy et al. (2005) Bundy, K., Ellis, R. S., & Conselice, C. J. 2005, ApJ, 625, 621
- Coil et al. (2004) Coil, A. L., Newman, J. A., Kaiser, N., Davis, M., Ma, C.-P., Kocevski, D. D., & Koo, D. C. 2004, ApJ, 617, 765
- Conselice et al. (2005) Conselice, C. J., Bundy, K., Ellis, R. S., Brichmann, J., Vogt, N. P., & Phillips, A. C. 2005, ApJ, 628, 160
- Courteau (1997) Courteau, S. 1997, AJ, 114, 2402
- Cowie et al. (2003) Cowie, L. L., Barger, A. J., Bautz, M. W., Brandt, W. N., & Garmire, G. P. 2003, ApJL, 584, L57
- Cowley et al. (1997) Cowley, D. J., Faber, S., Hilyard, D. F., James, E., & Osborne, J. 1997, Proc. SPIE, 2871, 1107
- Cuillandre et al. (2001) Cuillandre, J.-C., & et al. 2001, ASP Conf. Ser. 232: The New Era of Wide Field Astronomy, 232, 398
- Dale et al. (2001) Dale, D. A., Giovanelli, R., Haynes, M. P., Hardy, E., & Campusano, L. E. 2001, AJ, 121, 1886
- Davis et al. (2004) Davis, M., Gerke, B.F., Newman, J.A. 2004, astro-ph/0408344
- Djorgovski & Davis (1987) Djorgovski, S., & Davis, M. 1987, ApJ, 313, 59
- Eggen et al. (1962) Eggen, O. J., Lynden-Bell, D., & Sandage, A. R. 1962, ApJ, 136, 748
- Eyles et al. (2005) Eyles, L. P., Bunker, A. J., Stanway, E. R., Lacy, M., Ellis, R. S., & Doherty, M. 2005, MNRAS, 364, 443
- Faber et al. (2003) Faber, S. M., et al. 2003, Proc. SPIE, 4841, 1657
- Flores et al. (2006) Flores, H., Hammer, F., & Puech, M. 2006, New Astronomy Review, 50, 430
- Ford et al. (2002) Ford, H.C., et al. 2002, Proc. SPIE, 4854, 81
- Giovanelli et al. (1997) Giovanelli, R., Haynes, M. P., da Costa, L. N., Freudling, W., Salzer, J. J., & Wegner, G. 1997, ApJl, 477, L1
- Heckman et al. (2004) Heckman, T. M., Kauffmann, G., Brinchmann,J., Charlot, S., Tremonti, C., & White, S. D. M. 2004, ApJ, 613, 109
- Kaiser et al. (1995) Kaiser, N., Squires, G., & Broadhurst, T. 1995, ApJ, 449, 460
- Kannappan et al. (2002) Kannappan, S. J., Fabricant, D. G., & Franx, M. 2002, AJ, 123, 2358
- Kannappan & Barton (2004) Kannappan, S. J., & Barton, E. J. 2004, AJ, 127, 2694
- Krist & Hook (2004) Krist, J. & Hook, R. 2004, Tiny Tim User’s Guide, http://www.stsci.edu/software/tinytim
- Merloni (2004) Merloni, A. 2004, MNRAS, 353, 1035
- Metevier et al. (2006) Metevier, A., Kannappan, S., Phillips, D., et al. 2006, in preparation
- Milvang-Jensen et al. (2003) Milvang-Jensen, B., Aragón-Salamanca, A., Hau, G. K. T., Jørgensen, I., & Hjorth, J. 2003, MNRAS, 339, L1
- Mo et al. (1998) Mo, H. J., Mao, S., & White, S. D. M. 1998, MNRAS, 295, 319
- Monet et al. (2003) Monet, D. G., et al. 2003, AJ, 125, 984
- Nakamura et al. (2006) Nakamura, O., Aragón-Salamanca, A., Milvang-Jensen, B., Arimoto, N., Ikuta, C., & Bamford, S. P. 2006, MNRAS, 366, 144
- Nelan et al. (2005) Nelan, J. E., Smith, R. J., Hudson, M. J., Wegner, G. A., Lucey, J. R., Moore, S. A. W., Quinney, S. J., & Suntzeff, N. B. 2005, ApJ, 632, 137
- Peng et al. (2002) Peng, C. Y., Ho, L. C., Impey, C. D., & Rix, H.-W. 2002, AJ, 124, 266
- Phillips et al. (2002) Phillips, A. C., Faber, S., Kibrick, R., Wallace, V., & DEIMOS Team 2002, Bulletin of the American Astronomical Society, 34, 1320
- Pierce & Tully (1992) Pierce, M. J., & Tully, R. B. 1992, ApJ, 387, 47
- Tully & Pierce (2000) Tully, R. B., & Pierce, M. J. 2000, ApJ, 533, 744
- Rix et al. (1997) Rix, H.-W., Guhathakurta, P., Colless, M., & Ing, K. 1997, MNRAS, 285, 779
- Silk (2005) Silk, J. 2005, MNRAS, 364, 1337
- Simard & Pritchet (1998) Simard, L., & Pritchet, C. J. 1998, ApJ, 505, 96
- Simard & Pritchet (1999) Simard, L., & Pritchet, C. J. 1999, PASP, 111, 453
- Sommer-Larsen et al. (2003) Sommer-Larsen, J., Götz, M., & Portinari, L. 2003, ApJ, 596, 47
- Smith et al. (2004) Smith, J. K., et al. 2004, MNRAS, 354, L19
- Springel et al. (2005) Springel, V., Di Matteo, T., & Hernquist, L. 2005, MNRAS, 361, 776
- Swinbank et al. (2003) Swinbank, A. M., et al. 2003, ApJ, 598, 162
- Swinbank et al. (2006) Swinbank, A. M., Bower, R. G., Smith, G. P., Smail, I., Kneib, J.-P., Ellis, R. S., Stark, D. P., & Bunker, A. J. 2006, MNRAS, 368, 1631
- Tully & Fisher (1977) Tully, R. B., & Fisher, J. R. 1977, AAP, 54, 661
- Tully & Fouque (1985) Tully, R. B., & Fouque, P. 1985, ApJs, 58, 67
- Tully et al. (1998) Tully, R. B., Pierce, M. J., Huang, J.-S., Saunders, W., Verheijen, M. A. W., & Witchalls, P. L. 1998, AJ, 115, 2264
- Tully & Pierce (2000) Tully, R. B., & Pierce, M. J. 2000, ApJ, 533, 744
- Verheijen (2001) Verheijen, M. A. W. 2001, ApJ, 563, 694
- Vogt et al. (1997) Vogt, N. P., et al. 1997, ApJL, 479, L121
- Vogt et al. (1996) Vogt, N. P., Forbes, D. A., Phillips, A. C., Gronwall, C., Faber, S. M., Illingworth, G. D., & Koo, D. C. 1996, ApJL, 465, L15
- Vogt (2001) Vogt, N. P. 2001, ASP Conf. Ser. 240: Gas and Galaxy Evolution, 240, 89
- Weiner et al. (2006) Weiner, B.J., et al. 2006, astro-ph/0609091
- Wyithe & Loeb (2006) Wyithe, J. S. B., & Loeb, A. 2006, Nature, 441, 322
- Ziegler et al. (2003) Ziegler, B. L., Böhm, A., Jäger, K., Heidt, J., Möllenhoff, C. 2003, ApJl, 598, L87