Near-Infrared Observations of Globular Clusters in NGC 4472, NGC 4594, NGC 3585 and NGC 5813 and Implications for their Ages and Metallicities
Abstract
We present near-infrared photometry of the globular cluster systems of the early-type galaxies NGC 4472, NGC 4594, NGC 3585, and NGC 5813. We combine these near-infrared data, obtained with PANIC at the Magellan Baade 6.5m telescope, with archival optical HST and FORS/VLT data, and use the optical to near-infrared colors to constrain the ages and metallicities of the globular clusters around the target galaxies. For NGC 4472 we have the most extensive near-infrared and optical photometric dataset. These colors show that the NGC 4472 globular cluster system has a broad metallicity distribution and that the clusters are predominantly old (i.e. ages of about 10 Gyr or more). This result agrees well with earlier spectroscopic work on NGC 4472, and is evidence that the combination of optical to near-infrared colors can identify predominantly old systems and distinguish these from systems with a substantial intermediate age component. Based on the smaller sample of combined optical and near-infrared data NGC 4594 and NGC 3585 appear to have predominantly old globular cluster systems, while that of NGC 5813 may have a more significant age spread. We also match our sample of globular clusters with near-infrared and optical photometry to Chandra X-ray source detections in these galaxies, and discuss how the probability that a globular cluster hosts a low-mass X-ray binary depends on metallicity and age.
1 Introduction
One of the primary goals in current extragalactic astronomy is to determine the formation history of galaxies. The study of globular cluster systems is a valuable tool for addressing galaxy formation and evolution. One reason for this is that globular clusters are simple stellar populations, with all of the stars in the cluster sharing the same metallicity and age. Hence, determining these values for an extragalactic globular cluster is more straightforward than attempting to do this using the complicated mix of populations in the integrated light of a galaxy. Moreover, because each cluster has a distinct age and metallicity that can be determined from observations, the distribution of ages and metallicities of a globular cluster system can be derived.
One of the most promising ways to determine the ages and metallicities
of extragalactic star clusters is through combining optical and
near-infrared colors (e.g. Goudfrooij et al. 2001; Puzia et al. 2001;
Hempel et al. 2003). This technique overcomes the well-known
degeneracy between age and metallicity in optical colors alone
(Worthey 1994), taking advantage of the different sensitivities to age
and metallicity of both colors. Specifically, near-infrared colors
depend primarily on the giant branch and are therefore much more
sensitive to metallicity than age, while optical colors also probe
stars near the main sequence turnoff, and therefore have a significant
sensitivity to age as well as metallicity. The comparison between the
observed colors and those given by Simple Stellar Population models
(SSPs), e.g. by Bruzual & Charlot 2003, allows the determination of
relative ages for any distinct sub-population. For example,
color distributions can be used to distinguish
globular cluster populations if their ages differ by several Gyr
(Puzia et al. 2002; Hempel & Kissler-Patig 2004). The optical plus
near-infrared technique has been used successfully in the past few
years in studies of globular cluster systems. One of the notable
results from these studies are the detection of intermediate age
globular cluster populations in NGC 1316 (Goudfrooij et al. 2001),
NGC 4365 (Puzia et al. 2002; Hempel et al. 2003; Kundu et al. 2005),
and IC 4051(Hempel et al. 2005). Several other galaxies studied show
no such sign of intermediate age populations, such as NGC 3115 (Puzia
et al. 2002) and M87 (Kissler-Patig, Brodie and Minniti 2002) or only
small younger fractions, as found in NGC 1399 (Kundu et al. 2005;
Hempel et al. 2006). The detection of intermediate age populations
in the GCSs of some elliptical galaxies has shown that an exclusively
early formation of these galaxies in a single burst of star formation
followed by passive evolution can not account for all elliptical
galaxies. However, significantly larger galaxy samples are required to
answer questions such as the fraction of early type galaxies in the
local universe with such intermediate age globular cluster populations
and how the presence or absence of any significant age structure is
correlated with various parameters such as the environment of the
galaxy. The primary goal of the work presented here is to help build a
sample of local early-type galaxies with deep near-infrared and
optical photometry from which the age structure in their globular
cluster systems can be constrained.
The possibility of determining
the ages and metallicities of GCs around elliptical galaxies is also
interesting for the study of low-mass X-ray binaries (LMXBs) in these
galaxies. LMXBs are overabundant in GCs compared to the field
population and indicate the importance of dynamical formation of LMXBs
in the dense GC environment (e.g. Clark 1975; Katz 1975a; Katz
1975b). For the LMXBs in GCs, the information on the age and/or
metallicity opens up the unique opportunity to directly determine
these parameters for the host system, and thus assess their role of
these parameters in the formation and evolution of LMXBs. Therefore,
as in previous studies (Kundu, Maccarone, and Zepf 2002; Kundu et
al. 2003; Maccarone, Kundu, and Zepf 2003) we combine Chandra X-Ray
observations with the results of our optical/ near-infrared photometry
to determine the properties of the GC and LMXB matches.
The setup of this paper is as follows. Section 2 describes the
galaxy sample in which we study the GCs, the new near-infrared
observations presented in this paper, and their combination with
existing optical data to produce optical to near-infrared colors for
GCs in the target galaxies. The age results for the various globular
cluster systems are presented in section 3. Section
4 combines the results on the globular clusters with the
LMXBs detected in the target galaxies. A summary of our major results
is given in section 5.
2 Observations
2.1 Galaxy sample
The work presented here is part of a continuing study, investigating the globular cluster systems of early-type galaxies, using globular clusters as probes of major star formation events. The primary goal is to use near-infrared and optical photometry to detect/identify any sub-populations in the globular cluster systems, defined by their age and metallicity. Here we present the data and results for four additional early-type galaxies, differing to some extent in their luminosity (-22.75 M V-21.79) and significantly in local galaxy density (0.12 3.31 Mpc-3). General information on our target galaxies- NGC 4594, NGC 4472 and NGC 3585 and NGC 5813, is given in Table 1.
2.2 Observational data and data reduction
2.2.1 Near-infrared data
The near-infrared Ks-band data were obtained with the
PANIC instrument (Persson’s Auxiliary Nasmyth Infrared Camera)
during the nights of March 31, April 01 and April 02 in 2005. The
PANIC instrument (Martini et al. 2004) is mounted at the the 6.5 m
Magellan (Walter Baade) Telescope at the Las Campanas Observatory,
Chile. It is equipped with a Rockwell HgCdTe 1024x1024 Jugate
detector, with a pixel scale of 0.125”/pixel, yielding a 20
x 20 field of view. The observing strategy for the four galaxies
was the following: we observed a single central field with
5x(2x15 sec) on source+ 5x(2x15 sec) sky+ 5x(2x15 sec) on source
exposures. The sky exposures were taken at a position 50 east
of the central field. For both on-source and sky observations we
applied a 5 point dither sequence with a 10 dither. The total
on-source exposure times were: 2700 sec (NGC 4594), 4770 sec
(NGC 4472), 3690 sec (NGC 3585), and 5070 sec (NGC 5813)
respectively. Using the PANIC IRAF
111IRAF is distributed by the National Optical Astronomy
Observatories, which are operated by the Association of Universities
for Research in Astronomy, Inc., under cooperative agreement with the
National Science Foundation. package (Martini & Perrson 2004) the
exposures within one loop (2 readouts, 15 sec each) were co-added
(loopsum), corrected for non-linearity (lincor),
flat-fielded (flatten) and sky-subtracted (imarith). The
individual exposures were aligned and shifted with respect to a
selected single exposure. The alignment of the exposures was checked
by comparing the new pixel coordinates of 7 (NGC 4594, NGC 4472) and
10 (NGC 3585, NGC 5813) objects on each individual exposure. The final
shifting and trimming of the exposures was done using the IRAF task
imalign and the total exposures created with imcombine
as the mean of the individual exposures.
The photometric conditions were monitored during the nights by observing Persson standard stars from the Faint Standard Star catalog (Perrson et al. 1998; Harwarden et al. 2001). The first night as well as parts of the following two nights were found to be photometric, and photometric calibration of data obtained under non-photometric conditions was performed using shorter exposures of the target galaxies taken under photometric conditions. Aperture photometry on both the standard stars and the science exposures was carried out using the Source Extractor program (Bertin & Arnouts 1996). The following calibration relation has been derived for the photometric calibration of the short/ photometric exposures:
| (1) |
Hereby kinst denotes the instrumental magnitude, ZP the photometric zero point and the effective airmass (Stetson 1988). According to Frogel (1998) we adopted an atmospheric extinction coefficient of 0.08. The different calibration constants, as well as the applied Galactic foreground reddening corrections (Schlegel, Finkenbeiner, and Davies 1998) are given for each galaxy in Table 2. The mean photometric error for the K-band data, e.g. in NGC 4472 is =0.087 mag, as given by SExtractor. Given the high accuracy of the optical photometry the mean error in the visible band is = 0.02 mag, and the mean error in is = 0.09 mag.
To calibrate the total exposures, the photometric offset between the
calibrated short and the total exposures, called offset in
Table 2, was derived for each data set, as well as the
aperture correction between a 5 pixel (diameter) and an infinite
aperture. Using the IRAF task median we created a smoothed
image of the diffuse galaxy light which was subtracted from the total
exposure. The final photometry was eventually carried out on the
galaxy subtracted image using Source Extractor. Although the
calculation of the total exposure time for each target was meant to
ensure that equally deep data were obtained, the data quality still
varies. In our set of galaxies NGC 4472 is the class winner, with the
best, i.e. deepest and largest, near-infrared data set. The total
number of GCs in this galaxy is 37, after applying the error cut of
0.15 mag for both colors. The data set for NGC 4594 is of similar
quality, but a FOV mismatch between optical and near-infrared
observations results in a modest number of GCs (26 including selection
by error cut). In the NGC 3585 GC sample 26 objects are finally
included in the study. Data were also taken for NGC 5813, a bright,
large galaxy in the Virgo- Libra cloud (Huchra & Geller
1982). However, the combined optical/ near infrared data set (error
selected) contains only 22 objects.
2.3 Optical photometry
The globular cluster systems of all four galaxies have been well-studied in the optical bands (HST/WFPC2), and we use the results published by Kundu & Whitmore (1998) for NGC 4594 and NGC 4472, and Puzia et al. (2004) for NGC 3585 and NGC 5813, respectively. Table 3 gives some details on the observations; we refer the reader to the original publications for further details.
To match the optical sources with our near-infrared (K-band) data, we used the IRAF task tfinder. The RA and DEC coordinates of the globular clusters as given by HST/ACS, HST/WFPC2 or VLT/FORS2 were transformed into pixel coordinates with respect to the PANIC near-infrared observations. Finally both source lists, optical and near-infrared, were matched allowing a maximum offset of 3 PANIC pixels (0.375 arcsec).
3 Results
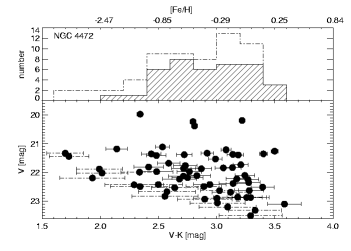
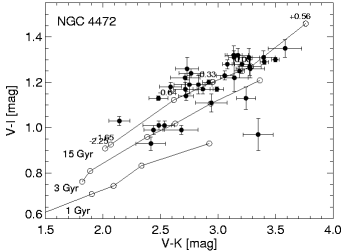
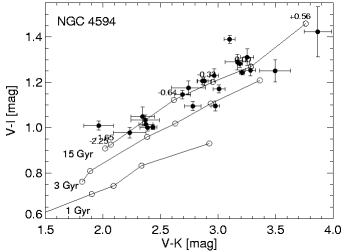
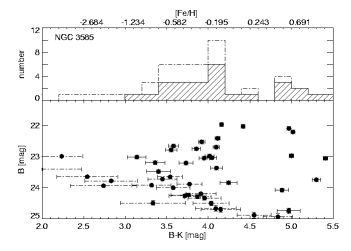
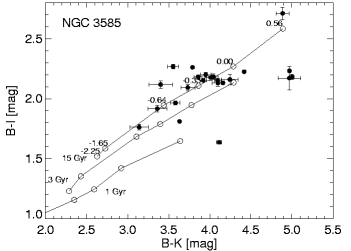
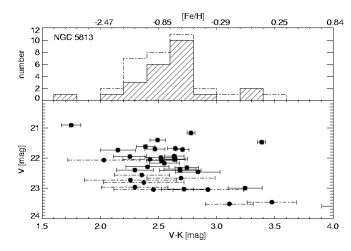
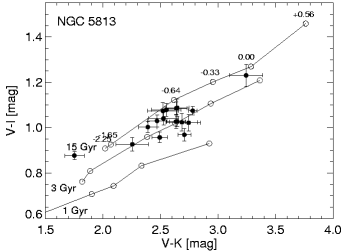
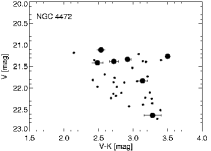
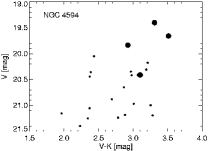
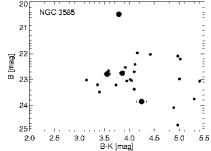
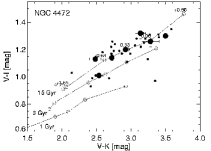
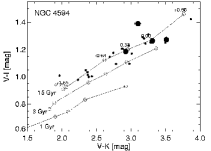
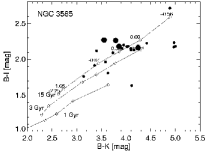
To set constraints on the globular cluster ages and metallicities, we compare the two-color diagram to the predictions of Single Stellar Population models. The color-magnitude diagrams, color distributions and color-color diagrams of the four galaxies are shown in Figures 1, 3, 4 and 5. In this study we apply the models by Bruzual & Charlot (2003). In Hempel & Kissler-Patig (2004) and Hempel et al. (2005) we have shown that the main result regarding the presence or absence of intermediate aged clusters is relatively model independent. In the following we discuss the results for each of the galaxies individually, starting with the galaxy with the largest dataset, NGC 4472, followed by NGC 4594, NGC 3585, and NGC 5813, in order of decreasing size of our globular cluster sample for each galaxy. Symbols and selection criteria are set equivalently for all four targets. In the CMDs globular clusters with photometric errors and 0.15 mag are represented by the solid points and solid line error bars. In the color distributions these objects are represented by the solid line histograms. Objects which have been rejected by the error cut are marked by open points and dashed error bars in the CMDs and as open histograms in the corresponding color distributions. As for the color-color diagrams: solid lines represent the Bruzual & Charlot SSP isochrones (Bruzual & Charlot 2003) for a 1,3, and 15 Gyr old population. For a given age the metallicity increases from -2.25 to +0.56 with the color index (open circles).
As briefly described in Section 1, it is possible to disentangle age and metallicity effects in , color-color plots because the near-infrared light is primarily sensitive to metallicity while the optical colors are sensitive to both age and metallicity. In general, predominantly old globular cluster systems will follow the line of constant old age, with GCs of various metallicities falling along the line from low metallicity on the bottom left to high metallicity on the top right. In contrast, systems with a significant intermediate age population will have substantial numbers of GCs spread out in the age direction, along the isochrones of younger age. A key point is that calibration issues in either the models or the data will shift a single age population relative to the lines of constant metallicity but will not produce a dispersion in the age direction. Greater spreads can be produced by large random errors, but these should generally scatter about a specific age line for a single age population. Moreover, the comparison between the dispersion in GC populations in the age direction can be done on a relative basis between galaxies studied in the same way, giving confidence that any age spread in a given galaxy is real if such a distribution of GC colors is not observed in similar observations of other GC systems.
3.1 NGC 4472
NGC 4472 (M49) is a very interesting target for our study, as it is the most luminous galaxy in the Virgo cluster, but does not reside at the gravitational center of the host cluster. The globular cluster system has been observed both photometrically (e.g. Geisler, Lee, and Kim 1996; Rhode & Zepf 2001; Kundu & Whitmore 2001a) and spectroscopically (e.g. Beasley et al. 2000; Cohen, Blakeslee, and Côté 2003). Comparing the optical color distribution (Kundu & Whitmore 2001a) with its counterpart in the near-infrared (see also table 4) we find the color distribution (see Figure 1, upper panel) to be bimodal, similar to the optical color distribution seen in earlier studies in Kundu & Whitmore (2001a). However, using the Hartigan & Hartigan test for unimodality (DIP-test) results in a dip-value of 0.0625. For our sample of 37 objects (no color limits, only error cuts are applied) we obtain a probability of 70 that the color distribution is not unimodal. In comparison, if we fit the color distribution with single or double Gaussian we obtain 2-values of 0.85 and 1.27, respectively. Both methods are hampered by the small number of objects in the sample. Comparing the GC colors, shown in the lower panel of Figure 1, with the SSP models lead to the conclusion that the NGC 4472 GCS is built by a predominantly old (10 Gyr) stellar population. This result is in good agreement with the spectroscopic age estimates by Beasley et al. (2000) and Cohen, Blakeslee, and Côté (2003) who derive the mean GC age to be older than 10 Gyr. In order to set also some constraints on the metallicity distribution, the color-magnitude diagrams (Figures 1, 3, 4, 5) show the metallicity values (top x-axis), corresponding to the color for a 15 Gyr isochrone, following the Bruzual & Charlot SSP models (2003).
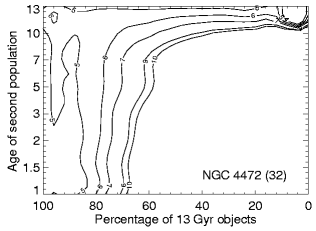
The size and quality of the NGC 4472 GC sample allows us to extend our analysis to include the cumulative age distribution (Hempel et al. 2003; Hempel & Kissler-Patig 2004). The comparison with age distributions derived for simulated GCSs with a given age structure (age, size of age sub-populations) via a reduced 2-test allows us to find the best fitting model and hence to set some constraints on the relative age and size of possible cluster sub-populations. Hereby we assume that only red, supposedly metal-rich GCs might form an intermediate age population. For bluer objects the color difference between a 13 Gyr and 2 Gyr isochrone, in comparison with the photometric errors, does not allow us to discriminate between those ages. In our analysis we therefore select only objects with a color2.6. Using the Bruzual & Charlot (2003) SSP models this corresponds to a metallicity of [Fe/H]-0.7, assuming an old population (13-15 Gyr). Figure 2 shows the result of the 2-test for the NGC 4472 GC sample. The contours represent the various 2 levels. As in previous work we use 88 different models, combining a 13 Gyr old population with a second, intermediate age population of 1, 1.5, 2, 3, 5, 7, 10, 13 Gyr). For each model we assume a mixture of both age populations, varying between a 100 old and a 100 intermediate population (size increments: 10). The most important ingredient for our method of photometric age estimates in GCSs is the combination of optical and near-infrared data so we can take advantage of the much reduced age -metallicity degeneracy. However, we still have to accept the drawback of an increased photometric uncertainty, mostly due to the ground-based infrared observations. This is the main reason why individual GC ages as well as absolute GC ages are still out of reach. Although we set an upper limit for the photometric error (0.15 mag) we still have to take the latter into account. To do so we use the catalog of photometric errors of our observations. After populating the primary color (i.e. ) randomly and calculating the secondary, age sensitive, color index based on the SSP model predictions, we smear both colors with an up to 3 photometric error. The cumulative age distribution for the simulated systems is than based on the newly calculated colors.
Applying the above described procedure to the NGC 4472 globular cluster sample finds the best fitting model (lowest 2 value) to consist only of objects older than 10 Gyr (see Figure 2, top right corner). The photometric scatter seen in Figure 1 (lower panel) leads to the result that an equally good fit to the age distribution is obtained when mixing a 13 Gyr old population with a small fraction (20) of intermediate age GCs (younger than 7 Gyr). The different 2-values vary between 4.63 (minimum) for a 90:10- mixture of a 13 and 2 Gyr population and 5.05 for a combination of 90 of 13 Gyr old clusters and 10 of a 10 Gyr old population. Under the assumption of only 10 young objects we find that an age variation between 1 to 13 Gyr results in very similar 2 values, i.e. 4.79 (1 Gyr) and 4.68 (13 Gyr). Considering that different runs of simulations based on the same age structure (e.g. purely 13 Gyr old population) cover a similar 2-interval (4.65 to 4.77) we find that a size resolution of 10 or better is not feassible for this sample. Nevertheless the major outcome of this analysis is that NGC 4472 is by far dominated by an old stellar population.
We note that good agreement between the photometric and spectroscopic results, as is the case for NGC 4472, has also been found for NGC 1399 (Kundu et al. 2005; Hempel et al. 2006). This is of great importance since it has been suggested that the optical/near-infrared method is prone to misinterpreting photometric uncertainties as age spread, hereby deriving an artificial second age population within the globular cluster system (Brodie et al. 2005). However, our NGC 4472 results, as well as those for NGC 1399 (Kundu et al. 2005) demonstrate that the near-ir to optical color technique is not only sensitive to age spreads of several Gyr but also able to recover the age structure of old stellar systems.
3.2 NGC 4594
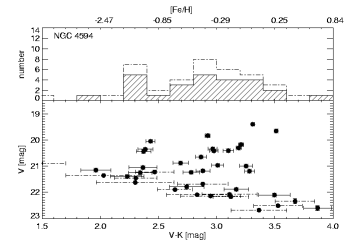
NGC 4594 is a highly luminous field galaxy, with an absolute magnitude of MV=-22.4. It has a bulge to disk ratio of 6.14 (Kent 1988), indicating its total luminosity is dominated by its very bright bulge component, rather than its well-known edge-on disk. Given its high spheroid luminosity, field environment, and proximity, NGC 4594 is a very interesting target for our study.
The globular cluster system of this galaxy has been observed photometrically in the optical by Rhode & Zepf (2004) and spectroscopically by Larsen et al. (2002). The latter derive a GC age around 10-15 Gyr. Using the combined optical and near-infrared colors, shown in the lower panel of Figure 3 (data are given in Table 5), we find the majority of the globular clusters to be old (10 Gyr), which is also in good agreement with the spectroscopic results. Similar to the spectroscopic sample (14 confirmed GCs) the sample size in our study is not sufficient to rule out completely the possibility of any intermediate age GCs in NGC 4594, but any such population is clearly not a large fraction of the total, if present at all. Further tests of the age structure in the NGC 4594 GC system using additional, wide-field near-infrared data we have recently obtained are underway.
3.3 NGC 3585
NGC 3585 is another of the field galaxies in our sample and therefore a useful extension of our galaxy sample when it comes to investigating the influence of the galaxy environment on galaxy evolution. The local galaxy density for NGC 3585 is the lowest in this sample (see Table 1). The color-color distribution of the NGC 3585 globular cluster system, shown in Figure 4 and Table 6, does not show signs of a substantial intermediate age component. This result is in agreement with previous work by Puzia et al. (2004, 2005) using optical photometry and spectroscopic data.
3.4 NGC 5813
The globular cluster system as well as the integrated light of NGC 5813 have been investigated extensively in the optical (e.g. Hopp, Wagner, and Richtler 1995; Kundu & Whitmore 2001a; de Zeeuw et al. 2002; Howell 2005). The results, e.g. a dynamically de-coupled core, and dust filaments in the inner center of the galaxy were early on interpreted as reminiscent of a merger (Kormendy 1984), which since has neither been confirmed (Howell 2005) nor securely ruled out (Hopp 1995). Hence NGC 5813 is an interesting target when searching for age sub-populations in the GCS. As shown in Figure 5 the globular cluster sample (18 objects) is dominated by a large fraction of blue ( 2.6), globular clusters. Comparing the optical and near-infrared colors (see Table 7) of the GCs with the SSP models leaves room for an intermediate age population although the small number of objects, especially within the metal rich region hampers the interpretation. Given the various galaxy properties and our preliminary and not very conclusive results, NGC 5813 remains a prime target for GC studies, which would require deeper near-infrared data built on either additional long exposure and/or wider-field ground-based data in good seeing or space-based observations (HST/NICMOS). In our galaxy sample NGC 5813 represents galaxies in a low density environment, similar to NGC 3585.
4 Low Mass X-Ray Binaries in Globular Clusters
Early-type galaxies are not only large concentrations of stellar mass but also major sources of X-ray emission. Chandra studies have revealed that in many ordinary elliptical galaxies, much of this emission comes from individual low-mass X-ray binaries (LMXBs) (e.g. Trinchieri & Fabbiano 1985; Sarazin, Irwin, and Bregman 2000). Further work has shown that many (about 40%) of these LMXBs are located in globular clusters (e.g. Angelini, Loewenstein, and Mushotzky 2001; Kundu, Maccarone, and Zepf 2002; Kundu, Maccarone, and Zepf 2006; Fabbiano 2006). The much higher number of X-ray sources per unit stellar mass in globular clusters than in the field is strong evidence that most or all of these systems are formed dynamically through tidal captures, exchange interactions, or direct collisions of compact objects with stars (e.g. Clark 1975; Katz 1975a,b; Fabian, Pringle, and Rees 1975; Verbunt 1987).
Moreover, since less than one percent of the light of an elliptical galaxy originates from star clusters, it follows that LMXBs are about two orders of magnitude more likely to be found in GCs than in the field. This strongly points to an important role for the dynamical formation of LMXBs in globular clusters, as has also long been realized from Galactic studies of LMXBs and globular clusters (e.g. Bhattacharya 1995, and references therein). Because of the strong connection between globular clusters and LMXBs, we can use our knowledge about globular clusters to gain information about the formation and evolution of the LMXBs.
Chandra data is available for three of the four galaxies in our sample, NGC 4472, NGC 4594, and NGC 3585. The galaxies were observed with Chandra on June 12, 2000, May 31, 2001, and June 03, 2001, respectively. The total integration time was 39.6 ksec, 20.0 ksec, and 35.7 ksec.
To match the LMXBs with the GC catalog we use the list of objects
detected in the range of 0.5 to 8.0 keV. Standard data reduction
procedures were used for filtering the X-ray data for high background
intervals, making images, and extraction source lists. These
procedures are the same for all galaxies as they were for NGC 4472
(for details see Maccarone, Kundu, and Zepf 2003). In Figures
6 and 7 LMXBs associated with globular
clusters are plotted (large symbols) together with the GCs without
LMXB detections (small symbols). Similar to the combination of the
optical and near-infrared data (see Section 2.3) we used the
IRAF task tfinder to match the Chandra detections with the
globular cluster photometry. With both data sets centered on the
galaxies this study is somewhat hampered by the underlying galaxy
light. Including the relatively small size of the FOV (2’ 2’)
in the K-band observations we match 7, 4 and 3 (4) LMXBs in NGC 4472,
NGC 4594 and NGC 3585, respectively. We note that the brightest object
(B20.5 mag) in NGC 3585 may not be a GC. Based on the apparent
B-band magnitude and the distance modulus given in Table
1, we derive that this cluster is about 4 times as
luminous as CEN, the Milky Way’s most luminous globular
cluster. Although it is by far the brightest object in terms of B-band
magnitude (20.47 mag) we find the corresponding X-ray source to be
the faintest of the four detections
(LX8.4*1037erg/sec). Tentatively we would therefore
exclude the possibility of this object being an AGN and not a globular
cluster.
Based on the color-color plots (see Figure 7), most of the LMXBs in our sample are found in old and metal-rich globular clusters, which is in agreement with previous studies (e.g. Angelini et al. 2001; Kundu et al. 2002; Sarazin et al. 2003; Smits et al. 2006). With two exceptions (in NGC 4594 and NGC 3585) LMXBs are found in bright GCs (see Figure 6). Although our data allow a first comparison between LMXB and non-LMXB globular clusters (see Figures 1,3 and 4), numerous questions about the connection between GC properties and the formation efficiency of LMXBs remain. For example, does the formation efficiency scale directly with [Fe/H] or does the LMXB formation merely require a minimum metallicity?
5 Discussion and Summary
We have combined our near-infrared with existing optical photometry of the globular cluster systems of NGC 4472, NGC 4594, NGC 3585, and NGC 5813 to investigate the ages and metallicities of the globular cluster systems in these galaxies. One of the goals of this work is to help build the sample of galaxies with useful constraints on the age distribution of their globular clusters so that comparisons can be made between the formation history of their host galaxies and other galaxy properties such as mass and environment. The four galaxies studied here help achieve this goal by spanning a range of galaxy luminosities and environments from the Virgo cluster to lower density field regions.
The very high luminosity early-type galaxies in our sample, NGC 4472 and NGC 4594, both appear to have globular cluster systems that are premarily old (10 Gyr) with a broad metallicity distribution. This old age is clearly established in the Virgo elliptical NGC 4472 and also is very likely for the field early-type galaxy NGC 4594. The other two galaxies in the sample, NGC 3585 and NGC 5813, are elliptical galaxies with fairly typical luminosities found in the field or group environments. The modest sizes of the globular cluster samples with good optical to near-infrared colors for these two galaxies mitigate against strong conclusions, but the current data suggest NGC 3585 may be primarily old while NGC 5813 may have a significant intermediate age component.
It may be notable that of the four galaxies, the one with some evidence for a substantial intermediate age component, NGC 5813, is not in a cluster of galaxies and also not the most luminous galaxy in our sample. This is very broadly consistent with the idea that on average less luminous early-type galaxies in lower density environments are more likely to have had more recent formation activity (e.g. Kuntschner et al. 2002; Thomas et al. 2005, de Lucia et al. 2006, Sanchez-Blazques et al. 2006).
The existence of spectroscopic studies of some of the globular cluster systems studied here allows for an independent test of the near-infrared to optical photometric technique. For NGC 4472, the old age we find for the globular clusters is in excellent agreement with previous spectroscopic studies (Beasley et al. 2000, Cohen, Blakeslee, and Côté 2003). Similarly, while the numbers are not as large in both the spectroscopic and photometric datasets, the old ages we find for the NGC 4594 globular clusters also agree with earlier spectroscopic work (Larsen et al. 2002). Although with very few numbers, spectroscopic studies of NGC 3585 globular clusters (Puzia et al. 2005) are also consistent with our results. Moreover, our detection of galaxies with mostly old (10 Gyr) GCSs as well as the discovery of other galaxies which have GCSs with intermediate age sub-populations through the same technique (e.g. NGC 4365, Puzia et al. 2002; Hempel & Kissler-Patig 2004; Kundu et al. 2005) lend confidence to the supposition that the near-infrared to optical colors are identifying real differences in the GC systems for which the only known explanation is age.
A central long-term goal of this work is to compare the formation histories of early-type galaxies indicated by the age structure in their globular cluster systems to various theoretical models. An obvious step to reaching this goal is to expand the sample size of early-type galaxy GCSs with good near-infrared to optical photometry, of which this work is part. There are also several other steps that will be helpful in reaching this goal. One of these is obtaining wider-field near-infrared and optical photometry of a subset of these galaxies. Nearly all of the current constraints are for the inner few arc minutes corresponding to no more than several galactic effective radii. While this is in part because that is where many of the GCs are, it is also the case that GC systems extend to larger radii, and wider-field near-infrared and optical photometry will be very useful to assess whether the inner regions are fully representative of the whole GC system. Another important step for comparing GC systems of different ages is to properly account for dynamical evolution. This will require combined progress in both theoretical modeling and observational study of GC systems of a variety of ages. We also note that photometric studies can be complemented by spectroscopic data, obtained for selected globular clusters of each cluster sub-population. This provides an independent estimate of the ages and metallicities, and also potentially allows constraints on the duration of the star formation episode using the - enhancement in the GCs.
For NGC 4472, NGC 4594, and NGC 3585, we also match our near-infrared and optical GC photometry to Chandra observations of LMXBs in these galaxies. This allows us to probe the connection between GCs and LMXBs and test which properties of GCs are correlated with the presence of LMXBs. Utilizing near-infrared to optical colors for this work has two advantages. One is the ability to separate the effects of age and metallicity, thereby allowing age effects to be tested. The second advantage is improved metallicity determinations, both because any age effect in the colors can be accounted for and because of improved precision in the metallicity due to the larger wavelength baseline. We clearly confirm previous results that metal-rich GCs are much more likely to host LMXBs than metal-poor GCs. Additional data will be required to test whether this dependence on metallicity is roughly proportional to metallicity, or whether most of the effect is accounted for in the division between metal-poor and metal-rich populations.
References
- Angelini, Loewenstein and Mushotzky (2001) Angelini, L. and Loewenstein, M. and Mushotzky, R. F. 2001, ApJ, 557, L35
- Beasley et al. (2000) Beasley, M. A., Sharples, R. M., Bridges, T. J., Hanes, D. A., Zepf, S. E. et al. 2000, MNRAS, 318, 1249
- Bertin & Arnouts (1996) Bertin, E. and Arnouts, S. 1996, A&AS, 117, 393
- Bhattacharya (1995) Bhattacharya, D. 1995, Cambridge Astrophysics Series, Cambridge, MA: Cambridge University Press, edited by Lewin, Walter H.G.; Van Paradijs, Jan; Van den Heuvel, Edward P.J., 233
- Brodie et al. (2005) Brodie, J. P., Strader, J., Denicoló, G., Beasley, M. A., Cenarro, A. J., Larsen, S. S., Kuntschner, H., and Forbes, D. A 2005, AJ, 129, 2643
- Bruzual & Charlot (2003) Bruzual, G. and Charlot, S. 2003, MNRAS, 344, 1000
- Clark (1975) Clark, G.W. 1975, ApJ, 199, L143
- Cohen, Blakeslee, Côté (2003) Cohen, J. G., Blakeslee, J. P., and Côté, P. 2003, ApJ, 592, 866
- de Lucia et al. (2006) de Lucia, G. Springel, V.; White, S. D. M., Croton, D., Kauffmann, G. 2006, MNRAS, 366, 499
- de Vaucouleurs et al. (1991) de Vaucouleurs, G., de Vaucouleurs, A., Corwin, H. G., Buta, R. J., Paturel, G. et al. 1991, ”Third Reference Catalogue of Bright Galaxies”, Springer-Verlag Berlin Heidelberg New York
- de Zeeuw et al. (2002) de Zeeuw, P. T., Bureau, M., Emsellem, E., Bacon, R., Marcella Carollo, C. et al. 2002, MNRAS, 329, 513
- Fabbiano (2006) Fabbiano, G. 2006, ARA&A, 44, 323
- Fabian, Pringle and Rees (1975) Fabian, A. C., Pringle, J. E., and Rees, M. J. 1975, MNRAS, 172, 15
- Frogel (1998) Frogel, J. A. 1998, PASP, 110, 200
- Geisler, Lee and Kim (1996) Geisler, D., Lee, M. G., and Kim, E. 1996, AJ, 111, 1529
- Goudfrooij et al. (2001) Goudfrooij, P., Alonso, M. V., Maraston, C., and Minniti, D. 2001, MNRAS, 328, 237
- Hartigan & Hartigan (1985) Hartigan, J.A. and Hartigan, P.M. 1985, The Annals of Statistics, 13, 70
- Hawarden et al. (2001) Hawarden, T. G., Leggett, S. K., Letawsky, M. B., Ballantyne, D. R., and Casali, M. M. 2001, MNRAS, 325, 563
- Hempel et al. (2003) Hempel, M., Hilker, M., Kissler-Patig, M., Puzia, T. H., and Minniti, D. 2003, A&A, 405, 487
- Hempel & Kissler-Patig (2004) Hempel, M., and Kissler-Patig, M. 2004, A&A, 419, 863
- Hempel et al. (2005) Hempel, M., Geisler, D., Hoard, D. W., and Harris, W. E. 2005, A&A, 439, 59
- Hempel et al. (2006) Hempel, M., Kissler-Patig, M., Puzia, T.H., and Hilker, M. 2006, accepted by A&A
- Hopp, Wagner and Richtler (1995) Hopp , U., Wagner, S. J. and Richtler, T. 1995, A&A, 296, 633
- Howell (2005) Howell, J. H. 2005, AJ, 130, 2065
- Huchra & Geller (1982) Huchra, J. P., and Geller, M. J. 1982, ApJ, 257, 423
- Katz (1975a) Katz, J. I. 1975, A&A, 39, 241
- Katz (1975b) Katz, J. I. 1975, Nature, 253, 698
- Kent (1988) Kent, S. M. 1988, AJ, 96, 514
- Kissler-Patig, Brodie and Minniti (2002) Kissler-Patig, M., Brodie, J. P., and Minniti, D. 2002, A&A, 391, 441
- Kormendy (1984) Kormendy, J. 1984, ApJ, 287, 577
- Kundu & Whitmore (1998) Kundu, A., and Whitmore, B. C. 1998, AJ, 116, 2841
- Kundu & Whitmore (2001a) Kundu, A., and Whitmore, B. C. 2001, AJ, 116, 2841
- Kundu & Whitmore (2001b) Kundu, A., and Whitmore, B. C. 2001, AJ, 121, 2950
- Kundu, Maccarone and Zepf (2002) Kundu, A., Maccarone, T. J., and Zepf, S. E 2002, ApJ, 574, L5
- Kundu et al. (2003) Kundu, A., Maccarone, T. J., Zepf, S. E., and Puzia, T. H. 2003, 589, L81
- Kundu et al. (2005) Kundu, A., Zepf, S. E., Hempel, M., Morton, D.,and Ashman, K. M. 2005,ApJ, 598, L81
- Kundu, Maccarone and Zepf (2006) Kundu, A., Maccarone, T. J., and Zepf, S. E. 2006, submitted to ApJ
- Kuntschner et al. (2002) Kuntschner, H., Smith, R.J., Colless, M., Davies, R.L., Kaldare, R., Vazdekis, A. 2002, MNRAS, 337,172
- Larsen et al. (2002) Larsen, S. S., Brodie, J. P., Beasley, M. A., and Forbes, D. A. 2002, AJ, 124, 828
- Maccarone, Kundu and Zepf (2003) Maccarone, T. J., Kundu, A., and Zepf, S. E. 2003, ApJ, 586, 814
- Martini & Perrson (2004) Martini, P., and Perrson, E. 2004, “PANIC Observer’s Manual”
- Martini et al. (2004) Martini, P., Persson, S. E., Murphy, D. C., Birk, C., and Shectman, S. A. 2004, “PANIC: a near-infrared camera for the Magellan telescopes”, in “Ground-based Instrumentation for Astronomy”, edited by Alan F. M. Moorwood and Iye Masanori, Proceedings of the SPIE, 5492, 1653
- Pahre (1999) Pahre, M. A. 1999, ApJS, 124, 127
- Persson et al. (1998) Persson, S. E., Murphy, D. C., Krzeminski, W., Roth, M., and Rieke, M. J. 1998, AJ, 116, 2475
- Puzia et al. (2002) Puzia, T. H., Zepf, S. E., Kissler-Patig, M., Hilker, M., and Minniti, D. et al. 2002, A&A, 391, 453
- Puzia et al. (2004) Puzia, T. H., Kissler-Patig, M., Thomas, D., Maraston, C. and Saglia, R. P. et al. 2004, A&A, 415, 123
- Puzia et al. (2005) Puzia, T. H., Kissler-Patig, M., Thomas, D., Maraston, C., and Saglia, R. P. et al. 2005, A&A, 439, 997
- Rhode & Zepf (2001) Rhode, K. L., and Zepf, S. E. 2001, AJ, 121, 210
- Rhode & Zepf (2004) Rhode, K. L. and Zepf, S. E. 2004, AJ, 127, 302
- Sarazin, Irwin and Bregman (2000) Sarazin, C. L., Irwin, J. A., and Bregman, J. N. 2000, ApJ, 544, L101
- Sanches-Blazques et al. (2006) Sanches-Blazques, P., Gorgas, J., Cardiel, N., Gonzales, J.J. 2006, A&A,457, 809
- Sarazin et al. (2003) Sarazin, C. L., Kundu, A., Irwin, J. A., Sivakoff, G. R., and Blanton, E. L. 2003, ApJ, 595, 743
- Schlegel, Finkbeiner and Davis (1998) Schlegel, D. J., Finkbeiner, D. P., and Davis, M. 1998, ApJ, 500, 525
- Smits et al. (2006) Smits, M.,Maccarone, T., Kundu, A., and Zepf, S.E. 2006, astro-ph/060813
- Stetson (1988) Stetson, P. B. 1988,”The accuracy of Stellar Photometry with CCD’s”, in: DAO preprint
- Thomas et al. (2005) Thomas,D., Maraston, C., Bender, R., Mendes de Olivera, C. 2005,ApJ, 621, 673
- Tonry et al. (2001) Tonry, J. L., Dressler, A., Blakeslee, J. P., Ajhar, E. A., and Fletcher, A. B. 2001, ApJ, 546, 681
- Trinchieri & Fabbiano (1985) Trinchieri, G., and Fabbiano, G. 1985, ApJ, 296, 447
- Tully & Fisher (1988) Tully, R. B., and Fisher, J. R. 1988, “Catalog of Nearby Galaxies”, Annales de Geophysique
- Verbunt (1987) Verbunt, F. 1987, ApJ, 312, L23
- Worthey (1994) Worthey, G. 1994, ApJS, 95, 107
(1) Tonry et al. (2001),
(2) de Vaucouleurs et al. (1991),
(3) Tully & Fisher (1988),
(4) Pahre (1999),
(5) Schlegel, Finkenbeiner, and Davies (1998)
| Property | NGC 4594 | NGC 4472 | NGC 3585 | NGC 5813 |
|---|---|---|---|---|
| (1) | 29.95 | 31.06 | 31.51 | 32.54 |
| MV (2) | -22.4 | -22.75 | -21.92 | -21.79 |
| [Mpc-3] (3) | 0.32 | 3.31 | 0.12 | 0.88 |
| 0 (1) | 1.175 | 1.218 | 1.160 | 1.189 |
| D25 (4) | 8.40 | 11.40 | 4.50 | 3.70 |
| AB [mag] (5) | 0.221 | 0.096 | 0.276 | 0.246 |
| NGC 4594 | NGC 4472 | NGC 3585 | NGC 5813 | |
|---|---|---|---|---|
| ZPphot [mag] | 24.398 | 24.300 | 24.415 | 24.411 |
| ZPphot [mag] | 0.014 | 0.043 | 0.043 | 0.030 |
| effective airmass | 1.233 | 1.338 | 1.267 | 1.294 |
| offset [mag] | 24.395 | 24.385 | 24.402 | 24.407 |
| AK [mag] (1) | 0.019 | 0.008 | 0.023 | 0.021 |
(1) VLT/FORS2
(2) HST/WFPC2; F555W
(3) HST/WFPC2; F658W
(4) HST/WFPC2; F814W
| NGC 4472 | NGC 4594 | NGC 3585 | NGC 5813 | |
|---|---|---|---|---|
| B | – | – | 800 sec (1) | – |
| V | 1800 (2) | 1600 (3) | – | 1000 (2) |
| I | 1800 (4) | 1470 (4) | 800 sec (1) | 460 (4) |
| ID | RA [h:m:s] | DEC [d:m:s] | V [mag] | V [mag] | I [mag] | I [mag] | K [mag] | K [mag] |
|---|---|---|---|---|---|---|---|---|
| 1 | 12:29:43.0 | 7:59:10.9 | 22.350 | 0.030 | 21.080 | 0.030 | 19.074 | 0.095 |
| 2 | 12:29:43.1 | 8:00:40.2 | 21.110 | 0.010 | 20.100 | 0.010 | 18.575 | 0.060 |
| 3 | 12:29:43.3 | 8:00:22.1 | 21.350 | 0.020 | 20.360 | 0.020 | 18.911 | 0.082 |
| 4 | 12:29:43.5 | 8:00: 7.3 | 22.110 | 0.030 | 20.920 | 0.030 | 19.280 | 0.114 |
| 5 | 12:29:43.5 | 7:59:49.7 | 22.240 | 0.030 | 20.930 | 0.030 | 18.971 | 0.086 |
| 6 | 12:29:43.6 | 8:00:53.4 | 21.860 | 0.020 | 20.690 | 0.020 | 19.144 | 0.101 |
| 7 | 12:29:44.5 | 7:59:19.9 | 22.230 | 0.020 | 21.240 | 0.020 | 19.549 | 0.146 |
| 8 | 12:29:44.6 | 7:59:54.6 | 22.380 | 0.050 | 21.160 | 0.040 | 19.238 | 0.110 |
| 9 | 12:29:44.6 | 7:59:35.9 | 21.180 | 0.020 | 20.150 | 0.020 | 19.038 | 0.091 |
| 10 | 12:29:45.1 | 7:59:50.9 | 21.830 | 0.030 | 20.510 | 0.030 | 18.694 | 0.067 |
| 11 | 12:29:45.4 | 7:59:37.0 | 21.390 | 0.020 | 20.130 | 0.020 | 18.204 | 0.043 |
| 12 | 12:29:46.0 | 7:59:17.4 | 21.530 | 0.010 | 20.360 | 0.010 | 18.540 | 0.058 |
| 13 | 12:29:46.3 | 7:59:49.3 | 21.380 | 0.010 | 20.240 | 0.010 | 18.658 | 0.065 |
| 14 | 12:29:46.5 | 8:00:34.5 | 21.730 | 0.030 | 20.450 | 0.020 | 18.522 | 0.057 |
| 15 | 12:29:46.6 | 7:59:41.0 | 21.220 | 0.020 | 20.070 | 0.030 | 16.193 | 0.008 |
| 16 | 12:29:46.6 | 8:00:33.8 | 21.370 | 0.020 | 20.060 | 0.020 | 18.231 | 0.044 |
| 17 | 12:29:46.8 | 8:00:25.1 | 21.760 | 0.040 | 20.500 | 0.040 | 19.029 | 0.091 |
| 18 | 12:29:47.3 | 7:59:45.7 | 21.210 | 0.010 | 19.940 | 0.010 | 18.129 | 0.040 |
| 19 | 12:29:47.3 | 8:00: 0.0 | 22.100 | 0.030 | 20.980 | 0.040 | 18.857 | 0.078 |
| 20 | 12:29:47.4 | 7:59:12.0 | 22.130 | 0.010 | 20.900 | 0.010 | 19.416 | 0.129 |
| 21 | 12:29:47.4 | 8:00: 4.5 | 23.450 | 0.100 | 22.210 | 0.090 | 19.091 | 0.096 |
| 22 | 12:29:47.5 | 7:59:36.1 | 22.180 | 0.030 | 20.990 | 0.030 | 19.429 | 0.131 |
| 23 | 12:29:47.7 | 8:00:24.7 | 21.810 | 0.020 | 20.890 | 0.020 | 19.394 | 0.127 |
| 24 | 12:29:47.7 | 7:59:53.6 | 22.420 | 0.020 | 21.310 | 0.030 | 19.478 | 0.137 |
| 25 | 12:29:47.8 | 7:59:26.3 | 22.630 | 0.030 | 21.360 | 0.030 | 19.349 | 0.121 |
| 26 | 12:29:47.9 | 7:59:19.6 | 21.330 | 0.010 | 20.130 | 0.010 | 18.411 | 0.052 |
| 27 | 12:29:48.1 | 8:00:21.2 | 22.220 | 0.020 | 20.900 | 0.020 | 19.046 | 0.092 |
| 28 | 12:29:49.1 | 7:59:53.6 | 21.680 | 0.010 | 20.500 | 0.010 | 19.092 | 0.096 |
| 29 | 12:29:49.1 | 8:00:35.0 | 22.510 | 0.020 | 21.200 | 0.020 | 19.114 | 0.098 |
| 30 | 12:29:49.2 | 8:00:56.2 | 21.350 | 0.010 | 20.060 | 0.010 | 17.947 | 0.034 |
| 31 | 12:29:49.5 | 7:59:35.1 | 21.840 | 0.010 | 20.600 | 0.010 | 18.782 | 0.072 |
| 32 | 12:29:49.6 | 7:59:40.7 | 21.970 | 0.010 | 20.960 | 0.010 | 19.485 | 0.138 |
| 33 | 12:29;49.8 | 7:59:16.2 | 21.870 | 0.010 | 20.700 | 0.010 | 19.001 | 0.088 |
| 34 | 12:29:50.0 | 7:59:36.1 | 23.100 | 0.030 | 21.750 | 0.030 | 19.517 | 0.142 |
| 35 | 12:29:50.0 | 7:59:43.7 | 21.970 | 0.010 | 20.730 | 0.010 | 19.204 | 0.106 |
| 36 | 12:29:50.1 | 7:59:44.2 | 21.410 | 0.010 | 20.280 | 0.010 | 18.928 | 0.083 |
| 37 | 12:29:50.4 | 8:00:14.2 | 21.260 | 0.010 | 19.960 | 0.010 | 17.761 | 0.029 |
| ID | RA [h:m:s] | DEC [d:m:s] | V [mag] | V [mag] | I [mag] | I [mag] | K [mag] | K [mag] |
|---|---|---|---|---|---|---|---|---|
| 1 | 12:40: 0.3 | -11:37:21.6 | 19.401 | 0.008 | 18.138 | 0.006 | 16.091 | 0.010 |
| 2 | 12:39:59.3 | -11:37:12.2 | 21.250 | 0.031 | 20.200 | 0.028 | 18.906 | 0.097 |
| 3 | 12:39:58.7 | -11:37:17.8 | 20.417 | 0.018 | 19.321 | 0.014 | 17.440 | 0.031 |
| 4 | 12:39:58.6 | -11:37:26.0 | 20.412 | 0.014 | 19.022 | 0.011 | 17.311 | 0.044 |
| 5 | 12:39:58.9 | -11:37:43.1 | 20.306 | 0.013 | 19.024 | 0.008 | 17.116 | 0.020 |
| 6 | 12:40: 2.1 | -11:37:21.7 | 20.997 | 0.029 | 19.686 | 0.023 | 17.744 | 0.048 |
| 7 | 12:40: 2.1 | -11:37: 8.8 | 20.344 | 0.023 | 19.114 | 0.018 | 17.377 | 0.031 |
| 8 | 12:40: 2.5 | -11:37: 7.4 | 21.193 | 0.019 | 19.941 | 0.016 | 17.911 | 0.039 |
| 9 | 12:40: 0.9 | -11:37: 6.6 | 19.836 | 0.010 | 18.650 | 0.009 | 16.913 | 0.019 |
| 10 | 12:40: 1.0 | -11:36:54.2 | 20.443 | 0.011 | 19.428 | 0.009 | 18.070 | 0.060 |
| 11 | 12:40: 2.6 | -11:36:40.9 | 21.182 | 0.016 | 19.977 | 0.011 | 18.300 | 0.058 |
| 12 | 12:40: 0.7 | -11:36:49.6 | 21.053 | 0.018 | 20.020 | 0.015 | 18.686 | 0.121 |
| 13 | 12:40: 0.6 | -11:36:45.4 | 20.883 | 0.015 | 19.738 | 0.010 | 18.192 | 0.066 |
| 14 | 12:40: 2.6 | -11:36:27.6 | 21.155 | 0.016 | 20.147 | 0.012 | 19.192 | 0.128 |
| 15 | 12:39:59.3 | -11:36:30.4 | 20.650 | 0.012 | 19.445 | 0.007 | 17.784 | 0.047 |
| 16 | 12:40: 2.2 | -11:37:59.8 | 19.658 | 0.007 | 18.386 | 0.005 | 16.146 | 0.008 |
| 17 | 12:40: 3.1 | -11:37:19.8 | 22.602 | 0.095 | 21.179 | 0.056 | 18.734 | 0.073 |
| 18 | 12:39:58.7 | -11:37:47.4 | 20.356 | 0.012 | 19.356 | 0.009 | 17.969 | 0.063 |
| 19 | 12:39:59.8 | -11:37:55.7 | 22.107 | 0.041 | 20.857 | 0.027 | 18.610 | 0.128 |
| 20 | 12:40: 0.2 | -11:37:53.3 | 20.052 | 0.009 | 19.049 | 0.007 | 17.620 | 0.038 |
| 21 | 12:40: 1.0 | -11:37:55.5 | 20.176 | 0.010 | 18.932 | 0.006 | 16.966 | 0.018 |
| 22 | 12:39:58.2 | -11:38:18.9 | 21.237 | 0.016 | 20.142 | 0.012 | 18.456 | 0.070 |
| 23 | 12:39:58.5 | -11:38:20.1 | 21.789 | 0.026 | 20.613 | 0.016 | 19.046 | 0.147 |
| 24 | 12:40: 1.8 | -11:38: 2.9 | 21.888 | 0.029 | 20.598 | 0.018 | 18.719 | 0.102 |
| 25 | 12:39:59.2 | -11:38:20.0 | 20.969 | 0.015 | 19.798 | 0.009 | 17.960 | 0.048 |
| 26 | 12:40: 1.7 | -11:38:22.1 | 21.399 | 0.019 | 20.420 | 0.014 | 19.167 | 0.142 |
| ID | RA [h:m:s] | DEC [d:m:s] | B [mag] | B [mag] | I [mag] | I [mag] | K [mag] | K [mag] |
|---|---|---|---|---|---|---|---|---|
| 1 | 11:13:17.3 | -26:46: 9.9 | 22.990 | 0.019 | 20.813 | 0.010 | 18.975 | 0.052 |
| 2 | 11:13:19.1 | -26:46: 4.6 | 23.043 | 0.020 | 20.859 | 0.010 | 18.999 | 0.053 |
| 3 | 11:13:15.9 | -26:45:56.6 | 22.414 | 0.012 | 20.778 | 0.009 | 18.301 | 0.029 |
| 4 | 11:13:20.2 | -26:45:50.7 | 18.567 | 0.001 | 16.756 | 0.001 | 14.935 | 0.002 |
| 5 | 11:13:15.7 | -26:45:53.5 | 22.977 | 0.019 | 20.795 | 0.009 | 17.976 | 0.021 |
| 6 | 11:13:13.8 | -26:45:51.1 | 22.700 | 0.015 | 20.549 | 0.008 | 18.604 | 0.037 |
| 7 | 11:13:18.9 | -26:45:42.2 | 23.373 | 0.026 | 21.241 | 0.014 | 19.275 | 0.068 |
| 8 | 11:13:20.2 | -26:45:38.3 | 21.969 | 0.009 | 19.836 | 0.004 | 17.810 | 0.018 |
| 9 | 11:13:16.3 | -26:45:37.7 | 22.529 | 0.013 | 20.375 | 0.007 | 18.609 | 0.037 |
| 10 | 11:13:15.7 | -26:45:29.1 | 24.086 | 0.049 | 21.373 | 0.016 | 19.199 | 0.064 |
| 11 | 11:13:15.9 | -26:45:23.5 | 22.097 | 0.010 | 19.864 | 0.004 | 17.127 | 0.010 |
| 12 | 11:13:14.7 | -26:45:22.6 | 23.055 | 0.020 | 20.855 | 0.010 | 19.105 | 0.059 |
| 13 | 11:13:14.3 | -26:45:18.3 | 23.848 | 0.039 | 21.687 | 0.020 | 19.604 | 0.092 |
| 14 | 11:13:16.4 | -26:45: 6.1 | 22.789 | 0.016 | 20.520 | 0.007 | 19.236 | 0.066 |
| 15 | 11:13:19.1 | -26:45: 4.9 | 23.210 | 0.023 | 21.117 | 0.012 | 19.478 | 0.082 |
| 16 | 11:13:14.5 | -26:45: 2.3 | 23.485 | 0.028 | 21.366 | 0.015 | 20.084 | 0.142 |
| 17 | 11:13:16.1 | -26:45: 1.1 | 23.060 | 0.022 | 19.419 | 0.003 | 17.653 | 0.016 |
| 18 | 11:13:16.8 | -26:44:57.7 | 20.475 | 0.003 | 18.212 | 0.001 | 16.686 | 0.007 |
| 19 | 11:13:13.4 | -26:44:58.8 | 23.021 | 0.019 | 21.258 | 0.014 | 19.881 | 0.111 |
| 20 | 11:13:16.9 | -26:44:52.0 | 22.209 | 0.011 | 19.055 | 0.002 | 17.191 | 0.011 |
| 21 | 11:13:18.8 | -26:44:47.1 | 22.663 | 0.014 | 20.698 | 0.009 | 19.082 | 0.057 |
| 22 | 11:13:18.9 | -26:44:47.1 | 23.753 | 0.039 | 20.271 | 0.006 | 18.454 | 0.033 |
| 23 | 11:13:16.7 | -26:44:41.7 | 23.199 | 0.022 | 21.282 | 0.014 | 19.838 | 0.114 |
| 24 | 11:13:15.7 | -26:44:31.9 | 22.751 | 0.016 | 20.570 | 0.008 | 18.894 | 0.048 |
| 25 | 11:13:19.8 | -26:44:26.5 | 22.029 | 0.009 | 19.803 | 0.004 | 17.610 | 0.015 |
| 26 | 11:13:15.1 | -26:44:28.7 | 24.754 | 0.086 | 22.582 | 0.046 | 19.786 | 0.108 |
| ID | RA [h:m:s] | DEC [d:m:s] | V [mag] | V [mag] | I [mag] | I [mag] | K [mag] | K [mag] |
|---|---|---|---|---|---|---|---|---|
| 1 | 15: 1:10.1 | 1:42: 6.4 | 21.982 | 0.020 | 20.908 | 0.031 | 19.461 | 0.134 |
| 2 | 15: 1:12.1 | 1:42:13.7 | 22.030 | 0.021 | 20.942 | 0.033 | 19.386 | 0.103 |
| 3 | 15: 1:12.2 | 1:41:59.5 | 21.475 | 0.015 | 19.740 | 0.013 | 18.087 | 0.030 |
| 4 | 15: 1:10.3 | 1:42:42.2 | 24.296 | 0.093 | 22.058 | 0.063 | 18.837 | 0.047 |
| 5 | 15: 1: 9.6 | 1:42:43.2 | 24.686 | 0.137 | 22.086 | 0.058 | 18.744 | 0.044 |
| 6 | 15: 1: 8.6 | 1:42:59.0 | 22.994 | 0.029 | 21.764 | 0.040 | 19.749 | 0.142 |
| 7 | 15: 1: 8.8 | 1:42:52.8 | 21.949 | 0.016 | 21.022 | 0.025 | 19.694 | 0.141 |
| 8 | 15: 1: 9.8 | 1:42:27.0 | 20.913 | 0.009 | 20.036 | 0.014 | 19.162 | 0.084 |
| 9 | 15: 1: 8.7 | 1:42:45.4 | 22.366 | 0.020 | 21.342 | 0.033 | 19.680 | 0.135 |
| 10 | 15: 1: 8.6 | 1:42:36.4 | 22.049 | 0.016 | 20.963 | 0.023 | 19.411 | 0.090 |
| 11 | 15: 1: 8.7 | 1:42: 9.2 | 21.722 | 0.014 | 20.753 | 0.023 | 19.015 | 0.055 |
| 12 | 15: 1:11.4 | 1:42:41.9 | 23.600 | 0.066 | 22.647 | 0.098 | 19.576 | 0.100 |
| 13 | 15: 1:11.4 | 1:42:42.2 | 22.320 | 0.021 | 21.298 | 0.031 | 19.576 | 0.100 |
| 14 | 15: 1:12.4 | 1:42:54.7 | 21.681 | 0.013 | 20.654 | 0.018 | 19.036 | 0.065 |
| 15 | 15: 1:11.4 | 1:42:55.8 | 23.654 | 0.054 | 21.574 | 0.035 | 18.433 | 0.035 |
| 16 | 15: 1:12.1 | 1:43: 3.4 | 22.174 | 0.016 | 21.095 | 0.024 | 19.623 | 0.128 |
| 17 | 15: 1:12.4 | 1:42:22.5 | 21.404 | 0.012 | 20.447 | 0.020 | 18.911 | 0.066 |
| 18 | 15: 1:12.1 | 1:42:35.3 | 21.622 | 0.014 | 20.620 | 0.020 | 19.233 | 0.078 |
| 19 | 15: 1:13.6 | 1:42: 8.2 | 21.703 | 0.015 | 20.673 | 0.021 | 19.233 | 0.084 |
| 20 | 15: 1:13.1 | 1:42:31.2 | 22.914 | 0.036 | 20.757 | 0.026 | 17.160 | 0.009 |
| 21 | 15: 1:14.4 | 1:42:10.4 | 21.167 | 0.010 | 20.092 | 0.015 | 18.387 | 0.034 |
| 22 | 15: 1:13.5 | 1:42:40.5 | 21.939 | 0.017 | 20.912 | 0.025 | 19.304 | 0.082 |