Discovery of a flux-related change of the cyclotron line energy in
Her X-1
Abstract
Aims. We present the results of ten years of repeated measurements of the Cyclotron Resonance Scattering Feature (CRSF) in the spectrum of the binary X-ray pulsar Her~X-1 and report the discovery of a positive correlation of the centroid energy of this absorption feature in pulse phase averaged spectra with source luminosity.
Methods. Our results are based on a uniform analysis of observations by the RXTE satellite from 1996 to 2005, using sufficiently long observations of 12 individual 35-day Main-On states of the source.
Results. The mean centroid energy of the CRSF in pulse phase averaged spectra of Her X-1 during this time is around 40 keV, with significant variations from one Main-On state to the next. We find that the centroid energy of the CRSF in Her X-1 changes by 5% in energy for a factor of 2 in luminosity. The correlation is positive, contrary to what is observed in some high luminosity transient pulsars.
Conclusions. Our finding is the first significant measurement of a positive correlation between and luminosity in any X-ray pulsar. We suggest that this behaviour is expected in the case of sub-Eddington accretion and present a calculation of a quantitative estimate, which is very consistent with the effect observed in Her X-1. We urge that Her X-1 is regularly monitored further and that other X-ray pulsars are investigated for a similar behaviour.
Key Words.:
magnetic fields, neutron stars, – radiation mechanisms, cyclotron scattering features – accretion, accretion columns – binaries: eclipsing – stars: Her X-1 – X-rays: general – X-rays: stars1 Introduction
The X-ray spectrum of the accreting binary pulsar Her X-1 is
characterized by a power law continuum with exponential cut-off and an
apparent line-like feature, which was discovered in 1975
(Trümper et al., 1978).
This feature is now generally accepted as an absorption feature around
40 keV due to resonant scattering of photons off electrons on
quantized energy levels (Landau levels) in the Teragauss magnetic
field at the polar cap of the neutron star. The feature is therefore
often referred to as a cyclotron resonant scattering feature (CRSF). The
energy spacing between the Landau levels is given by , where
, providing a direct method of measuring
the magnetic field strength at the site of the emission of the X-ray
spectrum. The observed line energy is subject to gravitational
redshift, , such that the magnetic field may be estimated by
. The discovery of the
cyclotron feature in the spectrum of Her X-1 provided the first ever
‘direct measurement’ of the magnetic field strength of a neutron star,
in the sense that no other model assumptions are needed. Originally
considered an exception, cyclotron features are now known to be rather
common in accreting X-ray pulsars, with more than a dozen binary
pulsars now being confirmed cyclotron line sources (Coburn et al., 2002).
In several objects, multiple lines have been detected (up to four
harmonics, see Staubert 2003, Heindl et al. 2004 for reviews).
In this Letter we present new results (from the last ten
years) on the energy of the cyclotron resonance scattering feature in the
pulse averaged X-ray spectrum of Her X-1, we summarize our knowledge
about its variability, and report the discovery of a positive correlation
between and X-ray luminosity and offer a physical
explanation. A quantitative description of the physics of the accretion
column under the condition of sub-Eddington accretion is consistent
with the observation. Preliminary results were given in Staubert et al. (2006).
2 Observations
Her X-1 is probably the best observed accreting binary X-ray pulsar. Its X-ray spectrum, including the CRSF, has been measured by many instruments since its discovery in 1975 (Trümper et al., 1978). Here we report on a coherent analysis of ten years (1996–2005) of repeated observations by RXTE, including a reanalysis of those data already used by Gruber et al. (2001). Main-On state (35 day-phases ) observations (where the X-ray flux is the highest) of ks duration were used. These RXTE measurements are of high quality and yield comparatively small uncertainties in the measured quantities. The joint spectral analysis of PCA and HEXTE data was performed using the standard XSPEC/FTOOLS (6.0.4) software. For the spectral model we have chosen the highecut model which is based on a power law continuum with exponential cut-off, and the CRSF is modeled by an absorption line with a Gaussian optical depth profile. Details of the fitting procedure can be found in Coburn et al. (2002). Here we discuss results from spectral analysis of pulse phase averaged spectra only (a pulse phase resolved analysis is in progress). Table 1 summarizes the observation dates, the measured CRSF centroid energies and the maximum X-ray fluxes for the corresponding 35 day Main-On states, as measured by the RXTE/ASM (formally determined by fitting the flux history of the respective Main-On by a template function derived from the average of many Main-On cycles). Table 1 also lists an additional data point from an observation with INTEGRAL (Klochkov et al., 2006).
| Observation | 35 d | Center | Line Energy | max. Flux |
|---|---|---|---|---|
| month/year | cycle | MJD | keV | ASM cts/s |
| RXTE | ||||
| July 96 | 257 | 50029.75 | ||
| Sep 97 | 269 | 50707.06 | ||
| Dec 00 | 304 | 51897.69 | ||
| Jan 01 | 305 | 51933.67 | ||
| May 01 | 308 | 52035.48 | ||
| June 01 | 309 | 52071.16 | ||
| Dec 01 | 314 | 52245.09 | ||
| Aug 02 | 321 | 52492.96 | ||
| Nov 02 | 324 | 52599.32 | ||
| Dec 02 | 325 | 52634.01 | ||
| Oct 04 | 344 | 53300.95 | ||
| July 05 | 352 | 53577.35 | ||
| INTEGRAL | ||||
| July 05 | 352 | 53576.00 |
3 Results
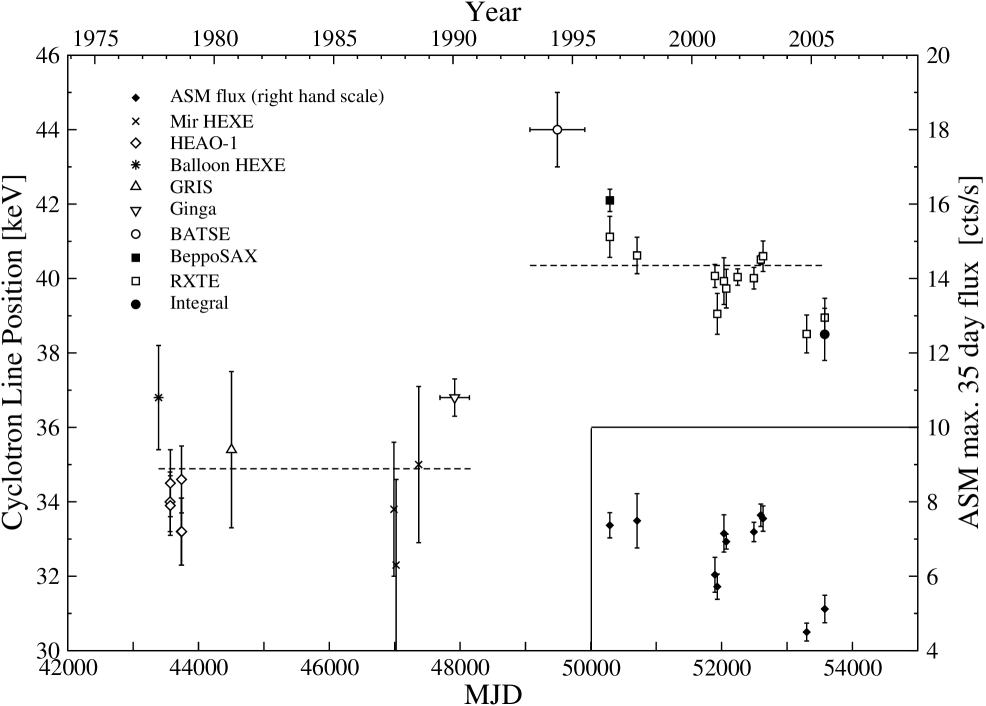
Fig. 1 displays the measured CRSF centroid energies as a function of time, combining the results of our analysis with historical measurements before the RXTE era, as taken from the compilation by Gruber et al. (2001, their tables 2 and 3), as well as the 2005 measurement by INTEGRAL (Klochkov et al., 2006). Also shown in Fig. 1 (right hand scale) is the maximum flux of the corresponding 35 d Main-On states as measured by RXTE/ASM. We report on two main results.
Firstly, we confirm the apparent difference in the mean cyclotron line energy before and after 1991, first pointed out by Gruber et al. (2001). Taking the measured values of and their stated uncertainties at face value, the mean cyclotron line energies (dotted lines in Fig. 1) from all measurements before 1991 is , the corresponding value for all measurements after 1991 is ( for RXTE results only, showing that the very high value measured by BATSE is not decisive). However, a comparison of measurements from different instruments is difficult because of systematic uncertainties due to calibration and analysis techniques. Nevertheless, we believe that the large difference of between the mean values and the relative internal consistency within the two groups (5 different instruments before 1991 and four after 1991) most likely indicate real physics (we will comment on this in the discussion).
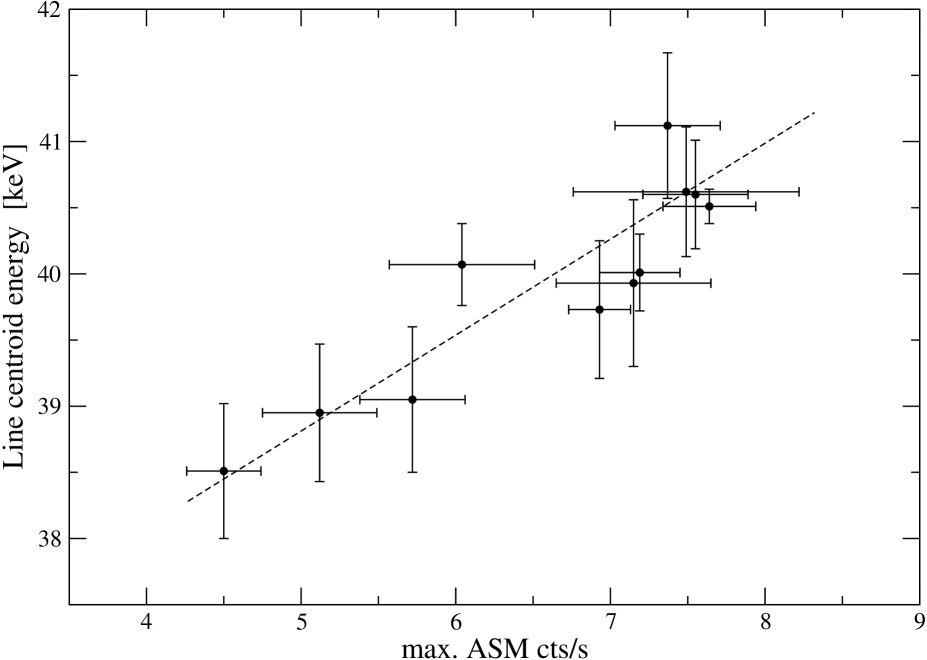
Secondly, we present a new result: we have detected a positive correlation between the maximum 35 d Main-On state X-ray flux (), which we take as a measure of the X-ray luminosity, and the cyclotron line centroid energy . If we take the locally measured fluxes (e.g. from our spectral fits) we find that they track the maximum ASM flux quite well and they show the same correlation with . However, we prefer the Main-On state maximum flux as the better information on the accretion state of the source, since the locally measured flux is subject to modulation by variable absorption/shading by the accretion disk.
For a quantitative analysis of this correlation, which is already evident from Fig. 1, we restrict ourselves to our results from RXTE data only (see Table 1), because they offer the advantage of maximum comparability due to a uniform analysis of data from the same instruments. In Fig. 2 we plot the cyclotron line centroid energy as a function of the maximum 35 d Main-On state RXTE/ASM flux. The dashed line is from a linear fit, taking uncertainties of both variables into account (see e.g. Numerical Recipies, 15.3), and it defines a slope of . Pearsons linear correlation coefficient is 0.90, the Spearman Rank correlation coefficient is 0.85 (corresponding to the probabilities to find these correlations by chance of and , respectively. We consider this correlation as highly significant.
We also point out here, that the apparent decrease of (and the correlated ASM count rate) with time after 1991, seen in Fig. 1, is an artifact due to the general variability of the source and the random way by which the data happened to be taken, and not a secular decrease. Despite strong short-term variability the RXTE/ASM light curve of Her X-1 does not provide any indication for a long-term ( yrs) change of the mean luminosity.
4 Variations in cyclotron lines
Apart from variations with pulse phase, shifts of line positions have in phase averaged spectra been found in correlation with changing X-ray luminosity in a number of high luminosity transient sources. However, these correlations are negative: is reduced when increases. Mihara et al. (1998) have interpreted this for 4U~0115+63, Cep~X-4, and V~0332+53, as due to a change in height of the shock (and emission) region above the surface of the neutron star with changing mass accretion rate, . The accretion is in the super-Eddington regime. In the model of Burnard et al. (1991), the height of the polar accretion structure is tied strongly to . From this model one expects that an increase in accretion rate leads to an increase in the height of the scattering region above the neutron star surface, and therfore to a decrease in magnetic field strength and hence . During the 2004/2005 outburst of V 0332+53 a clear anti-correlation of the line position with X-ray flux was observed (Kreykenbohm et al., 2005; Tsygankov et al., 2006a; Mowlavi et al., 2006). Analysing RXTE data of the Feb–Apr 1999 outburst of 4U 0115+63, both Nakajima et al. (2006) and Tsygankov et al. (2006b) find a general anti-correlation between and luminosity. There seems to be a steep dependence in a limited luminosity range ( erg/s), and neighboring regions at lower and higher luminosities with near independence of the two quantities. At the lowest luminosity the data are even consistent with a reversal of the dependence (albeit with low statistical significance).
For Her X-1, however, so far no clear relation between the cyclotron line energy and X-ray flux of any kind had been found (see e.g. Mihara et al., 1998; Gruber et al., 2001) (but see our note in the Discussion). In this Letter we report the first detection of a clear positive correlation between and X-ray luminosity in Her X-1 (and in any X-ray pulsar, if one requires a convincing evidence of sufficient significance; see the Discussion).
5 Physics in the sub-Eddington accretion regime
In the following we suggest a physical explanation of our finding and attempt a quantitative estimate of the expected effect. Since the pioneering paper by Basko & Sunyaev (1976), it has been known that the structure of the accretion column near the neutron star surface in X-ray pulsars differs for high-luminosity () and low-luminosity () regimes, where the critical luminosity is given by the local Eddington luminosity (Nelson et al., 1993)
| (1) |
Here is the NS mass (assumed to be 1.4 in the numerical estimation), is the photon-electron scattering cross-section in the magnetic field, is the Thomson cross-section, and is the half-opening angle of the polar cap magnetic field lines. We note that sub-/super-Eddington accretion cannot be judged by the observed luminosity alone, decisive is the local accretion rate which depends on the accretion area and the photon-electron scattering cross section, which in turn depends on the magnetic field (strength and structure). In the radiation-dominated super-Eddington regime the height of the accretion column increases with luminosity (Burnard et al., 1991). As discussed above, this explains the observed anti-correlation between the CRSF energy in spectra of bright transient X-ray pulsars with luminosity (Mihara et al., 1998; Tsygankov et al., 2006a, b; Nakajima et al., 2006), as the magnetic field value decreases with the height above the NS surface.
In the sub-Eddington regime of accretion, however, we can expect a different behaviour of the CRSF centroid energy when the luminosity changes, turning even to the opposite to what is observed in high-luminosity X-ray pulsars. For the set of RXTE observations of Her X-1 we have a case of sub-Eddington accretion in this X-ray pulsar. With the cyclotron line energy of about 40 keV, the cross-section of photon–electron scattering in the direction along the magnetic field lines (which is of interest for the radiation pressure against the infalling material) decreases (Harding & Lai, 2006, and references therein). At low energies where most of the photons are produced in the case of Her X-1, , and for an X-ray luminosity of a few times erg/s and not much smaller than 0.1 () the source is in the sub-Eddington regime.
The physical picture of magnetic accretion in low-luminosity X-ray pulsars was discussed by Nelson et al. (1993). We assume that the accreting protons lose their kinetic energy in an electron-proton atmosphere due to the Coulomb drag and collective plasma effects and neglect the possibility for the formation of a collisionless shock (see e.g. Langer & Rappaport, 1982). The characteristic braking length for protons can be identified with their mean free path , where is the effective interaction cross-section. A change in the observed cyclotron line energy can be associated with a change in the height of the emission region above the neutron star surface. We write the observed cyclotron energy as
| (2) |
where is the polar magnetic field strength, is the Schwarzschild metric coefficient determining the gravitational redshift . is the gravitational radius. Identifying the characteristic length with the height of the scattering region above the surface of the NS, we define (with being the radius of the NS). Then the fractional change of the cyclotron line energy is . Assuming a pure dipole field () we obtain .
The redshift term can be neglected since for a canonical neutron star its contribution is only of the order of 10% of the dipole term. Making the identification , we arrive at
| (3) |
Now we need to find how the density in the region of energy release and line formation is related to the luminosity. There is no simple estimate of this, but we can use the approach by Nelson et al. (1993) to find the structure of the accretion mound. In addition to the hydrostatic term considered by Nelson et al. (1993), we add the dynamical pressure of infalling protons so that the total pressure is . Here is the mass column density, is the temperature, and are the density and velocity of the free-falling matter at the beginning of the braking region. It is of course not a self-consistent treatment of the problem, but a step forward to account for dynamical pressure of accreting protons inside the braking region. For the free fall acceleration near the NS surface and (Miller et al., 1987), the hydrostatic term is not higher than . The dynamical term can be expressed using the solution found by Nelson et al. (1993) and the continuity equation ( is the accretion area for one pole) in the form , where is the Thompson optical depth and is the proton stopping depth. Clearly, the dynamical term vanishes at the base of the accretion column (i.e. at ) where the bulk kinetic energy of the protons is transformed into their thermal motion. It dominates, however, at the beginning of the deceleration region (for small and small , and for typical values like , of the NS surface area and . As the stopping depth is for magnetic accretion (Nelson et al., 1993), we find for (from where the emission escapes) .
As long as we can neglect a variation in (this is justified since the stopping length for and is very small), so main parameter which determines the density inside the stopping region is . We also neglect the principle dependence of on (due to the change of the disks inner radius ) since this dependence is weak (for dipolar field ). So we finally obtain:
| (4) |
We see that in the sub-Eddington accretion regime the fractional change in cyclotron line energy can be directly proportional to the fractional change in luminosity. For example, for the observed luminosity variations in Her X-1 (a change of a factor of two in the observed flux) the formula above gives . The stopping length is , the density estimation for , , , and yields , so . So the expected fractional change in the cyclotron line energy is , which is very close to the observed value of 5%. We note, however, that we used a fiducial value of appropriate for a weak magnetic field (Nelson et al., 1993), but in strong magnetic fields this value can be higher, the electron density would decrease and increase, accordingly. So we suggest that a measurement of can in fact be used to assess the stopping length of protons in the regime of sub-Eddington magnetic accretion onto neutron stars.
6 Discussion
Using standard parameters the calculations above for the sub-Eddington accretion regime lead to an estimate which is close to the observed effect in Her X-1 ( 5% in for a factor of two in luminosity). The decisive parameter is the local Eddington rate at the neutron star. Its value depends on the area upon which accretion proceeds, so it is expected to vary from pulsar to pulsar. In transient pulsars, such as 4U 0115+63, we may already have evidence for a transition from super- to sub-Eddington accretion (Tsygankov et al., 2006b; Nakajima et al., 2006; Terada et al., 2006) at the decline of the outburst when the luminosity drops below erg/s. The sharp jump in the observed cyclotron line energy in 4U 0115+63 reported by Tsygankov et al. (2006b) could be a sign of an abrupt change in the structure of the accretion column during such a transition.
It is conceivable that long-term variations in the accretion rate exist also in the persistent X-ray pulsar Her X-1. If so, we speculate that the abrupt jump in the cyclotron line energy in Her X-1 noticed in the early 1990s (Fig. 1) might be associated with a transition of this pulsar from super-Eddington to sub-Eddington accretion. We plan to have a close look at the historical data with respect to variations in absolute flux (which is not an easy task because of the difficulties connected with the inter-calibration of different instruments). Taking the binary X-ray pulsar A~0535+262 as an example, the absence of a strong luminosity dependence reported by Terada et al. (2006) may indicate that this source stays always in the sub-Eddington regime (for example, because the value increases with the magnetic field strength). If anything, we read a slight increase in with luminosity from Fig. 4 of Terada et al. (2006). Another indication of a positive correlation between and luminosity (and a qualitative interpretation) has been reported by LaBarbera et al. (2005) for GX~301–2 (albeit only on the basis of two observations and at a significance level of about 2 standard deviations). While Mihara et al. (1998) and Gruber et al. (2001) have shown that Her X-1 does not follow the negative correlation known from other sources, their data (Table 2 and Fig. 5, respectively) do in fact both show a small positive trend (not noticed by the two groups of authors at the time). While the statistical significance is low, both sets of data are consistent with our finding of 5% increase in for a factor of two increase in flux.
Finally, we note that Her X-1 is the only highly magnetized accreting pulsar for which repeated observations over longer periods of time exist. We therefore urge that the source continues to be monitored regularly, the source is bright and persistent and gives excellent statistics in relatively short observations.
Acknowledgements.
This work was supported by DFG through grants Sta 173/31-1,2 and 436 RUS 113/717 and RFBR grants RFFI-NNIO-03-02-04003 and 06-02-16025. We thank the anonymous referee for very good suggestions.References
- Basko & Sunyaev (1976) Basko, M. M. & Sunyaev, R. A. 1976, MNRAS, 175, 395
- Burnard et al. (1991) Burnard, D., Arons, J., & Klein, R. 1991, ApJ, 367, 575
- Coburn et al. (2002) Coburn, W., Heindl, W. A., Rothschild, R. E., et al. 2002, ApJ, 580, 394
- Gruber et al. (2001) Gruber, D. et al. 2001, ApJ, 562, 499
- Harding & Lai (2006) Harding, A. & Lai, D. 2006, RPPh, 69, 2631
- Heindl et al. (2004) Heindl, W. et al. 2004, in X-Ray Timing 2003, ed. S. Kaaret, Lamb, 323
- Klochkov et al. (2006) Klochkov, D., Staubert, R., Tsygankov, S., et al. 2006, in Proc. 6th INTEGRAL Conf., Moscow, in press
- Kreykenbohm et al. (2005) Kreykenbohm, I. et al. 2005, A&A, 451, L45
- LaBarbera et al. (2005) LaBarbera, A. et al. 2005, A&A, 438, 617
- Langer & Rappaport (1982) Langer, S. H. & Rappaport, S. 1982, 257, 733
- Mihara et al. (1998) Mihara, T. et al. 1998, PASJ, 43, 501
- Miller et al. (1987) Miller, G., Salpeter, E., & Wassermann, I. 1987, ApJ, 314, 215
- Mowlavi et al. (2006) Mowlavi, N., Kreykenbohm, I., et al. 2006, A&A, 451, 187
- Nakajima et al. (2006) Nakajima, M. et al. 2006, ApJ, 646, 1125
- Nelson et al. (1993) Nelson, R., Salpeter, E., & Wassermann, I. 1993, ApJ, 418, 874
- Staubert (2003) Staubert, R. 2003, in Multifrequency behaviour of high energy cosmic sources, ed. L.S.-G.F. Giovanelli, Vol. ChJAA, Vol. 3, S270
- Staubert et al. (1983) Staubert, R., Bezler, M., & Kendziorra, E. 1983, A&A, 117, 215
- Staubert et al. (2006) Staubert, R., Shakura, N., Postnov, K., et al. 2006, in Proc. 6th INTEGRAL Conf., Moscow, in press
- Terada et al. (2006) Terada, Y. et al. 2006, ApJ, 648, L139
- Trümper et al. (1978) Trümper, J. et al. 1978, ApJ, 219, L105
- Tsygankov et al. (2006a) Tsygankov, S. et al. 2006a, MNRAS, 371, 19
- Tsygankov et al. (2006b) Tsygankov, S. et al. 2006b, in Proc. 6th INTEGRAL Conf., Moscow, in press (astro-ph/0610476)